Sandipan Das* | Ankur Rawat | Sitesh Kumar Singh
© 2020 IIETA. This article is published by IIETA and is licensed under the CC BY 4.0 license (http://creativecommons.org/licenses/by/4.0/).
OPEN ACCESS
Electricity and energy demand are interlinked with changing weather patterns especially increase in global annual mean temperature, precipitation and population growth. The main aim of present study is to analyze the collective effect of the inducing aspects namely temperature, precipitation, population growth and retrofitting on the heating and cooling energy and electricity demand of households of Delhi for which the data of climate change, population and power & electricity have been used. The demand of power and electricity has a regular increase from Financial Year (FY) 2009- 2010 to FY 2018-2019 with respect to climate change scenario during time period 2010 to 2019 as shown in Table 1, 2 & 3 and Figure 4, which is closely connected with the decadal population growth. The electricity consumption goes up dramatically when the temperature increases in summer and decreases in winter months. Critical need to engage in electricity demand management to boost efficiency in use of electricity to become a low-energy consuming society in the future is the requirement of present time. Further research could explore a broader range of possible future electricity demand and climate change scenarios to capture various uncertainties.
climate change, decadal population growth, electricity demand, energy demand
Electricity and energy demand are interlinked with changing weather patterns especially increase in global annual mean temperature, precipitation and population growth. Scientists of climate change have view that recent global warming are causes of human activities like consumption of coal, gas and oil are still increasing every year globally [1].
The generation of climate misrepresentation continues, with opinions against climate science relative to policy arguments in publications by conservative organizations [2]. Most of the anthropogenic greenhouse gas (GHG) emissions that are accountable for this rise in global annual mean temperature stalks from the production and consumption of energy [3].
Increasing temperatures affect both the energy sector in general and the energy demand in special. The rise in global annual mean temperature is mainly due to the anthropogenic GHG discharges from the production and consumption of energy [3].
Building sector could be responsible for rising GHG discharges for the seek of electricity for cooling during hot periods and use of heater during winter season. The future change in temperature will influence by factors like production of electricity, imports and export of electricity activities as well as heating and cooling requirements.
It recognizes the need to increase energy efficiency and support climate friendly cooling solutions to ensure that populations can live, work and breathe while dramatically reducing greenhouse gas emissions [4]. End of 21st century the annual maximum load is set by summer cooling demand peaks [5].
Imbalance for the security of electricity supply may be arises due to inadequate production or a growing consumption of electricity. Huge variation in the demand and supply of the electricity of India are apparent and needs to explore further. The electricity sector of India is categorized in close interconnections between the electricity sectors in contrast to additional geographical areas and structural parts of the energy arrangement.
Therefore, annual electricity-related data accessible is important. Several researchers have studied future impacts of climate change on the energy production and consumption [6, 7]. Decarburization of the economy of world by the end of the 21st century and a carbon dioxide (CO2) emission reduction of 40-70% by 2050 [8].
With the fast acceptance of air conditioners in urban China over the past, cooling and heating have become one of the important factors of residential electricity consumption increase [9].
Thailand documented a gigantic energy usage since the nation-wide practice of use of air conditioners to relief from high temperature [10].
April is typically one of the hottest months in Thailand, marking the end of the dry season and the onset of monsoon rains. April heat reached record levels in 2016 [11].
Most of the existing studies highlighting on the climatic effects on the energy demand and consumption. The effect of climate change and other inducing features on the future energy demand has been studied. The study considers retrofitting or population changes in addition to climate change. Climate change amplify electricity requirement over the reference state of no climate change [12].
The extent of future energy demand diverge for space condition will be dependent on future deviations in climatic conditions especially temperature, demographic changes.
The main aim of present study is to analyze the collective effect of the inducing aspects namely temperature, population growth and retrofitting on the heating and cooling energy and electricity demand of households of Delhi.
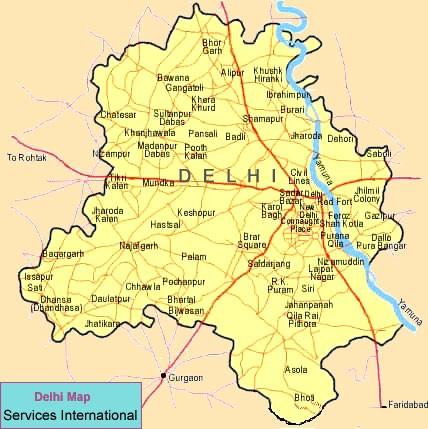
The study area is Delhi, India’s capital territory, is a very big metropolitan region in the north of the country. The study area map is provided in Figure 1.
Figure 1. Study area map
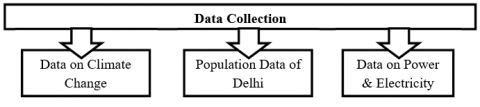
Following flow chart (Figure 2) shows the detailed process of data collection for present study entitled climate change impacts on power and electricity demand of Delhi.
Data has been collected for change in temperature, precipitation, population growth, and energy and electricity demand from respective Ministry and Department, Government of India namely India Meteorological Department, Ministry of Earth Sciences; Ministry of Environment Forest and Climate Change; Office of the Registrar General & Census Commissioner, India Ministry of Home Affairs. Collected data has been interpreted and analyzed as per the following flow chart (Figure 3).
Figure 2. Flowchart representing data collection methodology
Figure 3. Flowchart representing data analysis methodology
Climate change is closely interconnected between electricity production, consumption and climate. The present study is climate change impacts especially temperature, precipitation and population growth on electricity and energy demand of Delhi. Data were collected for last 10 years (temperature and precipitation data from 2010 to 2019), last two census data (2001 and 2011) as shown in Tables 1 & 2 and for data on power & electricity demand of Delhi for Financial Year (FY) 2009-2010 to 2018-2019 as shown in Table 3 were analyzed and were are extended as under.
Table 1. Monthly temperature (℃) details of last 10 years (2010 to 2019) of Delhi
|
Month |
2010 |
2011 |
2012 |
2013 |
2014 |
2015 |
2016 |
2017 |
2018 |
2019 |
||||||||||||||||||||
|
Max tem (oC) |
Avg tem (oC) |
Min tem (oC) |
Max tem (oC) |
Avg tem (oC) |
Min tem (oC) |
Max tem (oC) |
Avg tem (oC) |
Min tem (oC) |
Max tem (oC) |
Avg tem (oC) |
Min tem (oC) |
Max tem (oC) |
Avg tem (oC) |
Min tem (oC) |
Max tem (oC) |
Avg tem (oC) |
Min tem (oC) |
Max tem (oC) |
Avg tem (oC) |
Min tem (oC) |
Max tem (oC) |
Avg tem (oC) |
Min tem (oC) |
Max tem (oC) |
Avg tem (oC) |
Min tem (oC) |
Max tem (oC) |
Avg tem (oC) |
Min tem (oC) |
|
|
Jan |
21 |
12 |
7 |
19 |
11 |
6 |
19 |
11 |
6 |
20 |
12 |
7 |
20 |
13 |
8 |
20 |
13 |
8 |
22 |
15 |
10 |
21 |
14 |
10 |
22 |
16 |
11 |
22 |
18 |
14 |
|
Feb |
25 |
17 |
11 |
24 |
16 |
10 |
22 |
14 |
8 |
22 |
16 |
11 |
22 |
15 |
9 |
26 |
18 |
12 |
26 |
18 |
12 |
26 |
18 |
12 |
26 |
20 |
15 |
24 |
20 |
15 |
|
Mar |
35 |
25 |
17 |
32 |
22 |
14 |
29 |
21 |
13 |
31 |
22 |
16 |
29 |
21 |
15 |
29 |
22 |
16 |
32 |
25 |
18 |
32 |
24 |
16 |
33 |
26 |
20 |
31 |
26 |
21 |
|
Apr |
42 |
33 |
24 |
37 |
28 |
20 |
36 |
29 |
22 |
37 |
30 |
23 |
36 |
29 |
22 |
36 |
30 |
24 |
38 |
32 |
25 |
40 |
32 |
25 |
38 |
32 |
26 |
41 |
37 |
32 |
|
May |
44 |
36 |
28 |
42 |
35 |
28 |
41 |
35 |
28 |
43 |
36 |
29 |
40 |
35 |
28 |
42 |
37 |
30 |
41 |
36 |
30 |
42 |
36 |
30 |
42 |
37 |
32 |
43 |
40 |
35 |
|
Jun |
43 |
36 |
30 |
40 |
35 |
29 |
44 |
38 |
32 |
41 |
36 |
31 |
43 |
38 |
33 |
40 |
36 |
31 |
41 |
37 |
32 |
41 |
36 |
31 |
42 |
37 |
33 |
46 |
42 |
37 |
|
Jul |
36 |
32 |
28 |
34 |
30 |
27 |
38 |
34 |
30 |
38 |
33 |
29 |
39 |
34 |
30 |
36 |
32 |
29 |
36 |
32 |
29 |
37 |
33 |
30 |
37 |
33 |
30 |
40 |
36 |
32 |
|
Aug |
33 |
29 |
26 |
32 |
29 |
26 |
35 |
30 |
27 |
35 |
31 |
27 |
38 |
33 |
28 |
36 |
32 |
28 |
35 |
31 |
27 |
36 |
33 |
30 |
36 |
32 |
29 |
37 |
35 |
31 |
|
Sep |
30 |
26 |
24 |
32 |
28 |
24 |
35 |
29 |
25 |
37 |
31 |
26 |
36 |
30 |
25 |
36 |
31 |
26 |
36 |
31 |
26 |
36 |
31 |
28 |
34 |
30 |
27 |
35 |
32 |
29 |
|
Oct |
32 |
25 |
21 |
32 |
26 |
20 |
33 |
26 |
20 |
33 |
27 |
22 |
34 |
27 |
21 |
34 |
29 |
24 |
35 |
28 |
23 |
35 |
30 |
26 |
37 |
33 |
30 |
36 |
33 |
28 |
|
Nov |
28 |
21 |
16 |
28 |
22 |
16 |
28 |
21 |
16 |
27 |
20 |
15 |
28 |
21 |
16 |
29 |
24 |
19 |
30 |
22 |
17 |
28 |
24 |
20 |
32 |
28 |
24 |
30 |
27 |
24 |
|
Dec |
22 |
14 |
9 |
23 |
15 |
10 |
23 |
16 |
11 |
23 |
16 |
11 |
22 |
15 |
10 |
23 |
17 |
13 |
25 |
17 |
13 |
24 |
19 |
15 |
26 |
22 |
18 |
24 |
21 |
17 |
Table 2. Monthly details of precipitation (in mm) of 10 years (2010 to 2019) of Delhi
|
Month |
Precipitation (in mm) |
|||||||||
|
2010 |
2011 |
2012 |
2013 |
2014 |
2015 |
2016 |
2017 |
2018 |
2019 |
|
|
Jan |
5.77 |
1.24 |
0.70 |
7.43 |
8.81 |
1.08 |
0.16 |
11.05 |
1.97 |
42.3 |
|
Feb |
2.64 |
19.37 |
0.28 |
18.17 |
8.4 |
7.79 |
1.81 |
0.31 |
3.71 |
85.3 |
|
Mar |
2.07 |
0.89 |
1.13 |
1.99 |
10.48 |
29.56 |
6.98 |
6.23 |
4.08 |
15.4 |
|
Apr |
0.67 |
10.57 |
11.19 |
3.31 |
2.67 |
19.72 |
1.22 |
3.15 |
4.18 |
112.3 |
|
May |
0.35 |
20.59 |
2.19 |
0.25 |
5.95 |
0.92 |
9.36 |
2.98 |
2.66 |
10.6 |
|
Jun |
0.20 |
54.68 |
4.75 |
21.49 |
10.06 |
49.07 |
21.13 |
12.16 |
28.79 |
8.3 |
|
Jul |
84.63 |
130.35 |
46.73 |
27.01 |
12.21 |
121.85 |
58.48 |
26.29 |
100.3 |
271 |
|
Aug |
121.27 |
214.43 |
42.63 |
20.59 |
7.68 |
31.38 |
46.95 |
43.94 |
53.15 |
99.9 |
|
Sep |
180.01 |
100.21 |
41.44 |
9.31 |
19.41 |
23.14 |
1.46 |
37.32 |
74.22 |
54.1 |
|
Oct |
3.6 |
0.02 |
0.19 |
1.9 |
0.15 |
0.32 |
0.01 |
0 |
1 |
3.5 |
|
Nov |
4.88 |
0 |
0.03 |
0.21 |
0 |
0.30 |
0 |
0 |
0.20 |
30.2 |
|
Dec |
5.28 |
0.12 |
1.22 |
2.54 |
1.9 |
0 |
0 |
0.68 |
12.8 |
35.5 |
|
Financial Year (FY) |
Requirement |
Growth of Power Requirement |
Availability |
Surplus (+) / Deficit (-) |
Peak Demand |
Peak Met |
Surplus (+)/ Deficit (-) |
||
|
(MU) |
(%) |
(MU) |
(MU) |
(%) |
(MW) |
(MW) |
(MW) |
(%) |
|
|
FY 2009-2010 |
24,277 |
10.33 |
24,094 |
-183 |
-0.8 |
4,502 |
4,408 |
-94 |
-2.1 |
|
FY 2010-2011 |
25,625 |
5.26 |
25,559 |
-66 |
-0.3 |
4,810 |
4,739 |
-71 |
-1.5 |
|
FY 2011-2012 |
25,004 |
-2.48 |
24,929 |
-75 |
-0.3 |
5,031 |
5,028 |
-3 |
-0.1 |
|
FY 2012-2013 |
26,088 |
4.16 |
25,950 |
-138 |
-0.5 |
5,942 |
5,642 |
-300 |
-5.0 |
|
FY 2013-2014 |
27927 |
6.59 |
50942 |
23015 |
82.4 |
5714 |
5653 |
(-)61 |
(-)1 |
|
FY 2014-2015 |
29,231 |
4.46 |
29,106 |
-125 |
-0.4 |
6,006 |
5,925 |
-81 |
-1.3 |
|
FY 2015-2016 |
29,935 |
2.35 |
44953.91 |
15018.91 |
33.41 |
6,273 |
6017.45 |
-255.55 |
-4.25 |
|
FY 2016-2017 |
31,203 |
4.06 |
45135.12 |
13932.12 |
30.87 |
6,537 |
6050.70 |
-486.30 |
-8.04 |
|
FY 2017-2018 |
31,826 |
1.96 |
31,806 |
19 |
0.1 |
6,553 |
6,526 |
27 |
0.4 |
|
FY 2018-2019 |
32,299 |
1.46 |
32,282 |
17 |
0.1 |
7,016 |
7,016 |
0 |
0 |
During time period 2010 to 2019, the monthly mean temperature of Delhi has a significant seasonal cycle (Figure 5), with the highest in June 2019 (46°C), and the lowest in January 2011 and 2012 (6°C) Variation of monthly mean temperature in Delhi from 2010 to 2019 is shown in the Figure 4.
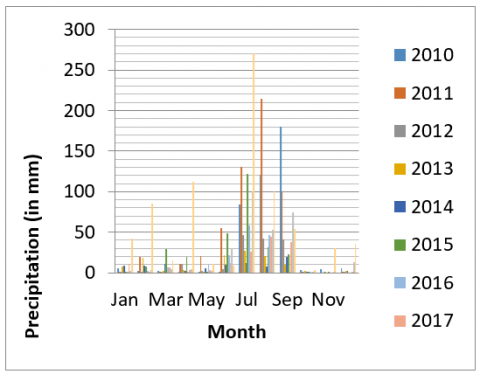
Highest Precipitation has been observed in July in 2019 (271 mm) during time period 2010 to 2019. Variations of monthly mean Precipitation in Delhi from 2010 to 2019 is shown in the Figure 5.
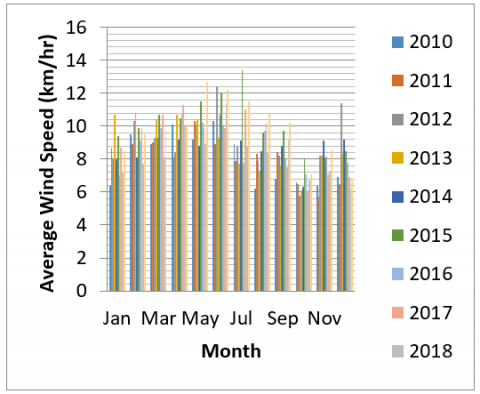
During time period 2010 to 2019, highest average wind speed of 12.7 km/hr has been observed in May 2019 and the lowest average wind speed was 5.7 km/hr in the month of November 2010 as shown in Figure 6.
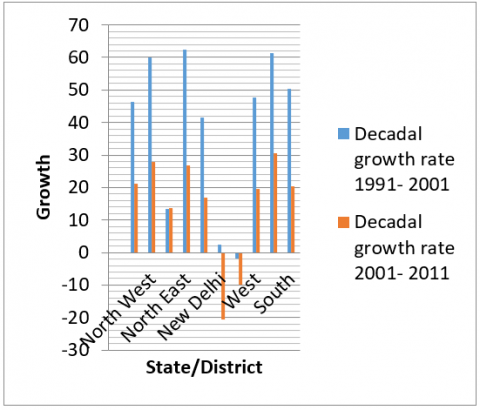
The population of NCT of Delhi as per 2001 census is 13,782,976, of which 7,570,890 males and 6,212,086 females. The population of NCT of Delhi as per 2011 census is 1, 67, 87,941, of which 89, 87,326 males and 78, 00,615 females. Comparison of population of 2001 and 2011 along with population growth is given in Figure 7 and Figure 8.
It has been observed that, the electricity consumption goes up dramatically when the temperature increases in summer and decreases in winter months. Variation of electricity consumption in Delhi from FY 2009-2010 to FY 2018-2019 is given in Figure 9.
Figure 5. Variations of monthly mean precipitation in Delhi from 2010 to 2019
Figure 6. Variation of monthly means average wind speed in Delhi from 2010 to 2019
Figure 7. Comparison of population of 2001 and 2011 of Delhi
Figure 8. Decadal growth of population of 2001 and 2011 of Delhi
Figure 9. Variation of electricity consumption in Delhi from FY 2009-2010 to FY 2018-2019
A number of previous studies quantify impacts of climate change on energy systems at national, regional and global level [13]. Climate change defines to any major change in measures of climate especially temperature, and precipitation which is lasting for an extended period. The study focuses on impacts of climate change on electricity and energy demand of Delhi.
Results of the present study are discussed in following sections:
From the interpretation and analysis of above data it can be noted that, the demand of power and electricity has a regular increase from FY 2009- 2010 to FY 2018-2019 with respect to climate change scenario during time period 2010 to 2019, which is closely interlinked with the decadal population growth.
In summer, there is a peak in electricity use due to high cooling demand coincides with the maximum temperature and a relatively lower peak in electricity use is found in winter mainly because of the in-heating demand coincides with the minimum temperature (Figures are not shown).
This cycle repeats every year. The monthly peak electricity consumption in summer is much higher than that in winter. Based on the findings, has been observed that, the electricity consumption goes up dramatically when the temperature raises in summer and decreases in winter months.
The analysis of the present study indicates that, the nature and extent of the impacts are depending on the climate and development status.
The energy sector is affected by climate change especially temperature, precipitation and population growth which is a key sector for climate protection measures. The decision makers and energy suppliers should be known with the aspects that raise or reduce the socioeconomic and structural characteristics of the electricity sector affect the demand for and supply of electricity under climate change.
As energy security is the vertebrae of our contemporary society and assures the functioning of most critical infrastructure. The following has been recommended:
The estimates of climate change impacts and changes in electricity demand in present study provided idea to propose three areas for future research.
First, the results of the study depend on existing data. Collection of stronger level data would improve future study of electricity demands.
Second, future research could explore a broader range of possible future electricity demand and climate change scenarios to capture various uncertainties.
Finally, modeling options would tend to be used to find out the effects of climate change on electricity demand.
The further studies are also needed on the technical and cost impacts of altered variability of renewable resources [14].
Present study uses data of Government of India to estimate the effect of daily temperature (a key indicator of weather), precipitation, population data and long-term climate on electricity demand. From FY 2009- 2010 to FY 2018-2019, the electricity requirement experienced a regular increase every year.
Heating and cooling requirements for adjustment leads to the rapid increase in electricity demand in the climate change scenario especially with respect to change in temperature, precipitation and population growth.
In summer, there is a peak in electricity use due to high demand coincides with the maximum temperature and a relatively lower peak in electricity use is found in winter mainly because of the in-heating demand coincides with the minimum temperature (Figures are not shown).
This cycle repeats every year. The monthly peak in electricity consumption in summer is much higher than that in winter. The increase in electricity use might be caused by the growing population growth/economic development.
Based on the findings, it has been observed that, the electricity consumption goes up dramatically when the temperature increases in summer and decreases in winter months. As the electricity demand increases every year with increase in population growth, it is suggested that critical need to engage in electricity demand management and improve efficiency in use of electricity to become a low-energy consuming society in the future.
The author acknowledges the support of professors and the Department of Civil Engineering of Lingaya’s Vidyapeeth, Faridabad, Haryana, India for their support to complete the research work on time.
|
FY |
Financial Year |
|
GHG |
Green House Gas |
|
CO2 ℃ |
Carbon Dioxide Degree Celsius |
|
mm NCT |
Milli Meter National Capital Territory |
[1] B.P. (2015). BP Statistical Review of World Energy. 64th Edition, June 2015. Website: https://naftogaz-europe.com/newsfiles/bp-statistical-review-of-world-energy-2015-full-report.pdf, accessed on May 1, 2020.
[2] Boussalis, C., Coan, T.G. (2016). Text-mining the signals of climate change doubt. Global Environmental Change, 36: 89-100. https://doi.org/10.1016/j.gloenvcha.2015.12.001
[3] Blanco, G., Gerlagh, R., Suh, S. (2014). Drivers, Trends and Mitigation. In: Climate Change 2014: Mitigation of Climate Change. Contribution of Working Group III to the Fifth Assessment Report of the Intergovernmental Panel on Climate Change [Edenhofer, O. and Pichs-Madruga, R. and Sokona, Y. and Farahani, E. and Kadner, S. and Seyboth, K. and Adler, A. and Baum, I. and Brunner, S. and Eickemeier, P. and Kriemann, B. and Savolainen, J. and Schlomer, S. and von Stechow, C. and Zwickel T. and Minx, J.C. (eds.)]. Cambridge University Press, Cambridge, UK and NY, USA. Website: https://www.ipcc.ch/site/assets/uploads/2018/02/ipcc_wg3_ar5_chapter5.pdf, accessed on May 1, 2020.
[4] Report of the Secretary-General on the 2019 Climate Action Summit and the Way Forward in 2020. UN. https://www.un.org/en/climatechange/assets/pdf/cas_report_11_dec.pdf, accessed on May 1, 2020.
[5] Totschnig, G., Hirner, R., Müller, A., Kranzl, L., Hummel, M., Nachtnebel, H.P., Stanzel, P., Schicker, I., Formayer, H. (2017). Climate change impact and resilience in the electricity sector: The example of Austria and Germany. Energy Policy, 103: 238-248. https://doi.org/10.1016/j.enpol.2017.01.019
[6] Nejat, P., Jomehzadeh, F., Taheri, M.M., Gohari, M., Abd. Majid, M.Z. (2015). A global review of energy consumption, CO2 emissions and policy in the residential sector (with an overview of the top ten CO2 emitting countries). Renewable and Sustainable Energy Reviews, Elsevier, 43: 843-862. https://doi.org/10.1016/j.rser.2014.11.066
[7] Van Vliet, M.T.H., Yearsley, J.R., Ludwig, F., Vogele, S., Lettenmaier, D.P., Kabat, P. (2012). Vulnerability of US and European electricity supply to climate change. Nature Climate Change, 2: 676-681. https://doi.org/10.1038/nclimate1546
[8] The Guardian. (2015). G7 Leaders agree to phase out Fossil Fuel Use by the End of Century. Retrieved from http://www.theguardian.com/world/2015/jun/08/g7-leaders-agree-phase-out-fossil-fuel-use-end-of-century, accessed on May 1, 2020.
[9] International Energy Association. (2018). The Future of Cooling: Opportunities for Energy-Efficient Air-Conditioning (International Energy Association, Paris).
[10] Gecker, J., Chuwiruch, N. (2016). Thailand is used to hot Aprils, but not this hot! Bangkok AP news, Accessed 11 August 2017. Available online at https://apnews.com/42c7c080f86644168102ceeea105ddd0/thailand-used-hot-aprils-not-hot
[11] NASA, 2016: Heat wave hits Thailand, India: Natural Hazards. Available online at http://earthobservatory.nasa.gov/NaturalHazards/view.php?id=87981.
[12] Gupta, E. (2016). The effect of development on the climate sensitivity of electricity demand in India. Climate Change Economics, 7(2): 1650003. https://doi.org/10.1142/S2010007816500032
[13] Carvajal, P.E., Anandarajah, G., Mulugetta, Y., Dessens, O. (2017). Assessing uncertainty of climate change impacts on long-term hydropower generation using the CMIP5 ensemble—the case of Ecuador. Climatic Change, 144: 611-624. https://doi.org/10.1007/s10584-017-2055-4
[14] Cronin, J., Anandarajah, G., Dessens, O. (2018). Climate change impacts on the energy system: a review of trends and gaps. Climatic Change, 151: 79-93. https://doi.org/10.1007/s10584-018-2265-4