Binghui Zhang | Yanhua Xie* | Hailing Li | Baochen Liu
© 2020 IIETA. This article is published by IIETA and is licensed under the CC BY 4.0 license (http://creativecommons.org/licenses/by/4.0/).
OPEN ACCESS
The characteristics of rock face dissolution reflect to a certain extent the degree of karst development at the construction site and whether the conditions of karst foundation are good or not, so they can be used as a basis for the design of building foundation. However, huge amounts of reliable rock face data obtained in engineering practice have not been fully utilized, and the studies on rock face dissolution characteristics are still immature, which is an important reason why the dissolution characteristics analysis of karst foundation is often inconsistent with the engineering reality and leads to engineering incidents. With the terminal building at Nanning Wuxu International Airport as an engineering background, this paper defines the rock face dissolution rate as the ratio between the rock face dissolution height and the formation dissolution height (in percentage) and uses it as the index to characterize rock face dissolution degree, and then establishes a method to solve the rock face dissolution rate curve and reveals the distribution pattern of rock face dissolution degree with depth in karst building foundations. According to the results of the study, the rock face dissolution rate of karst building foundations in the karst terrain of Southwest China generally declines exponentially with the depth increasing, and when it is expressed as an exponential function of height, the fitting correlation coefficient can generally be up to more than 0.90. When there are no less than 12 drill holes with spacing of no more than 20m in the site, the rock face dissolution rate curve shows good numerical stability, with the error being generally within 15%, which is sufficient engineering precision.
karst, rock face dissolution degree, rock face dissolution rate, karst foundation
Dissolution is the main factor causing the discontinuous relief of rock faces: on the one hand, the intensity of dissolution differs greatly at different positions of the rock face, and there is much uncertainty in such differences, which is the direct cause of continuous relief; on the other hand, some of the shallow-layer caves may also further aggravate the discontinuous relief of rock faces under the action of dissolution from the outside to the inside – for example, the roof of a shallow karst cave may be thinned and damaged or the side wall of the cave at the free face would eventually form a shape that looks like an eagle beak under the action of dissolution. The discontinuous relief of rock faces reflects the complexity of a karst foundation to some extent [1-3], so it is an important criterion for evaluating the engineering conditions of karst foundations [4, 5], analyzing the differential settlements of foundations, and the difficulties in pile forming and should be used as one of the bases for the design of building foundations in karst terrain.
There are two types of dissolution in karst foundations - rock face dissolution and cave dissolution. Karst cave has been widely studied in karst engineering geological research [6-8]. The rate of reaching caves during drilling [9-11], linear karst rate [12, 13] and karst density [14], etc. are the direct evaluation indicators of cave dissolution in karst terrain. The construction survey of building pile foundations and various geophysical methods are all aimed mainly at the detection of karst caves [15-17], and the evaluation of karst cave characteristics [18-22] and stability analysis of karst caves [23-26] are the main subjects of karst foundation research. The characteristics of rock face dissolution can reflect the karst development in foundations to a certain extent [27], but this indicator cannot properly deal with the discontinuous reliefs of rock faces in complex karst foundations, nor can it characterize the dissolution characteristics of rock faces at construction sites from the overall perspective, so whether it is a reasonable indicator is still worth discussing. Rock face exploration in Karst foundations is a basic task of engineering survey. Most engineering geophysical methods and drilling methods can help obtain survey data like rock face burial depth [28-32]. These rock face data are much richer and more reliable than cave data, but they have not been fully and effectively utilized. In summary, there have been a lot of research results on karst caves, but the evaluation theories on and methods for rock face dissolution characteristics still need more research and discussion.
With the terminal building at Nanning Wuxu International Airport as an engineering background, and based on the existing research results, this paper proposes an indicator - rock face dissolution rate – to depict the rock face dissolution degree, develops a method for solving the distribution curve of rock face dissolution rate with depth and at last reveals the distribution pattern of rock face dissolution degree with depth in karst building foundations based on the measured results of rock face dissolution rate at 148 construction sites in the karst terrain of Southwest China.
2.1 Engineering profile
Guangxi Nanning Wuxu International Airport is located south of the former Wuxu Airport in the southwestern suburb of Nanning. It is a regional air link designated in the layout plan of national civil airports. The airport terminal building is located in Yonghong Village, Wuxu Town, Jiangnan District, Nanning City, with a length of about 1080m, a width of 23-330m, an area of about 300mu, a ground elevation of about 123.5m and a total floor area of 183,800m2. The terminal building can be divided into the main building and airside concourses, specifically consisting of five functional zones, namely the central hall (zone I), the southern horizontal airside concourse (zone II), the northern horizontal airside concourse (zone III), the southern vertical airside concourse (zone IV) and the northern vertical airside concourse (zone V). In this paper, this building is further divided into 14 sub-zones according to the plane shape of each functional zone and the number of boreholes surveyed, as shown in Figure 1.
Figure 1. Zoning map of the terminal building
2.2 Regional geological conditions
There is no fault development within 10km in the east and south of the site. There are several faults of unknown nature in the Tertiary and Devonian strata in the hilly area on the northwest side. The nearest one is about 5km away from the site, running in the NE40º direction, with no active fault structure zone passing through. The regional geological structure is relatively stable.
The site is of dissolution peneplain landform, with hills in the east, north and west, and farmland, ponds and woodland in the south. Human activities are frequent, and vegetation coverage is high. There are no obvious karst development morphologies such as karst collapses, funnels and depressions. The terrain is flat with a gentle slope from north to south, whose natural grade is less than 5º.
The overlying soil layer is more than 10m thick, mainly composed of silty clay, clay mixed with breccia and red clay in the Quaternary residual layer (Qel) and limestone in the lower Carboniferous system (C1). The occurrence of the limestone formation is $150^{\circ} \angle 15^{\circ}$.
There is an underground river about 1500m away on the south side. The groundwater flows from west to east, with artificial exploitation, evaporation and underground runoff as its main discharge channels. It is an important source of karst fissure water. The bottom height of a motor-pumped well within 5km from the site is about 85-120m, and the water yield per well is 100-1000t/d. The karst fissure water in the site is abundant, and the rock layer revealed in the survey is mainly located in the vertical vadose zone - shallow horizontal circulation zone.
2.3 Geological conditions of the construction site
The detailed site survey boreholes are evenly arranged along the perimeter lines, corner points and column lines of the building and the central axis of the pedestrian overpass. A total of 362 boreholes were drilled, with spacing being generally between 15-25m and about 20m on average. The borehole is generally 5-8m deep into the intact rock, with a total footage of 4875.4m into the rock formation. 217 caves were exposed in the drilling of 158 boreholes, with a total footage of 371.42m into the caves. The rate of reaching caves during drilling is 0-88.57%, and the linear karst rate is 0-18.85%.
The foundation of the building adopts punch filling piles, with a pile diameter of 0.8-2.0m. Based on the scheme of one pile with one borehole, a total of 1851 boreholes were drilled, with spacing being generally no more than 8m, and about 5m on average. The borehole is all 5-8m deep into the intact rock, with a total footage of 24706m into the rock. 1556 caves were exposed in the drilling of 940 boreholes, with a total footage of 2666.9m into the caves. The rate of reaching caves during drilling is 29.28% -80.56% and the linear karst rate is 2.95-20.99%.
The survey shows that the karst rocks exhibit very different development characteristics - the groundwater conditions are complex, the karst morphologies like funnels, dolines, caves and fissures are well developed, and the rock faces have drastic discontinuous reliefs, indicating it is a strongly developed karst area. The basic information of the detailed survey and construction investigation on each sub-zone is shown in Table 1.
Table 1. Sub-zone survey summary table
|
Sub- area |
Detailed investigation |
Investigation in the construction stage |
||||||||||
|
Boreholes |
Karst caves number |
Drilling depth |
Drilling depth at the intact rock |
Karst curve rate |
Line karst curve rate |
Boreholes |
Karst caves number |
Drilling depth |
Drilling depth at the intact rock |
Karst curve rate |
Line karst curve rate |
|
|
pcs |
pcs |
m |
m |
% |
% |
pcs |
pcs |
m |
m |
% |
% |
|
|
I-1 |
32 |
10 |
35.39 |
436.73 |
31.25 |
8.10 |
193 |
91 |
324.15 |
2153.61 |
47.15 |
15.05 |
|
I-2 |
46 |
21 |
59.10 |
562.40 |
45.65 |
10.51 |
236 |
85 |
198.70 |
2348.83 |
36.02 |
8.46 |
|
I-3 |
46 |
6 |
10.30 |
604.61 |
13.04 |
1.70 |
267 |
94 |
231.25 |
3483.66 |
35.21 |
6.64 |
|
I-4 |
32 |
11 |
31.30 |
408.50 |
34.38 |
7.66 |
181 |
53 |
193.30 |
2672.30 |
29.28 |
7.23 |
|
Ⅱ-1 |
22 |
5 |
8.40 |
257.00 |
22.73 |
3.27 |
99 |
75 |
230.19 |
1628.91 |
75.76 |
14.13 |
|
Ⅱ-2 |
22 |
0 |
0.00 |
356.50 |
0.00 |
0.00 |
72 |
58 |
53.70 |
1093.86 |
80.56 |
4.91 |
|
Ⅱ-3 |
16 |
4 |
6.76 |
221.04 |
25.00 |
3.06 |
61 |
38 |
56.55 |
831.18 |
62.30 |
6.80 |
|
Ⅲ-1 |
16 |
6 |
3.50 |
191.00 |
37.50 |
1.83 |
61 |
35 |
30.30 |
961.12 |
57.38 |
3.15 |
|
Ⅲ-2 |
17 |
4 |
10.60 |
222.80 |
23.53 |
4.76 |
76 |
34 |
33.10 |
1121.18 |
44.74 |
2.95 |
|
Ⅲ-3 |
24 |
14 |
29.50 |
292.97 |
58.33 |
10.07 |
99 |
59 |
138.40 |
1476.46 |
59.60 |
9.37 |
|
Ⅳ-1 |
19 |
6 |
17.60 |
234.12 |
31.58 |
7.52 |
131 |
62 |
241.40 |
1542.74 |
47.33 |
15.65 |
|
Ⅳ-2 |
16 |
7 |
16.30 |
221.10 |
43.75 |
7.37 |
121 |
70 |
209.00 |
1395.81 |
57.85 |
14.97 |
|
Ⅴ-1 |
35 |
31 |
121.47 |
644.45 |
88.57 |
18.85 |
138 |
107 |
414.07 |
2506.33 |
77.54 |
16.52 |
|
Ⅴ-2 |
19 |
33 |
21.20 |
222.20 |
57.58 |
9.54 |
116 |
79 |
312.76 |
1490.34 |
68.10 |
20.99 |
3.1 Distribution curve of the measured rock face dissolution rate with depth
In this paper, the rock face dissolution rate is defined as the ratio between the rock face dissolution height within a certain depth range and the formation thickness, expressed in percentage as follows:
$r_{s}=\frac{s}{L} \times 100 \%$ (1)
where, rs is the rock face dissolution rate at a certain point within a certain depth range; s is the rock face dissolution height within a certain depth range; and L is the formation thickness within a certain depth range.
The distribution curve of rock face dissolution rate with depth in each sub-zone of the site can be obtained using the following methods and steps:
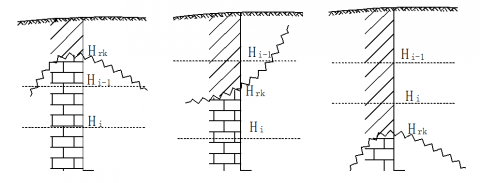
(1) Suppose there are n boreholes in the site, and that the rock face elevation of the k-th borehole is Hrk. According to the positional relationship between the elevation Hrk and the interval (Hi-1, Hi-] (Figure 2), the rock face dissolution height sik of the k-th borehole within the elevation interval (Hi-1, Hi-] is:
$\left\{\begin{array}{l}s_{i k}=0 \quad\left(H_{r k} \geq H_{i-1}\right) \\ s_{i k}=H_{i-1}-H_{r k}\left(H_{i-1}>H_{r k} \geq H_{i}\right) \\ s_{i k}=H_{i-1}-H_{i} \quad\left(H_{r k}<H_{i}\right)\end{array}\right.$ (2)
(a) Hrk>Hi-1 (b) Hi-1≥Hrk≥Hi(c)Hrk<Hi-
Figure 2. Positional relationship between rock face and statistical interval
To facilitate the processing of computer programs, formula (1) is written as
$s_{i k}=\max \left(H_{i-1}, H_{r k}\right)-\max \left(H_{i}, H_{r k}\right)$ (3)
The total rock face dissolution height si within the height interval (Hi-1, Hi-] in the site is obtained as follows.
$S_{i}=\sum_{k=1}^{n} S_{i k}$ (4)
The formation thickness L within the height interval (Hi-1, Hi-] is
$\mathrm{L}=n \cdot \Delta H$ (5)
Substitute formulas (4) and (5) into formula (1), and we obtain the rock face dissolution rate rsi within the height interval (Hi-1, Hi-] in the site:
$r_{s i}=\frac{\sum_{k=1}^{n} s_{i k}}{n \cdot \Delta H} \times 100 \%$ (6)
Substitute formula (3) into formula (6), and we obtain the final calculation formula of rock face dissolution rate rsi:
$r_{s i}=\frac{\sum_{k=1}^{n}\left[\max \left(H_{i-1}, H_{r k}\right)-\max \left(H_{i}, H_{r k}\right)\right]}{(n \cdot \Delta H)}\times 100 \%$ (7)
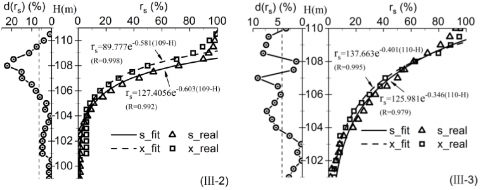
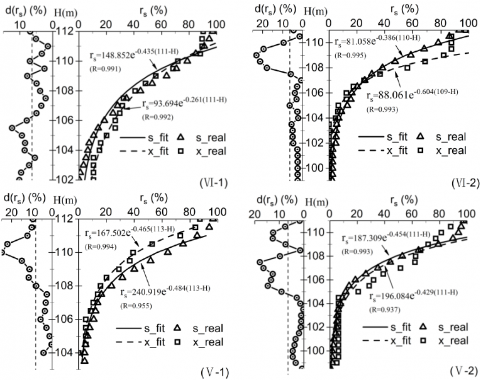
In this paper, △H is set to be 0.5m to determine the statistical height interval of rock face dissolution rate. According to the above methods and steps, the scatter plot of the measured rock face dissolution rate distribution curve in each sub-zone of the site can be obtained, as shown in Figure 3 (in the figure, x_real and s_real represent the scatter plots of the measured rock face dissolution rate curve in the detailed survey stage and the construction survey stage, respectively).
3.2 Fitting of the distribution curve of rock face dissolution rate with depth
Cao et al. [33] shows that the dissolution degree of a building foundation in the karst terrain declines exponentially with the depth increasing. The dissolution degree can be characterized by the dissolution rate, which can be approximated as an exponential function in the form of formula (8):
$r=a e^{b\left(H-H_{0}\right)}$ (8)
where, r is the dissolution rate at height H, a and b are the fitting coefficients, H is the height and H0 is the height from the rock face.
The dissolution rate in formula (8) is defined as the ratio (in percentage) between the dissolution height within a certain depth range and the formation thickness. The dissolution height consists of two parts - rock face dissolution height and cave dissolution height. Obviously, when the site has no developed cave, the foundation dissolution rate curve is the rock face dissolution rate curve. Therefore, this paper temporarily assumes that the depth distribution function of rock face dissolution rate is consistent with formula (8).
The least square method is used in this paper to fit the measured rock face dissolution rate distribution curve with depth in each sub-zone of the site according to formula (8). The obvious outlier data at the top and bottom are eliminated during the fitting. The final fitting result is shown in Figure 3 (in the figure x_fit and s_fit are the fitted rock face dissolution rate curve in the detailed survey stage and the construction survey stage, respectively), and the fitting parameters are shown in Table 2 below (unit: m).
Table 2. Range table of fitting data for rock face dissolution rate curves
|
Sub-area |
Detailed survey stage |
Construction survey stage |
||
|
Top elevation |
Bottom elevation |
Top elevation |
Bottom elevation |
|
|
m |
m |
m |
m |
|
|
I-1 |
110 |
101 |
110 |
104 |
|
I-2 |
112 |
104 |
110 |
104 |
|
I-3 |
109 |
101 |
110 |
104 |
|
I-4 |
110 |
105 |
110 |
105 |
|
Ⅱ-1 |
109 |
96.5 |
108 |
95 |
|
Ⅱ-2 |
115 |
104.5 |
115 |
100 |
|
Ⅱ-3 |
112 |
100.5 |
112 |
104 |
|
Ⅲ-1 |
110 |
104 |
110 |
94 |
|
Ⅲ-2 |
109 |
105 |
109 |
103 |
|
Ⅲ-3 |
109.5 |
103 |
109.5 |
103 |
|
Ⅳ-1 |
111 |
104 |
110 |
104 |
|
Ⅳ-2 |
109 |
104 |
110 |
102 |
|
Ⅴ-1 |
112 |
106 |
112.5 |
101 |
|
Ⅴ-2 |
110 |
103 |
110 |
104 |
3.3 Error curve of rock face dissolution rate
The borehole density during the construction survey stage is generally much greater than that during the detailed survey, and the rock face dissolution rate curve formed based thereon is generally more in line with the actual situation, so it can be deemed that the rock face dissolution rate curve during the construction survey stage reflects the actual rock face dissolution characteristics of the site and can be used as the reference for error analysis of rock face dissolution rate in the detailed survey stage. Accordingly, the error d(rsi) of the rock face dissolution rate within the height interval (Hi-1, Hi-] in the detailed survey stage is calculated as follows:
$d({{r}_{s}})=\left| r{}_{si,x}-{{r}_{si,s}} \right|$ (9)
where, rsi,x and rsi,s are the rock face dissolution rates within the height interval (Hi-1,Hi-] during detailed survey and construction survey, respectively.
According to formula (9), the rock face dissolution rate error curve for each sub-zone of the site is shown on the left side of the Y-axis in Figure 3. Despite the simple data processing flow, the amount of data to be processed is huge, so a special data processing program needs to be compiled. The curves in Figure 3 are drawn based on the processing results of the self-compiled data processing program.
Figure 3. Distribution curve of rock face dissolution rate with depth for each sub-zone of the site
According to Figure 3, when the rock face dissolution rate curve during the construction survey stage of the site is fitted according to formula (8), the fitting correlation coefficient R value is 0.933-0.997 and as high as 0.9812 on average, and the fitted curve is in good agreement with the measured curve, indicating that the rock face dissolution rate of the site declines exponentially with the depth increasing (height decreasing). In this study, in addition to the site selected in this paper, the author also collected practical data from 118 karst construction sites in Nanning, Guilin, Liuzhou, Laibin, Hechi, Hezhou and Yulin of Guangxi Province as well as nearly 30 copies of relevant engineering materials from Kunming of Yunnan, Long Gang of Shenzhen, Xiushan County of Chongqing, Guiyang, Zhijin County and Xiuwen County of Guizhou. The strata in the above sites contain various carbonate rocks like limestone, dolomite and marble. The lithological conditions, hydrological conditions and foundation dissolution characteristics of karst development are all quite different, but the function type of the rock face dissolution rate curves is consistent with that for the site studied in this paper, indicating that the rock face dissolution degree of building foundations in carbonate rock areas in Southwest China generally declines exponentially with the depth increasing.
The change pattern of the rock face dissolution rate with depth is consistent with that of the total dissolution rate of the foundation – which is declining exponentially with the depth increasing. In practice, however, the development of caves often shows a weak-strong-weak trend with the depth increasing, indicating that rock faces are often the parts that suffer most from dissolution. Rock face dissolution is the main part of foundation dissolution and the main aspect of karst foundation dissolution. The reasons are as follows: the dissolution effect weakens gradually from the outside to the inside, so in a karst foundation, rock faces are the first parts that dissolve, and what is more, the dissolved area of rock faces is also much larger than that of the fissures or caves beneath them. One thing to note is that although rock face dissolution is the main part of the total foundation dissolution, the spatial distribution of karst caves is highly unstable, seriously threatening the safety of building foundations. Therefore, the study on the stability of karst caves in karst foundations is still very important.
It can be seen from Figure 3 that the deviations (errors) d(rs) from the measured rock face dissolution rate are as follows: zone I-1 has a deviation of 0.1-7.22% and an average deviation of 2.86%; zone I-2 has a deviation of 0.17-18.95% and an average deviation of 9.37%, and the deviation at the height of 109-110.5m is over 15%; zone I-3 has a deviation of 0.1-7.16% and an average deviation of 2.59%; zone I-4 has a deviation of 0.09-11.51% and an average deviation of 2.84%; zone II-1 has a deviation of 0.18-15.82% and an average deviation of 7.29%; zone II-2 has a deviation of 0.01-15.82% and an average deviation of 4.14%; zone II-2 has a deviation of 0.01-15.82% and an average deviation of 4.14%, and the deviation at the height of 110.5m is over 15%; zone II-3 has a deviation of 0.31-15.65% and an average deviation of 5.42%, and the deviation at the height of 110m is over 15%; zone III-1 has a deviation of 0.03-17.47% and an average deviation of 3.76%, and the deviation at the height of 108m is over 15%; zone III-2 has a deviation of 0.02-22.28% and an average deviation of 6.12%, and the deviation at the height of 107.5-108.5m is over 15%; zone III-3 has a deviation of 0.12-9.04% and an average deviation of 4.11%; zone VI-1 has a deviation of 1.46-12.36% and an average deviation of 6.29%, and the deviation at the height of 108m is over 15%; zone VI-2 has a deviation of 0.64-23.13% and an average deviation of 6.29%, and the deviation at the height of 108-109.5m is over 15%; zone V-1 has a deviation of 0.22-24.92% and an average deviation of 8.21%, and the deviation at the height of 110.5-111m is over 15%; zone V-2 has a deviation of 0.22-17.94% and an average deviation of 6.43%, and the deviation at the height of 107-107.5m is over 15%. Therefore, although the density of boreholes in the detailed survey drilling is much smaller than that in the construction survey stage and the dissolution degree of site is high, the deviation from the measured rock face dissolution rate is generally within 15%, with an average of no more than 10%. There are only a few data points with a deviation of more than 15% - usually 1-4 data points, and they are mainly distributed in the shallow depth range above 107m.
When the rock face dissolution rate curve in the detailed survey stage is fitted according to formula (8), the fitting correlation coefficient R is 0.937-0.998 and as high as 0.979 on average, and the fitted curve is also be in good agreement with the measured curve. The fitted rock face dissolution rate curves in the detailed survey and the construction survey stages have basically the same shape. Specifically, the two fitted curves in zone III-1 almost overlap; those in zone I-1, I-3, I-4, II-1, II-2, III-3 an V-2 are basically the same, with a maximum deviation of no more than 5% at the same height; in zone I-2 and VI-2, the maximum deviation occurs above the height of 108m, but if this section of curve will basically overlap with that in the construction survey stage if it is shifted down by about 1.0m along the height; the deviation in zone II-3 mainly occurs above the height of 104m, and that in zone III-2 mainly occurs above 106.5m and that in zone V-1 mainly occurs above 108m, and the main deviated sections of the curves in these three sub-zones will basically coincide with those in the construction survey stage if they are moved down along the height by about 0.5m; and the maximum deviation in zone VI-1 occurs below the height of 108m, but its deviation from that in the construction survey stage is still within 10%. Therefore, there is not much deviation between the rock face dissolution rate curves in the detailed survey and the construction survey stages, and the two curves have basically the same shape and changing trend. Considering the deviations of the rock face dissolution rate in the two stages together, it can be seen that the distribution curves of rock face dissolution rate with depth during the two stages in the site are basically the same, indicating that the rock face dissolution rate has good numeral stability, and thus the distribution curve of rock face dissolution rate with depth can be used a reasonable basis for evaluating and analyzing the distribution pattern of rock face dissolution degree with depth.
The rock face dissolution rate curve is a statistical curve. Whether it can reasonably reflect the rock face dissolution characteristics of the site requires a sufficient sample size, which means the density of boreholes within the statistical range must be controlled to ensure there are sufficient boreholes. How to control the density and number of boreholes depends on the characteristics of foundation dissolution. The greater the relief of the foundation rock face, the greater the density of boreholes and the greater the number of boreholes. In general, the density and number of boreholes in construction survey are sufficient to meet the statistical requirement of the rock face dissolution rate curve. Among the 118 copies of materials collected from Southwest China in this paper, 82 contain detailed survey and construction survey data. The statistical analysis and verification results of the 82 copies of materials show that if the average borehole spacing is no more than 20m, and there is no less than 12 boreholes in a site, the error of the rock face dissolution rate is generally within 15%, so this indicator can properly reflect the rock face dissolution degree of the site.
(1) The rock face dissolution rate of karst building foundations in the karst terrain of Southwest China generally declines exponentially with the depth increasing, and when it is expressed as an exponential function of height, the fitting correlation coefficient can generally be up to more than 0.90.
(2) Cave dissolution is the most prominent form of karst that threatens the safety of buildings, but rock faces are the parts that suffer most from dissolution, and rock face dissolution is the main component of site dissolution.
(3) The rock face dissolution rate distribution curve with depth has good numerical stability. The rock face dissolution rate distribution curve with depth obtained during the detailed survey and construction survey stages generally has an error of less than 15%, which meets the precision requirement in engineering.
(4) When there are no less than 12 drill holes with spacing of no more than 20m on a site, the rock face dissolution rate distribution curve with depth can well reflect the actual rock face dissolution of the site.
The authors would like to acknowledge the financial support from the Guangxi Natural Science Foundation (Grant No. 2018GXNSFAA138139, No.2017GXNSFAA198238). The work in this paper was also supported by Guangxi Key Laboratory of New Energy and Building Energy Saving (Grant No. 19-J-21-21, No. 17-J-21-5, No. 16-J-21-6).
[1] Stevanović, Z., Milanović, P. (2015). Engineering challenges in karst. Acta Carsologica, 44(3): 381-399. https://doi.org/10.3986/ac.v44i3.2963
[2] Parise, M., Closson, D., Gutiérrez, F., Stevanović, Z. (2015). Anticipating and managing engineering problems in the complex karst environment. Environmental Earth Sciences, 74(12): 7823-7835. https://doi.org/10.1007/s12665-015-4647-5
[3] Lu, Y., Liu, Q. (2013). Environmental characteristics of karst in China and their effect on engineering. Carbonates and Evaporites, 28(1-2): 251-258. https://doi.org/10.1007/s13146-013-0158-1
[4] Zajc, M., Celarc, B., Gosar, A. (2015). Structural–geological and karst feature investigations of the limestone–flysch thrust-fault contact using low-frequency ground penetrating radar (Adria–Dinarides thrust zone, SW Slovenia). Environmental Earth Sciences, 73(12): 8237-8249. https://doi.org/10.1007/s12665-014-3987-x
[5] Zajc, M., Pogačnik, Ž., Gosar, A. (2014). Ground penetrating radar and structural geological mapping investigation of karst and tectonic features in flyschoid rocks as geological hazard for exploitation. International Journal of Rock Mechanics and Mining Sciences, 67: 78-87. https://doi.org/10.1016/j.ijrmms.2014.01.011
[6] Yuhr, L., Kaufmann, J. (2012). Integrating science and engineering to solve Karst problems. Carbonates and Evaporites, 27(2): 95. https://doi.org/10.1007/s13146-012-0111-8
[7] Sheinin, V.I. (2017). Use of ground surface caving model to predict karst cavity effect on soil mass deformation. Soil Mechanics and Foundation Engineering, 54(4): 231-238. https://doi.org/10.1007/s11204-017-9463-3
[8] Santo, A., Budetta, P., Forte, G., Marino, E., Pignalosa, A. (2017). Karst collapse susceptibility assessment: A case study on the Amalfi Coast (Southern Italy). Geomorphology, 285: 247-259. https://doi.org/10.1016/j.geomorph.2017.02.012
[9] Shi, Z., Liu, L., Peng, M. (2016). A sonar detection technology for karst cavities under bored piles and its application. Chinese Journal of Rock Mechanics and Engineering, 35: 177-186. https://doi.org/10.13722/j.cnki.jrme.2015.0125
[10] Ren, A., Ke, B., Cheng, J. (2014). Barrier effect of covered sheet pile wharfs with diaphragm walls. Journal of Hydraulic Engineering, 45(S2): 119-124.
[11] Li, Y.G. (2017). Research on the reconnaissance and design countermeasures of passenger dedicated line in karst area. Journal of railway Engineering Society, 34(6): 1-7.
[12] Peng, S., Chen, W., Xiao, Q. (2015). Karst seepage analysis on left river bend in the head area of guandi hydropower station reservoir. Chinese Journal of Rock Mechanics and Engineering, 34(S2): 4030-4037. https://doi.org/10.13722/j.cnki.jrme.2014.0841
[13] Luo, X. (2013). Division of “Six Belts and Five Types” of carbonate region and control of karst geological disaster in Wuhan. Journal of Hydraulic Engineering, 45: 171-179. https://doi.org/10.13243/j.cnki.slxb.2014.02.006
[14] Hou, F., Ou, X., Su, J., Tang, Y., Li, J., Pan, X. (2012). The method on surrounding rock classification for highway tunnel construction period in the Karst Areas of South China. Journal of Civil, Architectural & Environmental Engineering, 34(S1): 258-262.
[15] Duan, C., Yan, C., Xu, B., Zhou, Y. (2017). Crosshole seismic CT data field experiments and interpretation for karst caves in deep foundations. Engineering Geology, 228: 180-196. https://doi.org/10.1016/j.enggeo.2017.08.009
[16] Xu, C., Di, B., Wei, J. (2016). A physical modeling study of seismic features of karst cave reservoirs in the Tarim Basin, China. Geophysics, 81(1): B31-B41. https://doi.org/10.1190/geo2014-0548.1
[17] Chen, Y. (2016). Probing the subsurface karst features using time-frequency decomposition. Interpretation, 4(4): T533-T542. https://doi.org/10.1190/INT-2016-0030.1
[18] Pan, J., Zhou, S., Lin, P. (2013). Preliminary study of risks of karst collapse in guangzhou baiyun district. Rock and Soil Mechanics, 34(9): 2589-2600.
[19] Gui, J., Yue, Z.Q. (2016). The hydrogeology survey and line selection for the Guanyinshan tunnel of Chengdu-Guiyang railway. Journal of railway Engineering Society, 33(8): 22-25.
[20] Denton, R.K., Hogan, A., Thomas, R.D. (2016). The integration of data review, remote sensing and ground survey for a regional-level karst assessmentregional karst assessment. Environmental and Engineering Geoscience, 22(1): 81-92. https://doi.org/10.2113/gseegeosci.22.1.81
[21] Anchuela, Ó.P., Julián, P.L., Sainz, A.C., Liesa, C.L., Juan, A.P., Cordero, J.R., Benedicto, J.P. (2015). Three dimensional characterization of complex mantled karst structures. Decision making and engineering solutions applied to a road overlying evaporite rocks in the Ebro Basin (Spain). Engineering Geology, 193: 158-172. https://doi.org/10.1016/j.enggeo.2015.04.022
[22] El-Aal, A.K.A., Masoud, A.A. (2017). Impacts of karst phenomena on engineering properties of limestone foundation bed, Ar Riyadh, Saudi Arabia. Arabian Journal of Geosciences, 10(15): 347. https://doi.org/10.1007/s12517-017-3089-7
[23] Wang, H.B., Liu, Z.F., Zhao, W.F. (2013). Research on stability of cave roof under pile loading in bridge construction engineering. Chinese Journal of Rock Mechanics and Engineering, 32(S2): 3650-3657.
[24] Cao, W., Zhai, Y., Wang, J. (2015). Applicability of interval non-probabilistic reliability method in analyzing the stability of karst area. Rock and Soil Mechanics, 36(10): 2955-2962.
[25] Niu, J., Oyediran, I.A., Liu, D., Huang, X., Cui, Z., Wang, H., Shi, X. (2015). Quantitative foundation stability evaluation of urban karst area: Case study of Tangshan, China. Soils and Foundations, 55(3): 493-503.
[26] Jordá-Bordehore, L. (2017). Stability assessment of natural caves using empirical approaches and rock mass classifications. Rock Mechanics and Rock Engineering, 50(8): 2143-2154.
[27] GB50007-2011 Code for Investigation of Geotechnical Engineering. (2012). Beijing: China Architecture & Building Press, China.
[28] Ozcelik, M. (2015). Effect of wastewater on building foundation in karst travertine areas in Antalya, Turkey. Bulletin of Engineering Geology and the Environment, 74(4): 1213-1224. https://doi.org/10.1007/s10064-014-0695-4
[29] Özçelik, M. (2015). Foundation investigations and design in a karst terrain for the Antalya Aquarium complex, Turkey. Quarterly Journal of Engineering Geology and Hydrogeology, 48(3-4): 204-211. https://doi.org/10.1144/qjegh2014-044
[30] Wang, X., He, L., Chen, L., Xu, L., Li, J., Lei, X., Wei, D. (2017). Mapping deeply buried karst cavities using controlled-source audio magnetotellurics: A case history of a tunnel investigation in southwest China. Geophysics, 82(1): EN1-EN11. https://doi.org/10.1190/geo2015-0534.1
[31] Liu, B., Liu, Z.Y., Li, S.C. (2017). Comprehensive surface geophysical investigation of karst caves ahead of the tunnel face: A case study in the Xiaoheyan section of the water supply project from Songhua River, Jilin, China. Journal of Applied Geophysics, 144: 37-49. https://doi.org/10.1016/j.jappgeo.2017.06.013
[32] Howari, F.M., Aldouri, R., Sadiq, A. (2016). Gravity investigations of recent sinkholes and karst pits of Dahal Al-Hamam, State of Qatar. Environmental Earth Sciences, 75(5): 440. https://doi.org/10.1007/s12665-016-5298-x
[33] Cao, X., Zhang, J., Liu, Z., Wang, H., Meng, F. (2014). Quantitative Analysis method for dissolution degree distribution feature with elevation. Journal of Central South University (Science and Technology), 45(7): 2339-2345.