Xianfa Cao | Hegang Tang* | Zhikui Liu | Hailing Li
© 2020 IIETA. This article is published by IIETA and is licensed under the CC BY 4.0 license (http://creativecommons.org/licenses/by/4.0/).
OPEN ACCESS
The dissolution of karst foundations can be divided into rock surface dissolution and hole dissolution. The dissolution features of karst foundations at different depths must be clearly identified before taking proper karst treatment measures. In this paper, more than 200 engineering data samples are collected from typical carbonate karstic regions in southwestern China, and 12 most representative engineering site were picked out. The rock surface dissolution ratio, hole dissolution ratio, and total dissolution ratio were measured at each engineering site, and used to fit the relationship between rock surface dissolution ratio and hole dissolution ratio at different depth sections. The results show that the karst foundation can be split into three sections from top to bottom: rock surface dissolution section Ⅰ, composite dissolution section Ⅱ, and hole dissolution section Ⅲ. The three sections occur inevitably as the rock surface dissolution occurs naturally from the inside. The dissolution degree decreases exponentially with the growing depth, and the rock surface dissolution ratio drops faster than the total dissolution ratio. Moreover, the hole dissolution ratio per unit volume of rock decreases with the increase of depth. If the holes are not developed, the engineering sites will only have rock surface dissolution section; if the holes become more developed, the composite dissolution section will expand gradually and dominate site dissolution. At most locations, the hole dissolution ratios under the minimum elevation of rock surface are within 10%. Finally, it is suggested that the final elevation of the drilling holes must be controlled above the minimum elevation of rock surface. The research results shed new light on the mitigation of dissolution of karst foundations.
karst foundations, rock surface dissolution, hole dissolution, dissolution features
The dissolution of karst foundations can be divided into rock surface dissolution and hole dissolution [1, 2]. In karst regions, the two types of dissolution induce different engineering problems [3-5]. Rock surface dissolution makes the rock surface undulating and the soil-rock foundation nonhomogeneous [6, 7], while hole dissolution causes striking harms to the stability of karst foundations [8, 9]. Therefore, the dissolution type of karst foundations at different depths must be identified before determining the possible engineering problems [10, 11], and designing economic and rational treatment measures [12, 13].
Karst caves are a hotspot in the research of engineering geology in karst regions [14, 15]. Many prospecting geophysical prospecting methods have been widely adopted to explore the development of karst caves [16-19]. Fruitful results have been achieved on the evaluation of roof stability of karst caves [20, 21], providing a good reference for the research into the stability of karst foundations [22, 23]. The features of rock surface dissolution have attracted much attention from engineers and technicians. However, the existing studies have either evaluated these features on the macroscale or focused the features of individual caves. There is little report on the dissolution features deep in karst foundations.
In this paper, more than 200 engineering data samples are collected from typical carbonate karstic regions in southwestern China, and 12 most representative engineering site were picked out. Referring to the correlations between karst ground corrosion and depth [24, 25], the authors measured the rock surface dissolution ratio, hole dissolution ratio, and total dissolution ratio at each engineering site, and probed deep into the relationship between rock surface dissolution ratio and hole dissolution ratio at different depth sections, with the aim to disclose the dissolution features of karst foundations.
2.1 Data collection
Southwestern China has the world’s most representative carbonate karst landform. All types of karst landscapes are available in this karst region. The authors gathered over 200 engineering data samples from several cities in Guangxi Zhuang Autonomous Region, such as Nanning, Liuzhou, Guilin, to name but a few. More than 1,200 buildings are involved in the collected data.
In addition, geological data were collected from multiple places in the said karst region, including Shenzhen (Guangdong Province), Longyan (Fujian Province), Kunming (Yunnan Province), Guiyang (Guizhou Province), and Chongqing (Chongqing Municipality). Ranging from 50 to 2,100m in elevation, these places have diverse landforms (e.g. basins, hills, mountains, and plateaus) and belong to different climates (e.g. tropical climate and subtropical climate).
Considering the sheer volume of data, only the most representative samples were selected for analysis. Table 1 summarizes the basics of the engineering sites involved in our samples.
Table 1. Summary of engineering sites
|
Site ID |
Sites of projects |
Project name |
Sub-area |
Total rock exposure thickness /each |
Penetration rate of boreholes /% |
Total height of the cave /m |
Karst rate /% |
|
1 |
Pingguo County, Baise |
Jinhao Community |
East area |
39 |
69.23 |
75.65 |
17.34 |
|
West area |
43 |
88.37 |
94.27 |
19.72 |
|||
|
2 |
Wuming County, Nanning |
Zhongxu Modern City |
East area |
69 |
40.58 |
96.80 |
16.05 |
|
West area |
68 |
51.47 |
109.25 |
17.45 |
|||
|
3 |
Hechi |
Tonggu Garden |
Building 1 |
78 |
47.44 |
35.7 |
3.38 |
|
Building 2 |
71 |
5.63 |
6.40 |
0.47 |
|||
|
4 |
Guilin |
Guangxi’s 5th Reformatory |
Building 3 |
51 |
58.82 |
208.4 |
39.32 |
|
Building 4 |
56 |
46.43 |
88.53 |
20.67 |
|||
|
5 |
Hezhou |
Fengdan Bailu |
South area |
54 |
5.56 |
3.80 |
1.00 |
|
North area |
67 |
7.46 |
8.30 |
1.71 |
|||
|
6 |
Liuzhou |
Jinsheng Plaza |
Building 4 |
56 |
42.86 |
85.57 |
15.95 |
|
Building 5 |
85 |
55.29 |
146.29 |
17.3 |
|||
|
7 |
Laibin |
South Bank of Jiacheng |
Building 1 |
61 |
21.31 |
40.5 |
5.91 |
|
Building 2 |
76 |
51.32 |
152.81 |
16.7 |
|||
|
8 |
Zhijin County, Guiyang |
Zhijin International Plaza |
Building 6 |
43 |
23.26 |
118.10 |
17.84 |
|
Building 7 |
44 |
9.09 |
6.40 |
1.20 |
|||
|
9 |
Xiushan County, Chongqing |
Qianlong Yangguang Yuyuan |
Building 4 |
86 |
43.02 |
57.44 |
4.92 |
|
Building 5 |
29 |
72.41 |
70.05 |
18.49 |
|||
|
10 |
Kunming |
Security checking building in south of some airport’s office district |
Block A1 |
12 |
8.33 |
3.35 |
2.64 |
|
Block A2 |
24 |
8.33 |
6.16 |
2.42 |
|||
|
11 |
Longyan |
Women and Children’s Activity Center |
Eastern section |
67 |
14.93 |
56.65 |
8.86 |
|
Western section |
54 |
18.52 |
45.37 |
9.36 |
|||
|
12 |
Shenzhen |
Outpatient Building of Traditional Chinese Medicine |
Southern section |
66 |
45.45 |
77.25 |
11.40 |
|
Northern section |
66 |
31.82 |
53.50 |
9.35 |
Each engineering site was further divided as follows: if the site has no or only one building, it was divided into two areas or blocks; if the site has multiple buildings, two typical buildings were selected for further analysis. For simplicity, the areas, blocks, and selected buildings are collectively referred to as locations. Therefore, a total of 24 locations were created for the subsequent analysis.
2.2 Data processing
Based on the length ΔH of depth section, the lower limit Ha and upper limit Hb of elevation can be respectively defined as:
$\left.\begin{array}{l}H_{a}=\Delta H \cdot \operatorname{int}\left(\frac{H_{\min }}{\Delta H}\right) \\ H_{b}=\Delta H \cdot \operatorname{int}\left(\frac{H_{\max }}{\Delta H}\right)\end{array}\right\}$ (1)
where, Hmin is the minimum elevation at the bottom of the depth section, i.e. the minimum elevation of rock surface; Hmax is the maximum elevation of the rock surface; int () is a rounding function. Then, the elevation at the bottom of each section can be denoted as Hi [Ha, Hb). From top to bottom, the depth sections can be sorted as H1>H2>…>Hi-1>Hi>Hi+1>…
In the depth interval (Hi-1, Hi], the total dissolution ratio ri, the rock surface dissolution ratio ri', and the hole dissolution ratio ri'' can be respectively calculated by:
$\left\{\begin{array}{l}r_{i}=\frac{l_{i}}{L_{i}} \times 100 \% \\ r_{i}^{\prime}=\frac{s_{i}}{L_{i}} \times 100 \% \\ r_{i}^{\prime \prime}=\frac{d_{i}}{L_{i}} \times 100 \%\end{array}\right.$ (2)
where, li and Li are the dissolution height of the depth section (Hi-1, Hi] and the cumulative footage of the rock layers, respectively. The former consists of two parts: hole dissolution height di and rock surface dissolution height si.
Suppose all drilling holes extend below elevation Hi. Then, li and Li can be respectively calculated by:
$\left\{\begin{array}{l}l_{i}=s_{i}+d_{i} \\ L_{i}=n \cdot \Delta H\end{array}\right.$ (3)
where, n is the total number of holes.
Substituting equation (3) into equation (2), we have:
$r_{l}=\frac{s_{l}+d_{l}}{n \cdot \Delta H} \times 100 \%$ (4)
Hole dissolution height di refers to the cumulative footage of all holes uncovered in the depth section (Hi-1, Hi]. The value of di can be obtained by:
$d_{i}=\sum_{j=1}^{m}\left[m i n\left(H_{i-1}, H_{1 k}^{\prime}\right)-\max \left(H_{i}, H_{2 k}^{\prime}\right)\right]$ (5)
where, m is the number of holes whose elevation is greater than Hi at the roof of the cave and smaller than Hi-1 at the bottom of the cave; min () and max () are minimization and maximization functions, respectively; $H_{1 k}^{\prime}$ and $H_{2 k}^{\prime}$ are the top and bottom elevations of each hole, respectively.
Rock surface dissolution height si refers to the difference between the initial elevation of rock surface and the elevation of the drilled rock surface, that is, the cumulative height of all drilled rock surfaces in the depth section (Hi-1, Hi]. The value of si can be obtained by:
$s_{i}=\sum_{k=1}^{n}\left[\max \left(H_{i-1}, H_{r k}\right)-\max \left(H_{i}, H_{r k}\right)\right]$ (6)
where, Hrk is the elevation of the drilled rock surface.
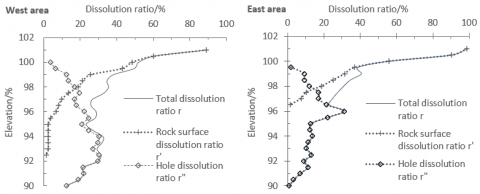
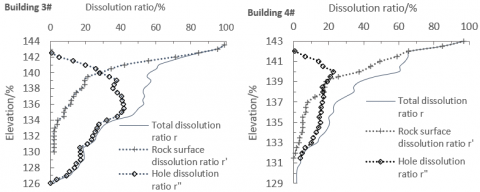
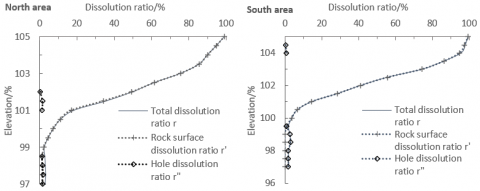
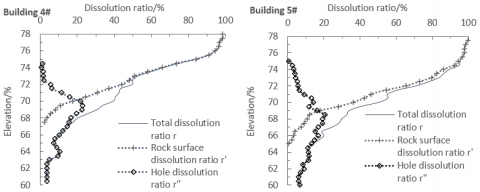
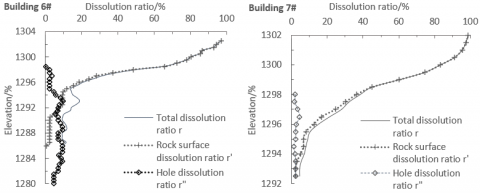
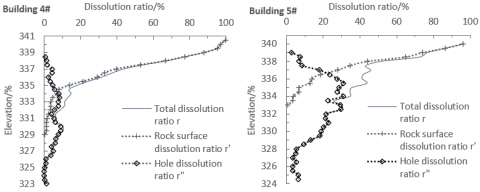
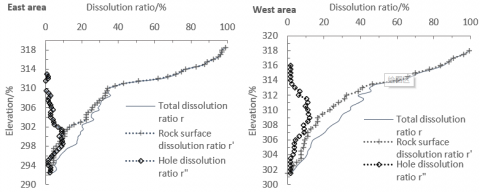
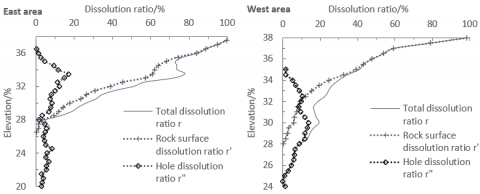
According to the above equations, the total dissolution ratio, rock surface dissolution ratio, and hole dissolution ratio in each depth section were obtained. On this basis, the relationship curves between depth and the three rates were drawn for each engineering site (Figure 1).
Site 1: Jinhao Community, Pingguo County, Baise
Site 2: Zhongxu Modern City, Wuming County, Nanning
Site 3: Tonggu Garden, Hechi
Site 4: Guangxi Fifth Reformatory, Guilin
Site 5: Fengdan Bailu, Hezhou
Site 6: Jinsheng Plaza, Liuzhou
Site 7: South Bank of Jiacheng, Laibin
Site 8: International Plaza, Zhijin County, Guiyang
Site 9: Qianlong Yangguang Yuyuan, Xiushan County, Chongqing
Site 10: Security Inspection Building, Airport X, Yunnan
Site 11: Women and Children’s Activity Center, Longyan
Site 12: Outpatient Building of a Traditional Chinese Medicine Hospital, Shenzhen
Figure 1. The variations in the total dissolution ratio, rock surface dissolution ratio, and hole dissolution ratio with depths at the 12 engineering sites
As mentioned before, the dissolution of karst foundations falls into rock surface dissolution and hole dissolution. According to the relationship curves in Figure 1, rock surface dissolution is more prominent than hole dissolute within the depth section of karst foundations at the selected sites.
3.1 Relationship between depth and rock surface dissolution ratio
With the growing depth, the rock surface dissolution ratio attenuates much faster than the total dissolution ratio. In the three non-developed locations (Building 2, Site 3; South area, Site 5; North area, Site 5), rock surface dissolution is the only form of dissolution. In karst foundations, the total dissolution ratio typically has an exponential decrease with the growth of depth. Therefore, the rock surface dissolution rates of the three non-developed locations are bound to decline exponentially, as the depth goes deeper. The other 21 locations basically agree with the 3 non-developed locations in the relationship between depth and rock surface dissolution ratio. Thus, it can be concluded that, as the depth increases, the rock surface dissolution rates of the 21 locations will also decay exponentially.
3.2 Relationship between depth and hole dissolution ratio
With the growing depth, the hole dissolution ratio at each location goes up first and then decreases, and its peak generally appears at similar depth as the rock surface dissolution ratio. In the distribution range of rock surface dissolution ratio, the hole dissolution ratio decreases rapidly, except for the two locations in Site 1. The hole distribution ratios at the two locations are over 20%, while those at the other 22 locations are no greater than 15%.
At developed locations, the hole dissolution ratio soars, as the depth grows in the shallow soil. However, hole dissolution ratio does not necessarily increase with depth in shallow layers. The soaring hole dissolution ratio in the shallow depth range is attributable to the fierce dissolution of rock surfaces, which narrows down the space of rock required for hole growth. With the growth of depth, the space of rock increases, so does the space of holes.
Let rd be relative hole development ratio, i.e. the ratio of the volume of developed holes to the volume of rock: rd= r ''/(1-r '), where r ' and r '' are the rock surface dissolution ratio and hole dissolution ratio, respectively. Then, rd can be regarded as the hole dissolution ratio per unit volume of rock. At developed locations, the rock surface dissolution decays evidently greater than the growth of hole dissolution, if the depth range is above the peak of hole dissolution curve. In other words, the denominator (1-r'), the growth rate with depth, is much greater than the numerator r'', indicating that the hole dissolution ratio per unit volume of rock must decrease with the growth in depth.
3.3 Relationship between two types of dissolutions at different depths
As shown in Figure 1, there is a large overlap between the curve of hole dissolution ratio and the curve of rock surface dissolution in the depth section. But the hole dissolution concentrates at shallower depth than rock surface dissolution. To analyze the relationship between two types of dissolutions at different depths, this paper divides the dissolution of karst foundations into three sections from top to bottom: rock surface dissolution section Ⅰ, composite dissolution section Ⅱ, and hole dissolution section Ⅲ. The bottom elevation of the dissolution section was set as the elevation at which the total dissolution ratio equals 10%. This is because dissolution has little impact on the weathering features of the foundations, if the total dissolution ratio drops below 10% as the depth continues to increase.
3.3.1 Comparison between Sections I and II
In Section I, there is no hole dissolution but rock surface dissolution; the curve of rock surface dissolution coincides with the curve of total dissolution ratio, and the hole dissolution ratio equals zero. In Section II, both rock surface dissolution and hole dissolution take place, and the ratios of the two dissolutions are greater than zero. In Section III, there is no rock surface dissolution but hole dissolution; the curve of hole dissolution coincides with the curve of total dissolution ratio, and the rock surface dissolution ratio equals zero.
At the 24 locations in Figure 1, the thickness of Section I generally falls between 0.5m and 0.6m. The only exception is Block A1, Site 10, where this section is as thick as 7.5m. Overall, the thickness of Section I at the 24 locations averages at 2.6m. The thickness of Section II lies between 2.0m and 16.5m, putting the average at 8.1m. The relationship between Sections I and II at each location is detailed below:
At the two locations of Site 1, Section I (1.5m and 1.0m) is much thinner than Section 2 (3.5m and 2.0m). At the two locations of Site 2, Section I (both 0.5m) is also much thinner than Section 2 (both 10.5m). In Site 3, Section I (0.5m) is far thinner than Section 2 (6.0m) at Building 1. At the two locations of Site 4, Section I (both 1.5m) are still much thinner than Section 2 (16.0m and 9.5m). In south area of Site 5, Section I (1.0m) is slightly thinner than Section II (4.0m) at South area. At Building 4 of Site 6, Section I (6.0m) is slightly thinner than Section II (7.5m); at Building 5 of Site 6, Section I (3.0m) is significantly thinner than Section II (10.5m). At the two locations of Site 7, Section I (4.5m and 1.0m) is far behind Section II (8.5m and 16.0m) in thickness. At the two locations of Site 8, Section I (2.0m and 4.5m) is only half as thick as Section II (4.0m and 8.0m). At the two locations of Site 9, Section I (2.5m and 1.5m) has a much smaller thickness than Section II (9.0m and 6.0m). At the two locations of Site 11, Section I (6.0m and 2.5m) is still much less thick than Section 2 (6.5m and 12.5m). At the two locations of Site 12, Section I (1.5m and 3.5m) is towered over by Section II (8.5m and 7.0m) in thickness. By contrast, Section I (6m) is slightly thicker than Section II (5m) in Block A1 of Site 10, due to the absence of holes; Section I is also slightly thicker than Section II in the north area of Site 5 (3.5m vs. 2.0m), as well as at Building 2, Site 3 (3.5m vs. 2.5m), and in Block A2 of Site 10 (6.0m vs 5.0m). To sum up, Section I is slightly or significantly thinner than Section II in almost all locations, except Site 10, the north area of Site 5, and Building 2, Site 3.
The comparison between Sections I and II shows that rock surface dissolution section and composite dissolution section are mutually exclusive: the rock surface dissolution section is as thick as the dissolution section, if the holes are not developed or weakly developed; the rock surface dissolution section becomes thinner and thinner, with the development of holes, while composite dissolution section gains in thickness.
This phenomenon agrees with the layer distribution of karst foundations from the surface to the inside, and reflects the unidirectional transformation between different types of dissolutions: under certain conditions (e.g. roof seepage and collapse), the shallow holes on rock surface will undergo the shift from hole dissolution to rock surface dissolution. The two types of dissolutions have the same mechanisms, and only differ in locations. Thus, it is appropriate to express the two types of dissolutions with total dissolution ratio.
3.3.2 Features of Section III
Out of the 24 locations, hole dissolution section III only appears in 6 locations, namely, east area and west area of Site 1, Building 1 of Site 3, Buildings 4 and 5 of Site 6, and Building 5 of Site 9.
Here will divide the Section III into two parts with total dissolution ratio(r) : III-1 (r > 20%), III-2 (10% ≤ r ≤ 20% ). Among the 6 locations, part III-1 only exists at the east area and west area of Site 1. In the two areas, part III-1 (1.0m 4.0m) accounts for 10% and 28.57% of the total thickness of the dissolution section (Ⅰ + Ⅱ + Ⅲ), respectively; part III-2 (4.0m and 7.0m) takes up 40% and 50% of TDT. At the other four locations, there is only part III-2. At Building 1 of Site 3, Buildings 4, 5 of Site 6, and Building 5 of Site 9, part III-2 (2.5m, 2.0m, 3.0m, 1.5m) is about 27.8%, 12.9%, 18.2% and 16.7% of the total dissolution section in thickness.
It can be seen that, at most locations, Part III-1 only accounts for a small portion of the total dissolution section in thickness. This proportion rarely surpasses 20% or even 50%. Section III is not remarkably dissolved: the total dissolution ratio is basically below 20%, with very few exceptions. Section III is less dissolved than Section II, indicating that rock surface dissolution occurs naturally from the inside.
3.4 Minimum elevations of rock surface
At each location, the minimum elevation of rock surface can be identified based on the depth where the rock surface dissolution ratio drops to zero. The minimum elevation of rock surface and the maximum hole dissolution ratio below that elevation at each location are listed below:
The minimum elevation of rock surface and the maximum hole dissolution ratio below that elevation are 96.5m and 31.03% in the east area of Site 1, 92.5m and 30.03% in the west area of Site 1, 90m and 5.91% in the east area of Site 2, 89.5m and 6.5% in the west area of Site 2, 195.5m and 10.56% at Building 1 of Site 3, 194.5m and 1.77% at Building 2 of Site 3, 130m and 17.06% at Building 3 of Site 4, 131.5m and 3.93% at Building 4 of Site 4, 67m and 14.57% at Building 4 of Site 5, 64.5m and 11.85% at Building 5 of Site 5, 58.5m and 1.64% at Building 1 of Site 7, 59.5m and 4.71% at Building 2 of Site 7, 1,288.5m and 9.3% at Building 6 of Site 8, 1,288m and 11.34% at Building 7 of Site 8, 328.5m and 6.09% at Building 4 of Site 9, 333m and 29.52% at Building 5 of Site 9, 2,040m and 8.32% in Block A1 of Site 10, 2,036m and 4.17% in Block A2 of Site 10, 26m and 8.39% in the east area of Site 11, 300m and 5.21% in the west area of Site 11, and 27.5m and 6.61% in the east of Site 12, respectively. The holes are not developed in the north and south areas of Site 5, where the maximum hole dissolution ratio is 1.49% below the minimum elevation of rock surface.
The above data shows that three locations see their hole dissolution ratios surpass 20% below the minimum elevation of rock surface: the east and west areas of Site 1 and Building 5 of Site 9. Four locations have their hole dissolution ratios fall between 10% and 20% below the minimum elevation of rock surface: Building 1 of Site 3, Buildings 4 and 5 of Site 6, and Building 7 of Site 8. At all the other 17 locations, the hole dissolution ratios are less than 10% below the minimum elevation of rock surface. This ratio could reach 30% or more at very few locations.
At each location, the minimum elevation of rock surface might also be the baseline of dissolution elevation. To evaluate the dissolution features of an engineering site, the final elevation of the drilling holes must be controlled above the minimum elevation of rock surface. This is the basic requirement for the engineering prospecting of karst foundations.
(1) The dissolution of karst foundations can be divided into rock surface dissolution and hole dissolution. Rock surface dissolution is more prominent than hole dissolute within the depth section of karst foundations at the selected sites. The karst foundation can be split into three sections from top to bottom: rock surface dissolution section Ⅰ, composite dissolution section Ⅱ, and hole dissolution section Ⅲ. The three sections occur inevitably as the rock surface dissolution occurs naturally from the inside.
(2) With the growing depth, the rock surface dissolution ratio and total dissolution ratio both decrease exponentially. If the site has highly developed holes, the rock surface dissolution ratio will decrease faster than the total dissolution ratio, as the depth gradually increases.
(3) With the growing depth, the hole dissolution ratio goes up first to a peak value and then decreases, while the hole dissolution ratio per unit volume of rock continues to decline. Therefore, the dissolution degree of engineering sites must be negatively correlated with the depth.
(4) If the holes stop from developing, the engineering sites will only have rock surface dissolution section. If the holes become more developed, the composite dissolution section will expand gradually, and grow into the main factor of site dissolution. In the selected sites, the holes are not well developed. Their total dissolution ratios are generally below 20%. This ratio is above 30% at very few locations.
(5) At most locations, the hole dissolution ratios under the minimum elevation of rock surface are within 10%. This ratio could reach 30% or more at very few locations. The minimum elevation of rock surface might be the baseline of dissolution elevation. Thus, it is suggested that the final elevation of the drilling holes must be controlled above the minimum elevation of rock surface.
This paper was supported by the National Natural Science Foundation of China (Grant No. 41867039), the Guangxi Natural Science Foundation of China (Grant No. 2018GXNSFAA138139, 2017GXNSFAA198238) and Guangxi Key Laboratory of New Energy and Building Energy Saving (Grant No. 17-J-21-5, 19-J-21-21, No. 16-J-21-6).
[1] Rantitsch, G., Prochaska, W., Seyer, M., Lotz, H., Kurtze, C. (2016). The drowning of ancient Limyra (southwestern Turkey) by rising groundwater during Late Antiquity to Byzantine times. Austrian Journal of Earth Sciences, 109(2): 203-210. https://doi.org/10.17738/ajes.2016.0015
[2] Aghajani, H.F. (2018). The effect of embedded gypsum streaks on the dissolution of dam foundation: a case study in Iran. Sādhanā, 43(5): 69. https://doi.org/10.1007/s12046-018-0820-3
[3] El-Aal, A.K.A., Masoud, A.A. (2017). Impacts of karst phenomena on engineering properties of limestone foundation bed, Ar Riyadh, Saudi Arabia. Arabian Journal of Geosciences, 10(15): 347. https://doi.org/10.1007/s12517-017-3089-7
[4] Özel, S., Darıcı, N. (2020). Environmental hazard analysis of a gypsum karst depression area with geophysical methods: a case study in Sivas (Turkey). Environmental Earth Sciences, 79(5): 1-14. https://doi.org/10.1007/s12665-020-8861-4
[5] Sheinin, V.I. (2017). Use of Ground Surface Caving Model to Predict Karst Cavity Effect on Soil Mass Deformation. Soil Mechanics and Foundation Engineering, 54(4): 231-238. https://doi.org/10.1007/s11204-017-9463-3
[6] Santo, A., Santangelo, N., De Falco, M., Forte, G., Valente, E. (2019). Cover collapse sinkhole over a deep buried carbonate bedrock: The case study of Fossa San Vito (Sarno-Southern Italy). Geomorphology, 345: 106838. https://doi.org/10.1016/j.geomorph.2019.106838
[7] Gotman, N.Z., Kayumov, M.Z. (2013). Foundation Analysis of Buildings with Developed Underground Section on Karst-Prone Lands. Soil Mechanics and Foundation Engineering, 50(4): 150-157. https://doi.org/10.1007/s11204-013-9227-7
[8] Gotman, N.Z. (2008). Analysis of anti-karst foundations for buildings and structures. Soil Mechanics and Foundation Engineering, 45(1): 23-29. https://doi.org/10.1007/s11204-008-0005-x
[9] Santo, A., Budetta, P., Forte, G., Marino, E., Pignalosa, A. (2017). Karst collapse susceptibility assessment: A case study on the Amalfi Coast (Southern Italy). Geomorphology, 285: 247-259. https://doi.org/10.1016/j.geomorph.2017.02.012
[10] Jordá-Bordehore, L. (2017). Stability assessment of natural caves using empirical approaches and rock mass classifications. Rock Mechanics and Rock Engineering, 50(8): 2143-2154. https://doi.org/10.1007/s00603-017-1216-0
[11] Liso, I.S., Chieco, M., Fiore, A., Pisano, L., Parise, M. (2020). Underground geosites and caving speleotourism: some considerations, from a case study in southern Italy. Geoheritage, 12(1): 13. https://doi.org/10.1007/s12371-020-00424-z
[12] Gotman, N.Z. (2019). Evaluation of Karst Manifestation Parameters by Results of Numerical Calculations of Foundations. Soil Mechanics and Foundation Engineering, 56(5): 295-301. https://doi.org/10.1007/s11204-019-09605-7
[13] Aal, A.K.A.Е., Nabawy, B.S., Aqееl, A., Abidi, A. (2020). Gеohazards assessment of the karstifiеd limestone cliffs for safe urban constructions, Sohag, West Nile Valley, Egypt. Journal of African Earth Sciences, 161: 103671. https://doi.org/10.1016/j.jafrearsci.2019.103671
[14] Baggett, J., Abbasi, A., Monsalve, J., Bishop, R., Ripepi, N., Hole, J. (2020). Ground-Penetrating Radar for Karst Detection in Underground Stone Mines. Mining, Metallurgy & Exploration, 37(1): 153-165. https://doi.org/10.1007/s42461-019-00144-1
[15] Gökkaya, E., Tunçel, E. (2019). Natural and human-induced subsidence due to gypsum dissolution: a case study from inandik, central anatolia, Turkey. Journal of Cave & Karst Studies, 81(4). https://doi.org/10.4311/2019ES0105
[16] Caselle, C., Bonetto, S., Comina, C., Stocco, S. (2020). GPR surveys for the prevention of karst risk in underground gypsum quarries. Tunnelling and Underground Space Technology, 95: 103137. https://doi.org/10.1016/j.tust.2019.103137
[17] Mogren, S. (2020). Integrated use of electrical resistivity tomography and ground penetration radar for identifying subsurface sinkholes in Rufa Graben, Central Riyadh. Arabian Journal of Geosciences, 13(1): 1-16. https://doi.org/10.1007/s12517-019-5017-5
[18] Mebrahtu, G., Abay, A., Hailu, G., Hagos, M. (2020). Electrical resistivity imaging and engineering geological investigation of Gereb Segen dam, northern Ethiopia. Bulletin of Engineering Geology and the Environment, 79(1): 83-95. https://doi.org/10.1007/s10064-019-01577-0
[19] Gołębiowski, T., Jarosińska, E. (2019). Application of GPR and ERT methods for recognizing of gypsum deposits in urban areas. Acta Geophysica, 67(6): 2015-2030. https://doi.org/10.1007/s11600-019-00370-7
[20] Wang, P., Ding, H., Zhang, P. (2020). Influence of Karst Caves at Pile Side on the Bearing Capacity of Super-Long Pile Foundation. Mathematical Problems in Engineering. https://doi.org/10.1155/2020/4895735
[21] Özçelik, M. (2015). Foundation investigations and design in a karst terrain for the Antalya Aquarium complex, Turkey. Quarterly Journal of Engineering Geology and Hydrogeology, 48(3-4): 204-211. https://doi.org/10.1144/qjegh2014-044
[22] Niu, J., Oyediran, I.A., Liu, D., Huang, X., Cui, Z., Wang, H., Shi, X. (2015). Quantitative foundation stability evaluation of urban karst area: Case study of Tangshan, China. Soils and Foundations, 55(3): 493-503. https://doi.org/10.1016/j.sandf.2015.04.002
[23] Duan, C., Yan, C., Xu, B., Zhou, Y. (2017). Crosshole seismic CT data field experiments and interpretation for karst caves in deep foundations. Engineering Geology, 228: 180-196. https://doi.org/10.1016/j.enggeo.2017.08.009
[24] Cao, X., Zhang, J., Liu, Z., Wang, H., Meng, F. (2014). School of Civil Engineering, Central South University; College of Civil Engineering and Architecture, Guilin University of Technology; Tianjin Research Institute for Water transport Engineering; Quantitative analysis method for dissolution degree distribution feature with elevation. Journal of Central South University(Science and Technology), 7.
[25] Cao, X., Zhang, J., Liu, Z. (2014). Dissolution degree distribution law with depth in building ground in karst terrain. Journal of Central South University(Science and Technology), 45(8): 2787-2792.