Syamsul Bahri*![]() | Lailia Awalushaumi
| Lailia Awalushaumi![]() | Nuzla Af’idatur Robbaniyyah
| Nuzla Af’idatur Robbaniyyah![]()
© 2024 The authors. This article is published by IIETA and is licensed under the CC BY 4.0 license (http://creativecommons.org/licenses/by/4.0/).
OPEN ACCESS
This research aims to model tourist visit data to West Nusa Tenggara Province (NTB) using a hybrid model, combining the dynamic neural network method as the core model with the wavelet method and fuzzy inference as tools to optimize the model. The model developed in this research is referred to as the Fuzzy Wavelet Dynamic Neural Networks (FW-DNN) Model. The FW-DNN model is a feed-forward dynamic neural network model that utilizes the Wavelet B-spline function as its activation function and TSK (Takagi-Sugeno-Kang) fuzzy inference as the method for information aggregation. The modeling results on both in-sample and out-sample data show that the proposed FW-DNN model is capable of representing the patterns in tourist visit data to NTB quite effectively. Similar results were also observed in the patterns of data for both domestic and international tourist visit numbers. Based on the root of mean square error (RMSE) indicator, the performance of the developed FW-DNN model for aggregated tourist visit data is 95185.09 for in-sample data and 22615.54 for out-sample data. Partial performance analysis of the FW-DNN model for international tourist visit data shows a value of 39848.94 for in-sample data and 5223.86 for out-sample data. Similarly, the FW-DNN model's performance for domestic tourist visit data is 39848.94 for in-sample data and 5223.86 for out-sample data. Practically, the results of this research can be input for the NTB Provincial government in determining tourism management and/or development policies, especially related to the provision of supporting facilities and infrastructure, or the private sector in an effort to optimize the carrying capacity and/or services for tourists visiting NTB.
dynamic neural network, model, tourism, wavelet, fuzzy inference
The West Nusa Tenggara Province (NTB) offers a diverse range of tourist attractions, including natural wonders, beaches and marine activities, religious and cultural experiences, also national parks and historical sites. The natural beauty of NTB includes stunning and pristine coastlines, mesmerizing coral reef tourism, and high-quality handicrafts such as pearl jewelry, bamboo crafts, and cukli (a type of woven fabric). Additionally, the region boasts a rich cultural heritage with various cultural attractions, historical sites, the Gunung Tambora National Park, and the Gunung Rinjani National Park, which has been recognized as one of the World Geopark sites. Due to these comparative advantages, Lombok, one of the two major islands in NTB, has been designated as a super-priority destination area in Indonesia, alongside Danau Toba, Borobudur and its surrounding areas, Labuan Bajo, and Manado-Likupang (Ministry of Tourism and Creative Economy of the Republic of Indonesia) [1].
Before the Covid-19 pandemic, West Nusa Tenggara (NTB) was a region experiencing significant tourism growth. The number of tourists visiting NTB increased from 1,357,602 individuals in 2013 and reached its peak in 2017 with a total of 3,508,903 visitors. NTB province was ranked 18th among Indonesia's tourism destinations, despite a decline in tourist arrivals in 2018 due to an earthquake disaster. This decline was further exacerbated by the Covid-19 pandemic, resulting in the year-end 2021 figure of 875,773 tourists [2]. In 2021, positive factors emerged with the hosting of the World Superbike (WSBK) Mandalika 2021 event, followed by the MotoGP 2022 event. Both of these international activities, supported by national and NTB provincial programs, aimed to boost the number of tourist visits to West Nusa Tenggara Province (NTB) and specifically Lombok. They served as crucial drivers and positive stimuli for the revival of tourism in Lombok. In light of this, research on tourist visitation models and patterns becomes important. Such research can serve as a reference for the government as regulators and for tourism businesses as executors. It helps inform strategies and decisions to further develop and enhance tourism in the region.
Several studies related to modeling and forecasting tourist visit numbers have been conducted, but most of them have relied on statistical methods as their core models. However, statistical methods have their limitations, as they require data to be stationary, free from heteroskedasticity, and homogeneous. Since the 1990s, researchers have been developing soft computing-based methods for modeling and forecasting time series data. Soft computing methods offer advantages for handling non-stationary, heteroskedastic, and non-homogeneous data, making them valuable tools for tourism data analysis and prediction. Soft computing techniques are based on several methods, including fuzzy logic, neural networks, genetic algorithms, wavelets, and their combinations. These methods, either individually or in combination, have been used successfully to address time series problems [3-7]. Among the advantages of soft computing methods, whether used partially or in hybrid approaches, are their adaptive capabilities, self-learning algorithms, generalization abilities, the ability to solve complex and intricate nonlinear problems, and their capacity to handle uncertainty. From a computational perspective, several studies have demonstrated that hybrid models yield significant improvements in terms of the effectiveness and efficiency of the models used.
Time series data analysis has evolved alongside advancements in science and technology. Soft computing techniques such as neural networks (NN), fuzzy logic, and wavelets have been used as alternative models in time series analysis [3, 6, 8]. The use of NN models for analysis is based on several advantages, including their adaptive capabilities, self-learning algorithms, generalization abilities, and their ability to address complex and intricate nonlinear problems [3]. Abdullah and Kasmuri [9] categorize NN models into two types: static neural network (SNN) and dynamic neural network (DNN) models. SNN models are based on a specific point in time, whereas DNN models adapt to changes over time. Based on this, the application of DNN methods is considered more rational and realistic compared to SNN models [10].
Research related to modeling tourist visits with different focuses has been conducted, including the study of Li et al. [11], who discussed tourism forecasting models based on internet media such as search engines, web traffic, social media, and multiple sources. Park et al. [12] discussed forecasting models for tourist data obtained online for those visiting Hong Kong, using SARIMA/SARIMAX methods and exponential smoothing state space (ETS) methods. The study [13] discussed tourist forecasting using deep learning time series methods. Then, Xie et al. [14] addressed the prediction of tourist visits by sea to China, utilizing big data with a machine learning approach. Akın [15] talked about several methods for forecasting tourist visits to Turkey, including seasonal auto-regressive integrated moving average (SARIMA), n-support vector regression, and multi-layer perceptron type neural network models. Additionally, the study [16] discussed the relationship between tourism models and economic growth in Spain.
For domestic research, several researchers have also published their studies. Among them, Siahaan et al. [17] discussed a forecasting model for the number of foreign tourist visits to the Riau Islands using a transfer function model. Susila [18] addressed multivariate modeling of foreign tourist visits to Indonesia through air, sea, and land entry points, involving the impact of the Covid-19 pandemic. Julianto et al. [19] discussed the prediction of tourist visit numbers in West Java using ARIMAX and SARIMAX models based on Google Trends data. Lakuhati et al. [20] discussed factors influencing tourist visits to the Ecotourism Area in Bahoi Village, North Minahasa. Lastly, the study [21] discussed the structural analysis of repeat tourist visits to Badung, Bali.
The advantages of hybrid models combining various soft computing methods, such as adaptability, self-learning algorithms, generalization, and the ability to address complex and intricate nonlinear problems, as well as the capability to handle uncertainty, make the Fuzzy Wavelet Dynamic Neural Network (FW-DNN) model a suitable choice for modeling and forecasting tourist visits to the West Nusa Tenggara (NTB) Province.
2.1 Neural network
The Neural Network (NN) method, developed by Warren McCulloch and Walter Pitts in 1943, has been widely applied and successful in solving various data analysis problems. The characteristics of an NN model are determined by several factors, such as its architecture, activation functions, the learning process it employs, and the optimization principles used to achieve convergence during the learning process [22].
The architecture of an NN model describes the working procedure of the model from input to output. The complexity of the architecture is characterized by the number of layers used and the number of neurons in each layer. Activation functions are one of the crucial variables in an NN model, especially concerning the convergence speed of the model. Activation functions determine whether a neuron is activated or not through a comparison process with a certain threshold value. Generally, activation functions come in several types, such as the step function, piecewise linear function, and sigmoid function.
In several studies, the advantages of wavelet functions in denoising, data compression, and multi-resolution [23] have led to their use in enhancing the performance of NN models. Wavelet functions can play a role in NN models as a method for data pre-processing and/or as activation functions. This integration of wavelet functions into NN models can help improve the model's ability to handle noisy or multi-resolution data effectively.
2.2 Fuzzy inference system
Fuzzy sets were introduced by Lotfi A. Zadeh in 1965 . The fundamental difference between fuzzy sets and crisp sets lies in the definition of their membership values, which are within closed intervals $[0,1] \subseteq \mathbb{R}$, crisp sets only have values of 0 or 1. Fuzzy set A is typically denoted by: $A=\left\{\left(x, \mu_A(x)\right) \mid x \in\right.$ $X\}$, with $\mu_A(x)$ representing the element $x \in A$ in $[0,1] \subseteq \mathbb{R}$.
Inference rules in fuzzy sets typically take the form of IF...THEN. To simplify the problem, let's assume $\left(x_1^0, x_2^0, \cdots, x_n^0\right)$ as input and $\left(x_1^{0^*}, x_2^{0^*}, \cdots, x_n^{0^*}\right)$ fuzzification from $\left(x_1^0, x_2^0, \cdots, x_n^0\right)$ and provide $n$ form $R_k, k=1,2, \cdots, n$ as hypotheses, with
$\begin{gathered}R_k: \text { if } x_1 \in A_1 \wedge x_2 \in A_2 \wedge \cdots \wedge x_n \in A_n \\ \text { then } z_k \in C_k\end{gathered}$ (1)
with $x_k:=x_0^{* k}, k=1,2, \cdots, n$.
So that we obtain the conclusion $z \in C$.
The measure of the contribution of the k-th rule in fuzzy inference methods is known as the "fire level" [24]. In general, the implementation of fuzzy inference rules refers to one of the fuzzy inference rules proposed by Mamdani, Tsukamoto, or Sugeno (Takagi, Sugeno, and Kang, TSK). Each of these methods has its advantages and disadvantages depending on the subject and/or research data. For time series data, the TSK method is quite commonly used due to its ease of calculation and its output in the form of linear equations.
Based on Eq. (1), If the fire level is determined by the equality $\quad \alpha_k=A_1\left(x_1^{0^*}\right) \wedge A_2\left(x_2^{0^*}\right) \wedge \cdots \wedge A_n\left(x_n^{0^*}\right), \quad k=$ $1,2, \cdots, n$, in that case, the individual output is given by $z_k^*=$ $a_1 x_1^{0^*}+a_2 x_2^{0^*}+\cdots+a_n x_n^{0^*}+r_k, k=1,2, \cdots, n$. And the overall system output is given by Eq. (2)
$z=\sum\limits_{k=1}^{n}{{{\alpha }_{k}}}z_{k}^{*}/\sum\limits_{k=1}^{n}{{{\alpha }_{k}}}$ (2)
2.3 Wavelet transformation
Wavelet is a class of functions that can localize a function in two aspects: position (time) and scale (frequency). This ability is what makes wavelet transformation advantageous compared to Fourier transformation, and it is widely applied in data processing, such as signal processing and time series analysis.
Mathematically, wavelets are a family of functions constructed from the processes of translation and dilation of a function, defined as follows [25]:
$\psi_{a, b}(t)=|a|^{-\frac{1}{2}} \psi\left(\frac{t-b}{a}\right), a, b \in \mathbb{R}$ and $a \neq 0$ (3)
with $\psi$ mother wavelet, $a$ represents the scale parameter (dilation), determining the degree of compression or scale, and $b$ represents the translation parameter, determining the time location in the wavelet transformation.
In development and application, several wavelet functions are commonly used, including Haar Wavelet, Daubechies, Mexican Hat, Morlet, B-Spline Wavelet, and others. Each type of wavelet has its advantages over the others based on its function and characteristics. The Haar Wavelet function is the simplest type of wavelet and is widely applied because of its simpler calculation characteristics. It is well-suited for analyzing discrete and linear data types. However, for continuous and nonlinear data types, Haar Wavelet may not provide optimal results. In such cases, it is necessary to choose another wavelet function with nonlinear characteristics, such as Daubechies, Mexican Hat, Morlet, B-Spline, and others.
The Daubechies Wavelet is a type of wavelet with compact support developed by Ingrid Daubechies around the 1990s. Unlike the Haar Wavelet, the Daubechies Wavelet has several families known as Daubechies Wavelets of order N (DbN) for N being a natural number and N≥2. The Daubechies Wavelet of order N has 2N vanishing moments and has compact support in the interval [0, 2N-1]. The Daubechies Wavelet is constructed based on the Daubechies Polynomial of order N-1, defined as follows:
${{P}_{N-1}}(y)=\sum\limits_{k=0}^{N-1}{\left( \begin{matrix} 2N-1 \\ k \\\end{matrix} \right)}{{y}^{k}}{{(-y)}^{N-1-k}}$ (4)
On the other hand, B-Spline Wavelet is a family of wavelets obtained recursively from the convolution of the Haar scaling function [26]. B-Spline Wavelet has several advantages that make it a suitable choice for analysis, including having an explicit formula in both the time and frequency domains, having a symmetric shape, having compact support, and a straightforward manipulation process [27]. Based on the approximation of the Gabor function (cosine-modulated Gaussian), Unser [27] derived the approximation formula for B-Spline wavelets of order n as follows:
$B S^n(x)=\frac{4 b^{n+1}}{\sqrt{2 \pi(n+1) \sigma_w^2}} \cos \left(2 \pi f_0(2 x-1)\right) \exp \left(\frac{-(2 x-1)^2}{2 \sigma_w^2(n+1)}\right)$ (5)
with "$n$" representing the order of the B-Spline wavelet, the constant b=0.657066, $f_0$=0.409177 and $\sigma_w^2$= 0.561145.
The data used in this research are secondary data obtained from the Central Bureau of Statistics (BPS) and the Tourism Department of West Nusa Tenggara Province. The data in question consist of the number of tourist visits to West Nusa Tenggara Province. This data represents the cumulative number of domestic and international tourists visiting NTB from January 2014 to December 2022.
As a representation of time series data, the relationship between components of tourist visitation data is analyzed using the auto-correlation method. Based on this method, the time series data of tourist visits to NTB can be formulated as follows:
$y\left(t_k\right)=f\left(y\left(t_{k-1}\right), y\left(t_{k-2}\right), \cdots, y\left(t_{k-n}\right)\right)$ (6)
for a time $t_k$ and $t_{k-1}, t_{k-2}, t_{k-3}, \cdots, t_{k-n}$ representing the time index before $t_k$ that is correlated with the time index $t_k$ In the application of the $\mathrm{NN}$ model, data with index $t_{k-1}, t_{k-2}, t_{k-3}, \cdots, t_{k-n}$ becomes the input for the FW-DNN model to generate the output data with the time $t_k$.
4.1 Descriptive analysis
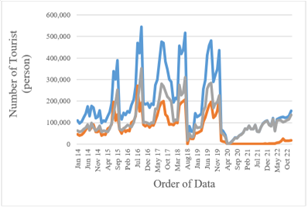
Tourists visiting a region, including West Nusa Tenggara, Indonesia, can be categorized into two groups: foreign tourists and local/domestic tourists. The pattern of tourist visits to West Nusa Tenggara Province from January 2014 to December 2022 is shown in Figure 1. Based on Figure 1, it can be observed that tourist visits to West Nusa Tenggara Province consistently experience an increase around the months of June to September each year, except in 2018 when it advanced from around April to July. The Covid-19 pandemic also had an impact on the decrease in the number of tourist visits to NTB, especially among foreign tourists. Government policies related to restrictions on foreign tourist visits to Indonesia, including NTB at that time, resulted in stagnant foreign tourist numbers until May 2022.
Statistically, as shown in Table 1, during the period from January 2014 to December 2020, the average monthly tourist visits to NTB were 184,772 people, with a breakdown of 70,502 foreign tourists and 114,271 domestic tourists. The maximum number of visits was 544,237 people in September 2016, and the minimum number of visits was 2,610 people in May 2020.
Figure 1. The number of tourist visits to NTB: total tourists (blue), domestic tourists (gray), and foreign tourists (red)
Table 1. Statistics on tourist visit data visiting NTB
|
Total of Tourists |
Foreign Tourists |
Local Tourists |
|
|
Mean |
184772 |
70502 |
114271 |
|
Max |
544237 |
271197 |
352087 |
|
Min |
2610 |
70 |
2465 |
4.2 Modeling the number of tourist visits with a neural network model
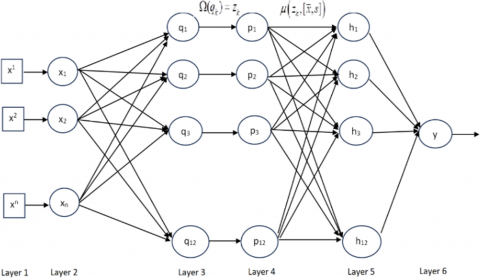
The modeling of tourist visits to West Nusa Tenggara Province (NTB) in this research uses a hybrid model that combines the Dynamic Neural Network Model as the core of the model and the Wavelet and Fuzzy Inference Method as tools to optimize the model. In this study, the proposed hybrid model is called the Fuzzy Wavelet Dynamic Neural Network (FWDNN) model. The architecture of the proposed FWDNN model is shown in Figure 2.
Figure 2. The proposed of FW-DNN architecture
4.3 The algorithm of the proposed FWDNN model
The process of modeling the number of tourist visits to West Nusa Tenggara Province (NTB) using the Neural Network Model is provided by the following FW-DNN algorithm:
The proposed fwdnn algorithm:
Step 1: The input data is organized using Eq. (6), referred to as matrix X.
Step 2: The input matrix X has a size of $n\times m$ and is transformed using the normalization method with the formula:
${{x}_{k}}=\frac{x_{k}^{\prime }-x_{\min }^{\prime }}{x_{_{\max }}^{\prime }-x_{\min }^{\prime }}$ (7)
with $x_k^{\prime} \quad x_{\max }^{\prime}$ and $x_{\min }^{\prime}$ respectively denoted $k$-th data, maximum data value and minimum data value. Then, the data is further processed with a Wavelet Daubechies of 2-nd order transformation (Eq. (4)).
Step 3: The data, after normalization and Wavelet Daubechies of 2-nd order transformation, is aggregated with the weight matrix W of size $n\times m$ using the formula:
${{q}_{k}}=\sum\limits_{j=1}^{n}{{{w}_{jk}}}{{x}_{j}},k=1,2,\cdots ,m$ (8)
Step 4: Value $q_k, k=1,2, \cdots, m$ is activated using the Wavelet B-Spline function of order m=3, as given by Eq. (5), resulting in:
${{z}_{k}}=B{{S}^{m}}\left( {{q}_{k}} \right),k=1,2,\cdots ,n$ (9)
Step 5: For each $k=1,2, \cdots, m$, value $z_k$ It is defuzzied using Gaussian-type fuzzy membership functions with the formula:
${{p}_{k}}=\operatorname{Gauss}(x,[\mu ,\sigma ])=\exp \left( -\frac{1}{2}\times {{\left( \frac{x-\mu }{\sigma } \right)}^{2}} \right)$ (10)
with $\mu$ and $\sigma$ respectively mean and standard deviation from $x_k$.
The Gaussian results are then inferred using the fuzzy TSK method with the rules:
if ${{p}_{1}}\in {{A}_{1}}\wedge {{p}_{2}}\in {{A}_{2}}\wedge \cdots \wedge {{p}_{k}}\in {{A}_{k}}$ then ${{h}_{k}}=\sum\limits_{j=1}^{12}{{{u}_{jk}}}{{p}_{j}}+{{c}_{0}}$ (11)
for some real constant c0.
Step 6: The output of the FW-DNN model is obtained using weighted aggregation with the formula:
$y=\alpha \times \sum\limits_{k=1}^{12}{{{v}_{k}}}{{h}_{k}}+\beta $ (12)
for some real constant $\alpha$ and $\beta$.
4.4 The learning process of the FW-DNN model
The optimization of parameters for learning the FW-DNN model is performed in the backpropagation step. In this case, the parameters being optimized include the weight matrices W, U, and V. The optimization of each of these parameters is carried out using the gradient descent with momentum method to minimize the cost function:
$E=\frac{1}{N}\sum\limits_{j=1}^{N}{{{\left( {{y}_{j}}-y_{j}^{d} \right)}^{2}}}$ (13)
where, $N$ represents the number of data rows, $y_j$ and $y_j^d$ respectively denote the output values of the proposed FWDNN model and the target data value for the $k$-th row, where $k$ ranges from 1 to $N$.
The optimization process of weight parameters is carried out based on the following partial differential equations:
$\frac{\partial E}{\partial W}=\frac{\partial E}{\partial y}\frac{\partial y}{\partial h}\frac{\partial h}{\partial p}\frac{\partial p}{\partial z}\frac{\partial z}{\partial q}\frac{\partial q}{\partial W}$ (14)
$\frac{\partial E}{\partial U}=\frac{\partial E}{\partial y}\frac{\partial y}{\partial h}\frac{\partial h}{\partial U}$ (15)
$\frac{\partial E}{\partial V}=\frac{\partial E}{\partial y}\frac{\partial y}{\partial V}$ (16)
Next, the weight adjustment process for each weight matrix is showed by $W=\left[w_{i j}\right], U=\left[u_{i j}\right], V=\left[v_{i j}\right]$, using the following equation:
${{w}_{ij}}=w_{ij}^{0}+dW,\ \ \ i=1,2,\cdots ,mdanj=1,2,\cdots ,12.$ (17)
${{u}_{ij}}=u_{ij}^{0}+dU,\ \ \ i,j=1,2,\cdots ,12$ (18)
${{v}_{i}}=v_{i}^{0}+dV,\ \ \ i=1,2,\cdots ,12$ (19)
with $w_{i j}^0, u_{i j}^0, v_i^0$ respectively show $w_{i j}, u_{i j}, v_i$ in the previous steps, and
$dW=m\times {{w}_{ij}}-{{\eta }_{r}}\times (1-m)\times \partial {{w}_{ij}}$ (20)
$dU=m\times {{u}_{ij}}-{{\eta }_{r}}\times (1-m)\times \partial {{u}_{ij}}$ (21)
$dV=m\times {{v}_{i}}-{{\eta }_{r}}\times (1-m)\times \partial {{v}_{i}}$ (22)
and $m, \eta_r, \partial w_{i j}, \partial u_{i j}, \partial v_i$ respectively represent the momentum parameter, learning rate, and weight change in the matrix $W=\left[w_{i j}\right], U=\left[u_{i j}\right]$ and $V=\left[v_{i j}\right]$ on Eqs. (17)-(19).
4.5 The FW-DNN model for modeling the number of tourist visits to NTB
4.5.1 The FW-DNN model for tourist visits to NTB
Based on the time series data of tourist visits to West Nusa Tenggara Province as shown in Figure 1, an autocorrelation analysis was conducted, and the results are as follows:
$f\left( {{x}_{t}} \right)=f\left( {{x}_{t-1}},{{x}_{t-2}},{{x}_{t-3}} \right)$
with $f\left(x_t\right)$ is the number of consecutive tourist visits at time $t$ and $f\left(x_{t-1}\right), f\left(x_{t-2}\right), f\left(x_{t-3}\right)$ respectively number of tourist visits at a specific time $(t-1),(t-2)$, and $(t-3)$.
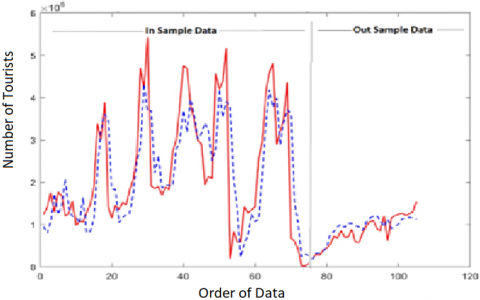
Modeling using the FW-DNN model proposed in this research involves a total of 209 parameters, including 204 weight parameters from matrices W, U, and V, 3 learning rate parameters, and 2 parameters for Gaussian membership functions. The modeling process with FW-DNN learning for 10,000 iterations produces results as shown in Figure 3, with the model pattern adequately representing the patterns of tourist visitation data to West Nusa Tenggara Province. Based on the root of mean square error (RMSE) criteria, the performance of the FW-DNN model generated for in-sample data is 95,185.09, and for out-sample data is 22,615.54.
Figure 3. The number of tourist visits to NTB from January 2014 to December 2020 using the FW-DNN model blue dashed line and actual data (red solid line)
4.5.2 The FW-DNN model for international tourist visits to NTB
Based on the time series data of international tourist visits to West Nusa Tenggara Province as shown in Figure 1, an autocorrelation analysis was conducted, and the results are as follows:
$f\left( {{x}_{t}} \right)=f\left( {{x}_{t-1}},{{x}_{t-2}},{{x}_{t-3}},{{x}_{t-4}} \right)$
with $f\left(x_t\right)$ is the number of consecutive tourist visits at time $t$ and $f\left(x_{t-1}\right), f\left(x_{t-2}\right), f\left(x_{t-3}\right), f\left(x_{t-4}\right)$ respectively number of tourist visits at a specific time $(t-1),(t-2),(t-$ $3)$, and $(t-4)$.
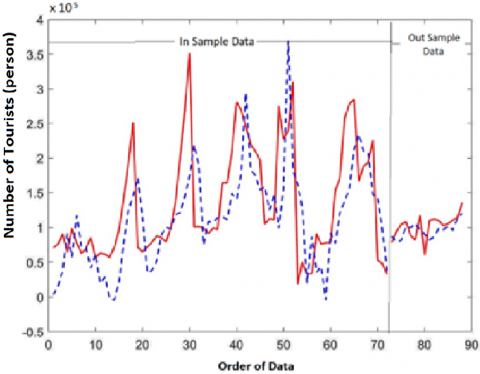
Modeling using the FW-DNN model proposed in this research involves a total of 209 parameters, consisting of 204 weight parameters from matrices W, U, and V, 3 learning rate parameters, and 2 parameters for Gaussian membership functions. The modeling process with FW-DNN learning for 10,000 iterations produces results as shown in Figure 4, with the model pattern adequately representing the patterns of tourist visitation data to West Nusa Tenggara Province. Based on the root of mean square error (RMSE) criteria, the performance of the FW-DNN model generated for in-sample data is 39,848.94, and for out-sample data is 5,223.86.
Figure 4. The number of international tourist visits to NTB from January 2014 to December 2020 using the FW-DNN model (blue dashed line) and actual data (red solid line)
4.5.3 The FW-DNN model for domestic tourist visits to NTB
Based on the time series data of domestic tourist visits to West Nusa Tenggara Province as shown in Figure 1, an autocorrelation analysis was conducted, and the results are as follows:
$f\left( {{x}_{t}} \right)=f\left( {{x}_{t-1}},{{x}_{t-2}},{{x}_{t-3}} \right)$
with $f\left(x_t\right)$ is the number of consecutive tourist visits at time $t$ and $f\left(x_{t-1}\right), f\left(x_{t-2}\right), f\left(x_{t-3}\right)$ respectively number of tourist visits at a specific time $(t-1),(t-2)$, and $(t-3)$.
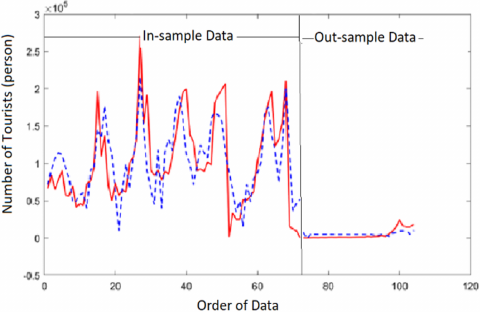
Modeling using the FW-DNN model proposed in this research involves a total of 209 parameters, including 204 weight parameters from matrices W, U, and V, 3 learning rate parameters, and 2 Gaussian membership function parameters. The modeling process with FW-DNN learning for 10,000 iterations produces results as shown in Figure 5, with the model pattern adequately representing the patterns of tourist visitation data to West Nusa Tenggara Province. Based on the root of mean square error (RMSE) criteria, the performance of the FW-DNN model generated for in-sample data is 71,855.35, and for out-sample data is 17,301.58.
Figure 5. The number of domestic tourist visits to NTB from January 2014 to December 2020 using the FW-DNN model (blue dashed line) and actual data (red solid line)
Table 2. Tourist visitation statistics for those who visited West Nusa Tenggara Province
|
Klasifikasi Data |
In-Sample Data |
Out-Sample Data |
|||||
|
Min |
Mean |
Max |
Min |
Mean |
Max |
||
|
Local Tourists |
Model of FWDNN Data |
-4120 |
113120 |
369110 |
79840 |
96320 |
120540 |
|
Actual Data |
18350 |
135170 |
352090 |
60180 |
102220 |
136130 |
|
|
|
Performance Model (RMSE) |
71855.35 |
17301.58 |
||||
|
|
|
|
|
||||
|
Foreign Tourists |
Model of FW-DNN Data |
9790 |
101970 |
215860 |
-520 |
5260 |
10220 |
|
Actual Data |
70 |
101230 |
271200 |
140 |
4420 |
2434 |
|
|
|
Performance Model (RMSE) |
39848.94 |
5223.86 |
||||
|
|
|
|
|
|
|
|
|
|
Aggregate Tourists |
FW-DNN Model Data |
23500 |
223500 |
432690 |
16830 |
91200 |
120290 |
|
Actual Data |
2610 |
227850 |
544240 |
18680 |
120290 |
154210 |
|
|
|
Performance Model (RMSE) |
95185.09 |
22615.54 |
||||
Statistically, the application of the FW-DNN model to tourist visitation data as a whole, domestic tourists, as well as international tourists visiting West Nusa Tenggara Province is presented in Table 2.
The results of our research are in line with and strengthen the results of research that has been conducted by several researchers. These researchers include Xu et al. [28] who showed that the combination of fuzzy inference with an artificial neural network model was able to increase the accuracy of the model in terms of classifying four types of objects resulting from the discrimination of reservoir water-flooded states based on physical quantity values such as resistivity, acoustic level, and radioactivity level in the oil layer. Likewise, research conducted by the study [29] shows that the fuzzy wavelet neural network (FWNN) method with a combination of PSO techniques and gradient descent optimization provides more efficient model performance results and has higher precision for short-term wind power forecasting. In addition, research by the study [30] combining artificial neural networks (ANN) and fuzzy logic resulted in efficient and significant model performance for estimating porosity in the petroleum industry. Finally, these results specifically strengthen the results of our previous research [5] that optimization of the wavelet neural network (WNN) model with TSK type fuzzy inference is able to improve the performance of the WNN model in case studies of several types of univariate time series data.
Tourist visitation data is one of the crucial pieces of information for planning and developing the tourism sector in a region, including in West Nusa Tenggara Province. The application of a combination of neural network models as the core model with wavelet and fuzzy inference methods as tools for optimizing the model, referred to as the FW-DNN Model in this research, can depict the patterns of tourist visitation data to NTB. This applies to both aggregated tourist visitation data and partial data concerning domestic and international tourists. Although the resulting data patterns may not be perfect, it is suspected that this is due to the influence of natural factors at the end of 2018 and the COVID-19 pandemic from the beginning of 2020 until the end of 2021.
Practically, the results of the FW-DNN model developed in this research can can be used to predict the number of tourists who will visit in the future. Therefore, the results of this research can contribute in the form of relevant information or data for the NTB Provincial Government in determining tourism management and/or development policies, especially regarding the provision of supporting facilities and infrastructure, or for the private sector in efforts to optimize carrying capacity or services for visiting tourists to NTB.
We would like to express our gratitude to the Rector of University of Mataram for providing funding for the research through the accelerated professor research scheme at the University of Mataram (Grant No.: 2572/UN18.L1/PP/2023).
[1] KEMENPAREKRAF. (2022). Berkenalan dengan 5 destinasi super prioritas Indonesia. www://info5dsp.kemenparekraf.go.id, accessed on Jan. 24, 2022.
[2] Dinas Pariwisata NTB. (2022). Dinas pariwisata. https://data.ntbprov.go.id/group/dinas-pariwisata, accessed on Feb. 05, 2022.
[3] Bahri, S. (2017). Desain dan evaluasi performa model wavelet neural network untuk pemodelan. Ph.D. Dissertation, Gadjah Mada University Indonesia.
[4] Bahri, S., Widodo, Subanar. (2016). Applied multiresolution B-spline wavelet to neural network model and its application to predict some economics data. IJAMAS, 54 (1): 92-103.
[5] Bahri, S., Widodo, Subanar. (2016). Optimization of wavelet neural networks model by setting the weighted value of output through fuzzy rules Takagi-Sugeno-Kang (TSK) type as a fixed parameter. Global Journal of Pure and Applied Mathematics, 12(3): 2591-2603.
[6] Bahri, S. (2020). Modeling of solar radiation using the wavelet neural network model in mataram city lombok Island. Lontar Komputer : Jurnal Ilmiah Teknologi Informasi, 11(3): 178. https://doi.org/10.24843/LKJITI.2020.v11.i03.p06
[7] Bahri, S., Alfian, M.R., Fitriyani, N. (2022). Dynamic neural network model design for solar radiation forecast. Lontar Komputer: Jurnal Ilmiah Teknologi Informasi, 13(2): 96-104. https://doi.org/10.24843/LKJITI.2022.v13.i02.p03.
[8] Banakar, A., Azeem, M.F. (2008). Artificial wavelet neuro-fuzzy model based on parallel wavelet network and neural network. Soft Comput, 12(8): 789-808. https://doi.org/10.1007/s00500-007-0238-z
[9] Abdullah, Z., Kasmuri, N.H. (2013). Comparison of static and dynamic neural network model in predicting outlet temperature of shell and tube heat exchanger plant. International Colloquium on Signal Processing and Its Applications, Kuala Lumpur, Malaysia, pp. 7-10. https://doi.org/10.1109/CSPA.2013.6530004
[10] Hussain, A.J., Liatsis, P., Khalaf, M., Tawfik, H., Al-Asker, H. (2018). A dynamic neural network architecture with immunology inspired optimization for weather data forecasting. Big Data Research, 14: 81-92. https://doi.org/10.1016/j.bdr.2018.04.002
[11] Li, X., Law, R., Xie, G., Wang, S. (2021). Review of tourism forecasting research with internet data. Tourism Management, 83: 104245. https://doi.org/10.1016/j.tourman.2020.104245
[12] Park, E., Park, J., Hu, M. (2021). Tourism demand forecasting with online news data mining. Annals of Tourism Research, 90: 103273. https://doi.org/10.1016/j.annals.2021.103273
[13] Bi, J.W., Li, H., Fan, Z.P. (2021). Tourism demand forecasting with time series imaging: A deep learning model. Annals of Tourism Research, 90: 103255. https://doi.org/10.1016/j.annals.2021.103255
[14] Xie, G., Qian, Y., Wang, S. (2021). Forecasting Chinese cruise tourism demand with big data: An optimized machine learning approach. Tourism Management, 82: 104208. https://doi.org/10.1016/j.tourman.2020.104208
[15] Akın, M. (2015). A novel approach to model selection in tourism demand modeling. Tourism Management, 48: 64-72. https://doi.org/10.1016/j.tourman.2014.11.004
[16] Santamaria, D., Filis, G. (2019). Tourism demand and economic growth in Spain: New insights based on the yield curve. Tourism Management, 75: 447-459. https://doi.org/10.1016/j.tourman.2019.06.008
[17] Siahaan, T.R., Santoso, R., Prahutama, A. (2020). Peramalan jumlah kunjungan wisatawan mancanegara di kepulauan riau dengan menggunakan model fungsi transfer. Jurnal Gaussian, 9(2): 152-161. https://doi.org/10.14710/j.gauss.9.2.152-161
[18] Susila, M.R. (2021). Pemodelan multivariate kunjungan wisatawan mancanegara ke indonesia melalui pintu udara, laut, dan darat yang melibatkan dampak wabah COVID-19. Barekeng: Jurnal Ilmu Matematika Dan Terapan, 15(3): 467-478. https://doi.org/10.30598/barekengvol15iss3pp467-478
[19] Julianto, I.R., Indwiarti, I., Rohmawati, A.A. (2021). Prediksi jumlah kunjungan wisatawan di jawa barat dengan model ARIMAX dan SARIMAX menggunakan data google trends. eProceedings of Engineering, 8(4).
[20] Lakuhati, J.R., Paulus, A.P., Pakasi, C.B.D. (2018). Faktor-Faktor yang mempengaruhi kunjungan wisatawan ke kawasan ekowisata di desabahoi kecamatan likupang barat kabupaten minahasa utara. Agri-SosioEkonomi Unsrat, 14(1): 215-222. https://doi.org/10.35791/agrsosek.14.1.2018.19268
[21] Kencana, E.N., Darmayanti, T. (2016). Analisis struktural model kunjungan ulang wisatawan ke Kabupaten Badung. In Prosiding Seminar Nasional Saintek 2016-Bali-19 November 2016, pp. 1-10.
[22] Suk, H.I. (2017). An introduction to neural networks and deep learning. In Deep Learning for Medical Image Analysis. Academic Press, pp. 3-24. https://doi.org/10.1016/B978-0-12-810408-8.00002-X
[23] Walker, J.S. (2008). A primer on wavelets and their scientific applications. Chapman and hall/CRC. Journal of the American Statistical Association, 95: 1008. https://doi.org/10.1201/9781584887461
[24] Hooda, D.S., Raich, V. (2017). Fuzzy Logic and Fuzzy Control, An Introduction. Oxford, U.K.: Alpha Science International, Ltd.
[25] Debnath, L., Shah, F.A. (2015). Wavelet transforms and their applications, second edition. New York: Birkhauser. https://doi.org/10.1007/978-0-8176-8418-1.
[26] Mehra, M., Mehra, V.K., Ahmad, V.K. (2018). Wavelets theory and its applications. Springer Singapore. https://doi.org/10.1007/978-1-4615-3584-3.
[27] Unser, M.A. (1997). Ten good reasons for using spline wavelets. In Wavelet Applications in Signal and Image Processing V. SPIE, 3169: 422-431. https://doi.org/10.1117/12.292801
[28] Xu, S., Feng, N., Liu, K., Liang, Y., Liu, X. (2021). A weighted fuzzy process neural network model and its application in mixed-process signal classification. Expert Systems with Applications, 172: 114642. https://doi.org/10.1016/j.eswa.2021.114642
[29] Ghoushchi, S.J., Manjili, S., Mardani, A., Saraji, M.K. (2021). An extended new approach for forecasting short-term wind power using modified fuzzy wavelet neural network: A case study in wind power plant. Energy, 223: 120052. https://doi.org/10.1016/j.energy.2021.120052
[30] Li, X., Wang, B., Hu, Q., Yapanto, L.M., Zekiy, A.O. (2021). Application of artificial neural networks and fuzzy logics to estimate porosity for Asmari formation. Energy Reports, 7: 3090-3098. https://doi.org/10.1016/j.egyr.2021.05.034