Ritu Agarwal*![]() | Tanupriya Choudhury
| Tanupriya Choudhury![]() | Neelu J. Ahuja
| Neelu J. Ahuja![]() | Tanmay Sarkar
| Tanmay Sarkar![]()
© 2023 IIETA. This article is published by IIETA and is licensed under the CC BY 4.0 license (http://creativecommons.org/licenses/by/4.0/).
OPEN ACCESS
India is widely recognized for its wealthy heritage, subculture and myriad Indian cuisines. Indian Cuisines are famous around the globe for their taste and flavors. Indian Cuisines detection using computer vision-based methods has been limited till now because of the absence of a standard dataset needed to inspect the deep learning-based object detection models for detecting Indian Food Cuisine using electronic devices. Measuring food quantities in each item are very challenging tasks for a person. In this study the dataset IndianFoodNet has been introduced, containing more than 5500 high-quality images and 5000+ annotations spreading across thirty classes of Indian food items. A comparative study of various state-of-the-art object detection models- YOLO5, YOLO7 and YOLO8 has been provided in the study. Further, the model performance has been inspected and evaluated (As in training summary of YOLO at 5 epochs YOLO8 precision is 0.775 higher than precision of YOLO7 and YOLO5.Recall value of YOLO7 is least in comparison with YOLO5 having value 0.671 and YOLO8 having recall value 0.719) by qualitatively analyzing the prognostic made on the images of the dataset which are segregate for testing.
computer vision, YOLO5, YOLO7, YOLO8
Tracking your daily food intake is the first step in promoting good health. Counting calories is helpful for tracking nutrient scores. A computerized system helps users accurately calculate food types and serving sizes. Computerized systems have many advantages over traditional methods. Machine learning has fulfilled its potential in various fields and this research work has brought machine learning capabilities into the field of food informatics. Automated nutritional assessment starts with food classification.
Obesity can raise other serious chronic disease, diabetes. A sort of study shows 55.5% lifetime risk for men over age 20 Diabetes, while the lifetime risk for women is 64.6% [1-3]. Therefore, improper food intake is generally considered to be the main causes of numerous human diseases. In today's world it is very necessary to eat diet which is required for a person. The exact calorie intake we eat every day is very helpful for us to live a healthy life. Citizens are also beginning to track their daily calorie consumption.
Start tracking our daily consumption of calorie seamlessly. The generation's sudden trend toward healthy eating habits has calls out the need to create more accurate, easier traceability. The calories in the food we eat every day, need a tool that does more than just identify food extremely accurate, but should also be able to count calories exactly in this food [4-6]. It is for this purpose everyone has a handheld device that works. This Research efforts focus on computer intervention performance of our smartphones which can recognize food and count calories with extreme perfection using models of machine learning.
In YOLO, regression problem is realized by object detection, which provides the probabilities associated with each detected object. Convolutional neural networks (CNNs) in the YOLO algorithm are used to achieved real time object detection. The algorithm only requires a single or one forward propagation to detect object through a neural network [7]. An image is predicted as a whole using a single algorithm run. Using CNNs, multiple classes of probability and bounding boxes can be predicted simultaneously. As chunk of the YOLO algorithm, a variety of version are available, such as the tiny YOLO and the YOLOv3.
The significant involvement in this paper are as follows:
The IndianFoodNet Dataset has been designed, which contains more than 55,00 high-quality images and has 15000+ annotations spreading across various Indian food items.
The authors have presented the comparative study of various state-of-the-art object detection models for YOLO5, YOLO7 and YOLO8.
We have inspected and evaluated the model performance by qualitatively analyzing the predictions made on the images of the training and test dataset.
We will realize the performance of YOLO5 and YOLO8 are better than YOLO7 and on the basis of performance we identify which object detection technique to be used for calorie estimation.
The other sections of this paper are divided as Section 2 contains preliminaries; Section 3 introduces literature review about existing dataset for Indian food as well as various object detection techniques. Section 4 defines purpose of study; Section 5 explains methodology for creating dataset and detailed study of YOLO variants. Section 6 specify model performance on our test dataset and Section 7 includes conclusion and future scope and paper concludes with references.
As we make the latest improvements in item detection in deep learning study to construct a device to enter photograph and discover the appearance of a piece of a meal item. I would like to discuss the concept of object detection and deep learning.
2.1 A basic neural network
Convolutional Neural Networks (CNNs) have proven to be highly effective in various computer vision tasks, including object detection. When applied to object detection of food, CNNs can automatically learn hierarchical features from food images and identify different food items within the images. Here's an overview of how CNNs are typically used for object detection of food as Input Layer to the CNN is an image containing one or more food items [8]. Images are typically represented as matrices of pixel values, with each channel corresponding to a color (e.g., red, green, blue). Convolutional layers are the core building blocks of CNNs. These layers apply a set of learnable filters (kernels) to small, overlapping regions of the input image, capturing local patterns and features. As the network deepens, convolutional layers can capture increasingly complex and abstract features. In Activation layer, Non-linear activation functions (e.g., ReLU - Rectified Linear Unit) are applied after convolutional operations to introduce non-linearity into the model, enabling it to learn more complex relationships in the data [9-13]. Pooling layers (e.g., max pooling) are used to down sample the spatial dimensions of the feature maps, reducing computational complexity and focusing on the most important features. In Fully Connected Layers [14], following the convolutional and pooling layers, fully connected layers are used to connect all the features from the previous layers. These layers are often responsible for combining learned features to make final predictions. For object detection, additional fully connected layers are typically added to predict bounding box coordinates and class probabilities. The output layer of the CNN produces predictions for each detected object. For food object detection, this involves predicting the bounding boxes (coordinates) of food items and the corresponding class probabilities. The loss function is used to quantify the difference between the predicted outputs and the ground truth annotations (bounding boxes and class labels). Common loss functions for object detection include a combination of localization loss (e.g., smooth L1 loss) and classification loss (e.g., softmax or sigmoid cross-entropy [15-17]. The CNN is trained using a labelled dataset of food images. During training, the model adjusts its parameters to minimize the chosen loss function, learning to accurately predict bounding boxes and class labels. The trained model is evaluated on a separate test dataset to assess its performance. Common evaluation metrics for object detection include precision, recall, and Intersection over Union (IOU) [18-20]. Once trained and evaluated, the CNN can be used for inference on new, unseen images, detecting and classifying food objects in real-world scenarios.
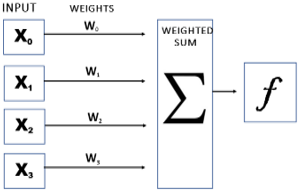
The basic computation of a neural network is demonstrated in Figure 1. A feature vector consists of the inputs x1, x2, ... xn into the network [21]. For computer vision tasks such as detecting objects and classifying images, the intensity of raw pixels in an image is represented by this vector. A bias of constant 1 is added to the input [22-25]. The next neuron is connected to these inputs. Input values are associated with weight values w1, w2, ... wn in a weight vector w. To determine whether the neuron is active, input vector is performed for the weighted sum, followed by a function that determines whether the neuron is active. Among the most commonly used deep learning activation methods or functions are the ReLU, the sigmoid, the tanh, and the LeakyReLU.
Among all neural network architectures, feedforward is one of the most prevalent and widely used. Each layer's output is fed into the subsequent layer's nodes. Only progressive connections are included in this architecture, which gives it the nickname "feedforward" [26]. An example of a feedforward neural network may be found in Figure 2. The input layer, or layer 0, holds the vector that is supplied into the network. The two buried layers, layers 1 and 2, respectively, hold 2 and 3 nodes. The basic computation is followed by the calculus between the inputs or the output of any layer and the node in the following layer [27-30].
A network in which each layer carries out a specific purpose is known as a feedforward neural network. In our example, neural network executes a method or function called f(x) that is made up of three separate functions, f1, f2, and f3, which are linked together in a chain, as f(x)=f3 (f2 (f1(x))). In this defined case, the network's input is x, the first layer's computation is represented by f1, the second layer's computation by f2, and the third layer's computation by f3 [31-34]. The depth of the model architecture can be increased by adding further layers, or additional functions in the computing chain, based on the situation at hand. This idea of depth in computation is reflected in the term "deep learning".
Figure 1. A basic computation of neural network
Each input x during training is connected to a label y=f(x). The objective is to learn the weights in a network using a training technique to get f(x) as near to f as depends on (x). The result produces by output layer matches the intended y as a result. For each instance, the network of output layer aims to categorized photographs of handwritten digits will have exactly ten nodes [35-40]. Each label of a node will communicate the possible output associated with digits from 0 to 9. A picture will be displayed to the network during training, and the node in the output layer will produce a higher value than the other nodes.
2.2 Convolutional neural network
The Convolutional Neural Network, or CNN is commonly known, in computer vision as one of the massed extensively used network topologies. This relies heavily on the convolution operation. The representation of matrix as the input image pixels is crossed by a filter, also referred to as a predetermined kernel. The kernel value is then multiplied and added to the input characteristics to get the output [41]. Thus, a number of these convolutional layers make up the CNN architecture. Here, the result of the convolution process from the preceding layer serves as an input for the next layer. The feature maps produced by these filters or kernels include twain high-level features and low-level features retrieved from an image [42]. The given computer vision job is then systematically carried out using the feature representations.
For some non-linearity, activation functions are added in between the convolutional layers. This is a result of the convolution operation's inherent linearity. TanH, ReLu, and sigmoid are a few instances of more well-known activation functions (that are employed in CNNs). Furthermore, a pooling operation is also relevant here in addition to these well-known functions [43, 44]. This is so that the representations' spatial size can be reduced via the pooling operation. The operation will essentially produce a summary of the values in a neighborhood before replacing this summary with a single value.
The most popular pooling method used to reduce the spatial size of representations is probably max pooling. As it only accepts the largest output from a collection of neighboring values, this constrains the values. There are numerous convolutional layers that extract characteristics from the food image using pooling techniques and the ReLU activation function. A neural network creates the penultimate predictions using the obtained featured representation.
2.3 Object detection in deep learning
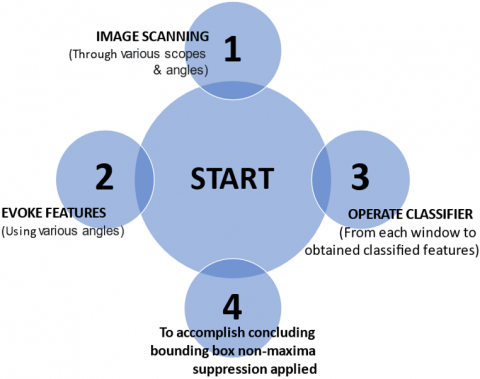
Object detection in computer vision is a familiar issue which concentrates on recognizing and detecting an image or object to a specific class or category (e.g., food, bus, tables) from captured images or videos. Few distinguished applications which are using object detection includes counting of objects like cars; face or retina detection; and detection of boards of road signs for traffic rules, pedestrian, etc. The issue arose for object detection raise to the occurrence of concept computer vision. It is a vital integrant of image comprehension. Various algorithms and methods were proposed to handle this problem before the concept of deep learning based on neural network come to picture. Out of already existing conventional methods and algorithms for object detection HOG +Linear SVM and Haar cascades stick out for the reason of their adequate detection speed and their performance to identify objects. Out of these above methods, two important subcomponents are identified as:
(a) Image pyramid—Images can be classified using image classifiers that recognize objects at various scales and locations. An input image was continuously squeezed in proportions, that if they were piled together, they would create a pyramid. In every image, the window which slides seek to identify the existence of a recognized object.
(b) Sliding windows—Sliding windows play a vital role in classification of object, as they allow to localize exactly “where” an object found in an image. A sliding window image examines the object from left to right and top to bottom, making classifications at every pixel across the entire window.
After demonstrating above components, there is maximum possibility to report various detections in image of a solitary object. A non-maximum suppression (NMS) can be characterized as a method that keeps one detection of an object with the highest level of confidence. The elementary tramp of conventional object detection is encapsulated in Figure 2.
Figure 2. Elementary steps of conventional object detection
Additionally, plan to use methods of deep learning to detect objects in this work. The basis of machine learning is artificial neural networks, which are part of deep learning. The human body's neurons inspire the development of these networks. Multiple layers of "neuron" units comprise a neural network, with each neuron performing a simple arithmetic operation [45]. When training of model is on a large dataset, it could learn recognizable patterns. This is different from how conventional models learn recognizable patterns.
2.4 The YOLO framework
The YOLO or You Only Live Once framework is a very famous object detection framework of one-stage. With object detection methods of two-stage, the detector first concentrates on the areas of interest before classifying them. This is not the case with YOLO. But YOLO incorporates both local suggestions and detection. It acts on a closely-packed sampling of all the locations that could become possibilities. Because of this, the YOLO framework works at a faster speed than the other two-stage methods. To conclude, its detector can proceed with the interference much faster.
2.4.1 YOLO framework—The workflow
The CNN architecture is trained in the past for the particular classification or categorization task at hand. S × S grid cells are used to neatly split the input image. These are all beneficial in the search for the one object whose center falls within a specific grid.
The forecast includes B-bounding boxes and each bounding box's confidence score. Additionally, K conditional class attributes are predicted by the grid cells referring to the probability of a class-given object.
2.4.2 Bounding box
Bounding box of each image is indicated by the letters w, h, x, and y. While (w, h) designates the width and height, (x, y) refers to the grid cell in relation to object's center coordinates. Therefore, width and height are in relation with entire image.
2.4.3 The given confidence score
As implied by the name, it deals with how certain the model is and the bounding box actually containing an object. Score is denoted by the symbol Pr (object) x IoU (pred, truth). The first makes reference to an object's probability, while the second shows where the predicted box and the real world connect.
2.4.4 The conditional class probabilities
When a cell includes an object, it indicates the likelihood that that specific object falls under each of the K class names. The model can only make one set of predictions, regardless of the bounding box numbers. Each cell in this set includes K probabilities.
The output tensor that the model produced has the following dimensions:
S×S×(5B+K)
2.4.5 The loss function
The YOLO's purpose is to motivate the model to speculate accurate bounding box coordinates. After that, it would need to compare the expected conditional class prospect with the existing one.
The loss function of YOLO can be further divided into the following categories:
(a) Classification loss (for conditional class properties);
(b) Localization loss (for getting the accuracy of bounding box coordinate predictions).
2.4.6 YOLOv5
Glenn Jocher's YOLOv5 isn't a direct descendent of Darknet. This YOLO was written in Python and implementation is performed using the PyTorch framework. YOLOv5 has a similar structural basis to YOLOv4. Components:
The system's input is the initial data.
The system's learning neural network is its backbone. CSP networks are key to YOLOv5.
Third, the neck makes feature pyramids. Before being sent for prediction, the image passes through a sequence of layers that mix its characteristics. PANet underpins YOLOv5.
"Head" utilises "neck" data to make "box" and "class" predictions. Two-stage heads are utilised for sparse prediction. YOLOv5's head is similar to YOLOv3 and YOLOv4.
YOLOv5 segments images using a single neural network. Automatically assigning each component an anchor box improves accuracy. Automatic recalculation occurs if the predefined anchor boxes are incorrect. The system analyses and predicts the result in separate containers.
2.4.7 YOLOv7
In computer vision tasks, YOLOv7 is the fastest and most accurate model for real-time object detection. The YOLOv7 paper officially named “YOLOv7: Trainable bag-of-freebies sets new state-of-the-art for real-time object detectors” was released by Chien-Yao Wang, Hong-Yuan Mark Liao and Alexey Bochkovskiy, in July 2022. The research paper has become immensely popular in a matter of days of YOLOv7. The YOLOv7 is integrated with Blend Mask which is used to perform instance segmentation. It increases the accuracy without hike in inference cost in case of object detection. The architecture includes E-ELAN (Extended Efficient Layer Aggregation Network) and Concatenation based models used for model Scaling.
After identifying a gap in the current research, this literature review was conducted on the basis of various object detection and recognition models through various techniques as defined in Table 1.
After literature review, it has been found that there are several deep learning methods and architectures that can be employed for object detection of food items. Object detection aims to locate and classify objects within an image by Faster R-CNN, YOLO, SSD, RetinaNet and EfficientDet. After findings of various methods author take YOLO to be used in methodology for object detection accurately. In methodology, authors have evaluated the result of own created dataset on YOLO variants and on basis of performance will come to conclusion. While creating dataset of own, we must first review about existing dataset which are mainly based on Italian, Spanish and Japanese food. So, our primary goal is to create our own Indian dataset which is primarily created on small classes as Indian food 7. Already existing dataset based on Indian food are summarized in following Table 2.
Table 1. Literature review for object detection
|
S. No |
Findings |
Outcomes of Interest |
Author |
|
1 |
Food recognition and classification based on CNN based model |
Quality detection of fruits and vegetables and calorie estimation |
Zhou et.al. [46], 2019 |
|
2 |
Segmentation and extraction |
Image based calorie estimation |
Okamoto and Yanai [47], 2016; |
|
3 |
Deep CNN |
Automatic recognition process |
Latif et.al. [48], 2020 |
|
4 |
Support Vector Machine (SVM) |
Volume estimation |
Kashyap and Jayapandian [49], 2021 |
|
5 |
Segmentation named graph cut with deep learning in neural network |
Finger based calorie evaluation using distance measurement |
Pouladzadeh et.al. [50], 2016 |
|
6 |
Image acquisition & pre-processing with Image segmentation and calorie estimation |
calculated the calories of food item using machine learning and image processing |
Dhanalakshmi et.al. [51], 2020 |
|
7 |
Training phase and testing phase |
Resizing, extraction, segmentation, classification, gabor filter method, multilayer perceptron, color histogram |
Kumar et.al. [52], 2021 |
|
8 |
Data pre-processing |
Feature extraction technique: Inception V3 |
Ayon et.al. [53], 2021 |
|
9 |
Multi-task CNNs |
Construction of calorie-annotated food photo dataset |
Ege et.al. [54], 2018 |
|
10 |
Pre-trained model selection |
Word2Vec a machine learning tool |
Shen et.al. [55], 2019 |
|
11 |
Object detection |
Training model for fruit Detection |
Chaudhari et.al. [56], 2019 |
|
12 |
AI and computer vision in the field of food industry and agriculture. |
AI based food processing strategies |
Kakani et.al. [57], 2020 |
|
13 |
Freshness of food |
Quality of food |
Korobova et.al. [58], 2021 |
|
14 |
AI applications in food industry |
AI algorithms |
Kumar et.al. [59], 2021 |
|
16 |
K fold cross validation in artificial neural network |
Food authentication |
Hategan et.al. [60], 2021 |
|
17 |
Optimized production in AI and machine learning |
NA |
Chidinma-Mary-Agbai [61], 2020 |
|
18 |
Fuzzy logic |
Sensory analysis |
Sarkar et.al. [62], 2020 |
Table 2. Review of food dataset available online
|
S. No |
Dataset |
Year |
No. of Classes |
No. of Images |
Merits |
Demerits |
Reference |
|
1 |
UNICT-FD889 |
2014 |
889 |
3583 |
Images are captured by smartphones with flash light and night mode and in augmented manner. The objective is to recognise images. |
As demand of today scenario, images must increase in this dataset. |
Giovanni Maria Farinella [63], 2014 |
|
2 |
Food101 |
2022 |
101 |
101000 |
It’s a huge dataset for testing techniques of computer vision. |
Images having load of noise. |
Kuhad [64], 2015 |
|
3 |
Food-11 |
2016 |
11 |
16643 |
Each class of food is kept in different directory so training process of model is timelier. |
Dataset is already divided into three columns as validation, testing and training. |
Antonov [65], 2019 |
|
4 |
food20 |
2021 |
20 |
2000 |
It consists of most consumable Indian food. It is having 100 sample images for each class. |
Its subject to deformations and irregular illustrations. |
Batman [66], 2020 |
|
5 |
Indian food 101 |
2021 |
255 |
It consists of different dishes, native places and ingredients added. |
Images not defined. |
Prabhavalkar [67], 2020 |
|
|
6 |
6000+ Indian Food Recipes Dataset |
2020 |
6000+ |
It contains recipes of food belong with ingredients, size and required time for preparation. |
Classes not defined. |
Kanishka [68], 2020 |
|
|
7 |
Indian Food Images Dataset |
2021 |
80 |
4000 |
It contains varieties of food from various countries introduced in Indian food. |
NA |
Banerjee [69], 2022 |
The study concentrates on the application of object detection algorithm specifically on India food items. As identified in the literature review (section 3) it has been analyzed that the existing dataset lacks Indian food images from different parts of the country. The purpose of this study is to curate dataset (Name of the dataset created for this study: IndianFoodNet) for different Indian food for thirty different classes (food items) which are consumed on daily basis from different regions. Further the evaluation of appropriate object detection algorithm on the prepared data set has been presented. The different variants of YOLO model have been applied on the dataset to find its efficiency. A comparative analysis of all the variants of YOLO (YOLO5, YOLO7, YOLO8) has been provided in the study. In future, with the help of analysis of different variants, we can process the work to estimate calorie of food. A range of performance metrics are used to assess object detection models, such as accuracy, recall, F1 score, and average mean accuracy.
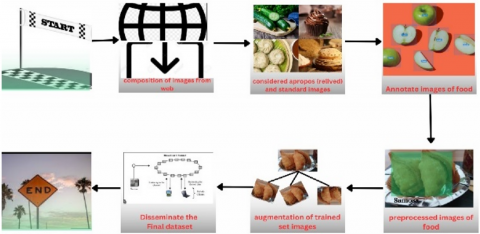
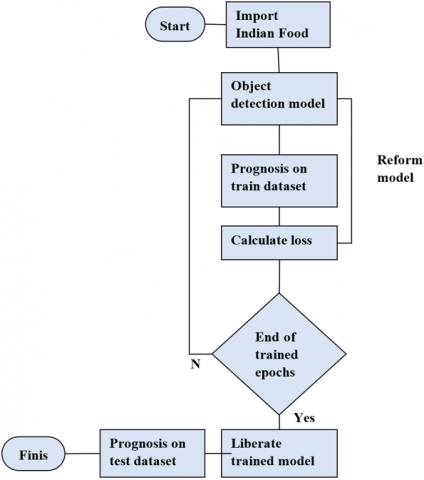
This section explains the process involved in the preparation of dataset. The basic approach of work flow of dataset preparation used is presented in Figure 3 and Figure 4. The figures demonstrate the splitting of dataset preparation process into two stages:
·The process of preparing the dataset.
·Object detection model training.
Figure 3. Flow of dataset preparation
Figure 4. Flow of approach
5.1 Dataset description
All relevant food images were gathered in the earlier stage from the web using Google and Bing. Then, bounding boxes around the measurements of the food items were added to them. The food products would then be ready for object detection training.
Creating a model architecture was done in the second or final step [70]. At this point, the hyperparameters (such as learning rate, batch size, and the number of epochs, are also set during this phase) had been set and the pertinent loss function and optimizers had been developed. All of these made it possible for the model to predict outcomes on the training set. It would update itself in accordance with the requirement (During training, the model makes predictions on the training set, and the optimizer adjusts the model's parameters (weights and biases) to minimize the chosen loss function.), minimizing the losing value (Backpropagation calculates the gradient of the loss with respect to each model parameter, allowing the optimizer to adjust the parameters in the opposite direction of the gradient, effectively minimizing the loss). After completing this allocated training, the model could infer conclusions about the test set itself. It demonstrated the trained model's effectiveness on data that had not previously been seen.
The dataset named IndianfoodNet has been modeled for the work; it comprises images of food items that may result in object detection for food. It also consists of the annotation box (or boxes) per image which allows one to precisely locate the food item's position. We prepare a list of famous Indian food items. Then based on list, we collect Indian food images of the different classes for the preparation of the dataset. After that annotate the bounding boxes region to locate an arrangement of every image of the specified items of food. Then, our dataset, IndianFoodNet, constitutes of more than 5500 images of spreading beyond thirty classes of popular Indian food items. Besides, each image in the dataset is resized to 640×640.
Here are how the food items were shortlisted:
(a) Food items consisting of various Indian places around as Eastern, western, northern and south dishes that are mentioned explicitly under the Table 3.
(b) Food items that can be distinguished based on their visual appearances (this is because of the major dependency on computer vision methods - the methods were used to identify the appearance of food items in any given picture). This is the most important factor based on which the food items were shortlisted.
(c) Lastly, food items that are commonly consumed regularly.
Table 3. List of few dataset classes created
|
S. No |
Food Class Name |
S. No |
Food Class Name |
|
1 |
Aloo Gobi |
16 |
Jalebi |
|
2 |
Aloo Masala |
17 |
Kabeb |
|
3 |
Bhatura |
18 |
Kheer |
|
4 |
Bhindi Masala |
19 |
Kulfi |
|
5 |
Biryani |
20 |
Lassi |
|
6 |
Chai |
21 |
Mutton Curry |
|
7 |
Coconut Chutney |
22 |
Onion Pakoda |
|
8 |
Dal |
23 |
Palak Paneer |
|
9 |
Dosa |
24 |
Poha |
|
10 |
Dum Aloo |
25 |
Rajma Curry |
|
11 |
Fish Curry |
26 |
Ras Malai |
|
12 |
Ghevar |
27 |
Samosa |
|
13 |
Green Chutney |
28 |
Shahi Paneer |
|
14 |
Gulab Jamun |
29 |
White Rice |
|
15 |
Idli |
30 |
Cheela |
5.1.1 Collection
Google and Bing were used for crawling. These provided the requisite suitable images by means of JavaScript queries. Any image with an incomplete RGV channels were subject to removal. These were detected by use of image hashing and removed from the dataset.
After combing the search engines, several images were found that were not relevant or obsolete to the aim of this research. Many of these images had texts on them. All the images went through a final evaluation before the annotation process began to maintain the relevance to the required set of data.
5.1.2 Annotation
Post collection, all the images were annotated on the online Roboflow platform. Their self-serve annotation tool allowed for this to happen. It also enabled the entire dataset's annotation without the need for any externally downloaded program.
The model assists labelling tool from Roboflow was incredibly helpful in accelerating the entire annotation process. It grants a model to train another model using a portion of the data which was annotated. Automation was the result of this. As new photographs are added to the dataset, the trained model will automatically add annotations.
As a result, the annotations underwent thorough hand tests to ensure their accuracy and quality. The following link can be used to download the dataset and to gather more information regarding the number of annotations per label (https://universe.roboflow.com/indianfoodnet/indianfoodnet).
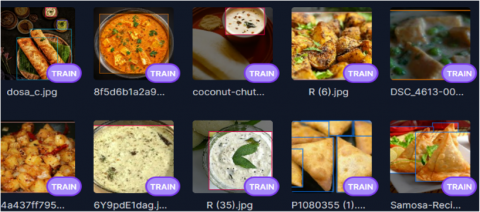
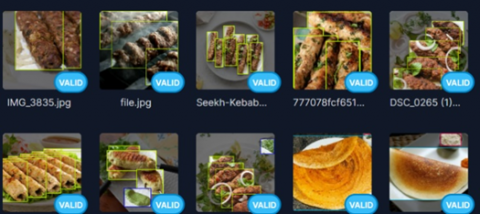
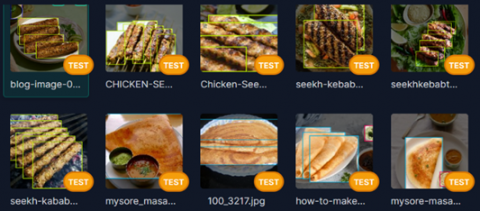
When the models are being trained, they train on the train set and evaluate themselves on the validation set. During the training phase, the best model is stored, from which inferences can be drawn on the test set. Figure 5, Figure 6 and Figure 7 are samples of trained images, valid images and test images respectively.
A range of performance metrics are used to assess object detection models, such as accuracy, recall, F1 score, and average mean accuracy. The non-maximal attenuation (NMS) is also determined by this inference rate. The above metric evaluation equations are as follows:
$Precision =\frac{ { True\, Positive }}{{ Ture \,Positive }+ { False \,Positive }}$
$Recall =\frac{ { True \,Positive }}{ { Ture \,Positive }+ { False \,Negative }}$
$\mathrm{mAP}=\frac{1}{N}+\sum_{i=1}^N A P_i$
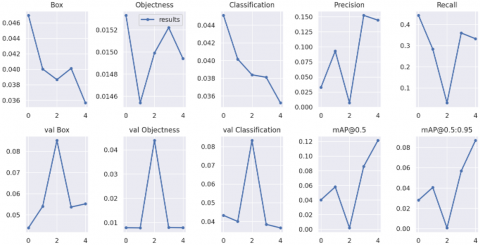
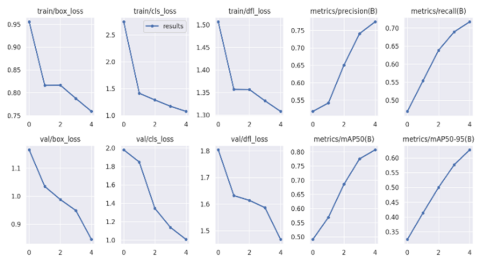
We evaluate precision, recall, and mean average precision (mAP) over five training epochs for YOLO models in the evaluation metrics section. Based on the validation set, the bounding box regression loss decreases as the training progresses. In contrast, precision, recall, and mean accuracies improved over the training period, which indicates the model learns to make better predictions. For all models, this trend is evident in the training summary. The dataset is further partitioned once the photos have been annotated as a train-shaped dataset (70%), the validation portion of the dataset (20%) separated into a test set (10%) from the dataset. In Figure 5, Figure 6 and Figure 7 sample of images from IndianfoodNet are captured for reference.
Figure 5. Sample of trained images from IndianFoodNet dataset
Figure 6. Sample of valid images from IndianFoodNet dataset
Figure 7. Sample of test images from IndianFoodNet dataset
Additionally, it made the images more mobile because they could now be turned at random in the clockwise, anti-clockwise, and upside-down directions at a right angle.
The model is made possible by the augmenting, which gives it a wider range of example images. As a result, it is both robust and generalizable. During the training period, the augmented samples were created concurrently with the offline augmentation. The model's capacity to be replicated improved as a result. Costs and training time were reduced at the same time.
5.2 Influence of the dataset
During the analysis, it was found that the IndianFoodNet is one of the very first research attempts that use the present system of deep learning having computer vision. Furthermore, there is no need to feed excessively large quantities of food images to the model. The training time is short as compared to other models. There is more specificity in the focus of the problem. Simultaneously, this also leaves room for research in the field of deep learning (computer vision) as visual inputs related to food items are quite difficult.
The results of different variants of YOLO as v5, v7, and v8 are described in Table 4, Table 5 and Table 6 respectively.
Based on the custom-built dataset that we developed, we employ YOLO variants and Faster R-CNN training algorithms for training a model that detects food detection performances. Different variants of the YOLO were developed, and each variant produces a different level of detection accuracy and performance. Our comparison focuses on the YOLO5 and YOLO7 variants of YOLO, as Faster R-CNN is more effective in segmentation, not object detection, within YOLO. Our testing and training are conducted using the GoogleColab Notebook available at Roboflow's model (https://universe.roboflow.com/indianfoodnet/indianfoodnet). Notebooks derived from the original repository associated with YOLO variants are included.
A model of training that draws the best inferences about the test set is used. A number of performance metrics are used to determine performance, including accuracy, recall, mAP50 and mAP more than 50, and inference speed (in ms). Table 5 shows YOLO5 performance on the basis of precision, recall and Map Reduce at 5 epocs.
Table 4. Performance of YOLO5 for Precision, Recall and MapReduce
|
Class |
Images |
P |
R |
mAP50 |
mAP 50-95 |
|
AlooGobi |
40 |
0.479 |
0.575 |
0.544 |
0.449 |
|
AlooMasala |
39 |
0.662 |
0.602 |
0.708 |
0.59 |
|
Bhatura |
87 |
0.701 |
0.862 |
0.905 |
0.701 |
|
BhindiMasala |
45 |
0.613 |
0.8 |
0.779 |
0.638 |
|
Biryani |
45 |
0.446 |
0.778 |
0.617 |
0.523 |
|
Chai |
60 |
0.65 |
0.75 |
0.75 |
0.444 |
|
Chole |
72 |
0.577 |
0.889 |
0.83 |
0.647 |
|
CoconutChutney |
57 |
0.442 |
0.791 |
0.631 |
0.457 |
|
Dal |
45 |
0.534 |
0.556 |
0.398 |
0.33 |
|
Dosa |
75 |
0.757 |
0.56 |
0.639 |
0.385 |
|
DumAloo |
44 |
0.335 |
0.25 |
0.316 |
0.269 |
|
FishCurry |
41 |
0.32 |
0.244 |
0.29 |
0.242 |
|
Ghevar |
48 |
0.575 |
0.625 |
0.631 |
0.498 |
|
GreenChutney |
66 |
0.787 |
0.617 |
0.724 |
0.494 |
|
GulabJamun |
97 |
0.525 |
0.918 |
0.885 |
0.622 |
|
Idli |
87 |
0.622 |
0.977 |
0.931 |
0.696 |
|
Jalebi |
39 |
0.932 |
0.923 |
0.959 |
0.692 |
|
Kebab |
89 |
0.493 |
0.742 |
0.673 |
0.35 |
|
Kheer |
50 |
0.5 |
0.501 |
0.495 |
0.371 |
|
Kulfi |
69 |
0.71 |
0.739 |
0.789 |
0.529 |
|
Lassi |
56 |
0.593 |
0.911 |
0.871 |
0.617 |
|
MuttonCurry |
40 |
0.132 |
0.025 |
0.205 |
0.172 |
|
OnionPakoda |
40 |
0.737 |
0.975 |
0.965 |
0.776 |
|
PalakPaneer |
45 |
0.659 |
0.903 |
0.854 |
0.704 |
|
Poha |
35 |
0.379 |
0.943 |
0.87 |
0.735 |
|
RajmaCurry |
42 |
0.382 |
0.762 |
0.527 |
0.449 |
|
RasMalai |
42 |
0.556 |
0.417 |
0.563 |
0.445 |
|
Samosa |
60 |
0.696 |
0.617 |
0.689 |
0.445 |
|
ShahiPaneer |
40 |
0.604 |
0.1 |
0.298 |
0.254 |
|
WhiteRice |
59 |
0.789 |
0.78 |
0.801 |
0.601 |
Table 5. Performance of YOLO7 for Precision, Recall and MapReduce
|
Class |
Images |
P |
R |
mAP50 |
mAp50-95 |
|
AlooGobi |
40 |
1 |
0 |
0.155 |
0.124 |
|
AlooMasala |
39 |
0.345 |
0.405 |
0.403 |
0.325 |
|
Bhatura |
87 |
0.256 |
0.816 |
0.605 |
0.475 |
|
BhindiMasala |
45 |
0.255 |
0.133 |
0.194 |
0.162 |
|
Biryani |
45 |
0.33 |
0.156 |
0.18 |
0.149 |
|
Chai |
60 |
0.206 |
0.45 |
0.267 |
0.169 |
|
Chole |
72 |
0.214 |
0.31 |
0.192 |
0.151 |
|
CoconutChutney |
57 |
0.248 |
0.421 |
0.192 |
0.13 |
|
Dal |
45 |
0.217 |
0.6 |
0.388 |
0.319 |
|
Dosa |
75 |
0.198 |
0.453 |
0.214 |
0.136 |
|
DumAloo |
44 |
0.128 |
0.0733 |
0.139 |
0.119 |
|
FishCurry |
41 |
0.0386 |
0.0244 |
0.076 |
0.0591 |
|
Ghevar |
48 |
1 |
0 |
0.0514 |
0.0379 |
|
GreenChutney |
66 |
0.476 |
0.682 |
0.628 |
0.472 |
|
GulabJamun |
97 |
0.366 |
0.412 |
0.333 |
0.199 |
|
Idli |
87 |
0.315 |
0.701 |
0.562 |
0.42 |
|
Jalebi |
39 |
0.567 |
0.202 |
0.369 |
0.269 |
|
Kebab |
89 |
0.34 |
0.551 |
0.45 |
0.208 |
|
Kheer |
50 |
0.114 |
0.34 |
0.122 |
0.0892 |
|
Kulfi |
69 |
0.136 |
0.609 |
0.215 |
0.143 |
|
Lassi |
56 |
0.2 |
0.732 |
0.366 |
0.217 |
|
MuttonCurry |
40 |
0.052 |
0.075 |
0.0743 |
0.0542 |
|
OnionPakoda |
40 |
0.275 |
0.575 |
0.272 |
0.2 |
|
PalakPaneer |
45 |
0.206 |
0.933 |
0.584 |
0.493 |
|
Poha |
35 |
0.275 |
0.371 |
0.233 |
0.191 |
|
RajmaCurry |
42 |
0.221 |
0.384 |
0.248 |
0.207 |
|
RasMalai |
42 |
0.207 |
0.762 |
0.417 |
0.329 |
|
Samosa |
60 |
0.216 |
0.565 |
0.238 |
0.114 |
|
ShahiPaneer |
40 |
0.198 |
0.25 |
0.139 |
0.12 |
|
WhiteRice |
59 |
0.377 |
0.661 |
0.435 |
0.295 |
Table 6. Performance of YOLO8 for Precision, Recall and MapReduce
|
Class |
Images |
P |
R |
mAP50 |
mAp50-95 |
|
AlooGobi |
40 |
0.805 |
0.515 |
0.77 |
0.608 |
|
AlooMasala |
39 |
0.619 |
0.821 |
0.817 |
0.679 |
|
Bhatura |
87 |
0.933 |
0.643 |
0.855 |
0.699 |
|
BhindiMasala |
45 |
0.738 |
0.867 |
0.907 |
0.726 |
|
Biryani |
45 |
0.83 |
0.822 |
0.906 |
0.742 |
|
Chai |
60 |
0.676 |
0.65 |
0.699 |
0.466 |
|
Chole |
72 |
0.762 |
0.903 |
0.927 |
0.729 |
|
CoconutChutney |
57 |
0.926 |
0.658 |
0.871 |
0.727 |
|
Dal |
45 |
0.893 |
0.744 |
0.887 |
0.747 |
|
Dosa |
75 |
0.713 |
0.507 |
0.601 |
0.372 |
|
DumAloo |
44 |
0.874 |
0.477 |
0.749 |
0.606 |
|
FishCurry |
41 |
0.681 |
0.468 |
0.662 |
0.516 |
|
Ghevar |
48 |
0.801 |
0.688 |
0.797 |
0.585 |
|
GreenChutney |
66 |
0.766 |
0.758 |
0.799 |
0.626 |
|
GulabJamun |
97 |
0.733 |
0.822 |
0.857 |
0.627 |
|
Idli |
87 |
0.831 |
0.851 |
0.875 |
0.689 |
|
Jalebi |
39 |
0.97 |
0.974 |
0.994 |
0.764 |
|
Kebab |
89 |
0.656 |
0.514 |
0.573 |
0.362 |
|
Kheer |
50 |
0.448 |
0.9 |
0.703 |
0.562 |
|
Kulfi |
69 |
0.786 |
0.638 |
0.755 |
0.524 |
|
Lassi |
56 |
0.733 |
0.625 |
0.766 |
0.589 |
|
MuttonCurry |
40 |
0.788 |
0.575 |
0.805 |
0.595 |
|
OnionPakoda |
40 |
0.946 |
0.75 |
0.917 |
0.731 |
|
PalakPaneer |
45 |
0.94 |
0.889 |
0.946 |
0.789 |
|
Poha |
35 |
0.736 |
1 |
0.949 |
0.758 |
|
RajmaCurry |
42 |
0.815 |
0.81 |
0.878 |
0.747 |
|
RasMalai |
42 |
0.802 |
0.595 |
0.774 |
0.599 |
|
Samosa |
60 |
0.696 |
0.61 |
0.675 |
0.469 |
|
ShahiPaneer |
40 |
0.51 |
0.75 |
0.664 |
0.558 |
|
WhiteRice |
59 |
0.828 |
0.735 |
0.843 |
0.635 |
This study first uses a convolutional neural network (CNN), Faster R-CNN, and YOLO as classifiers for food image recognition and provides a comparative analysis among them. A CNN is used as a classifier to classify food images. Faster R-CNN was also used for food image recognition in this work. In addition, YOLO as a classifier has also been implemented in the food database to improve the classification accuracy. This work is performed on IndianFoodNet, a dataset containing images of various food categories. The results show that YOLO outperforms all other combinations in terms of accuracy of classification. Table 7 shows the complete details of three models of YOLO as when model is trained on YOLO5 and YOLO8 mAP, precision and recall values at epocs5 provide good result with utmost accuracy as compare to YOLO7 where accuracy is lesser at epocs5. MAP50 and MAP50-95 are important metrics for evaluating the accuracy of object detection models, considering both the precision-recall trade-off and the sensitivity to spatial overlap. They provide a more nuanced and comprehensive assessment of a model's performance in real-world scenarios where objects can vary in size, shape, and spatial arrangements.
Table 7. Evaluation of performance of variants of YOLO
|
Model |
Images |
P |
R |
mAP50 |
mAP 50-95 |
|
YOLO5 |
1654 |
0.573 |
0.671 |
0.671 |
0.504 |
|
YOLO7 |
1654 |
0.299 |
0.422 |
0.291 |
0.212 |
|
YOLO8 |
1654 |
0.775 |
0.719 |
0.807 |
0.628 |
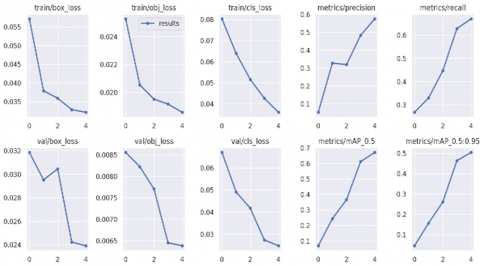
Deciding which model to use for deployment is critical to detection of object. We identify models that perform better at prediction are often slower at inference, and vice versa. As far as concern for IndianFoodNet dataset, inference of training loss is following down and metrics precision and recall is following up in YOLO5 and YOLO8 but in YOLO7 results are varying. As in training summary of YOLO at 5 epochs YOLO8 precision is 0.775 higher than precision of YOLO7 and YOLO5.Recall value of YOLO7 is least in comparison with YOLO5 having value 0.671 and YOLO8 having recall value 0.719. Training summary of three models of YOLO5, YOLO7 and YOLO8 are displayed in Figure 8, Figure 9 and Figure 10 respectively.
We conclude that prediction of YOLO7 model is less accurate in comparison to prediction of YOLO8 and YOLO5.YOLO8 and YOLO5 have a mAP score of 0.807 and 0.671 in comparison to 0.291 of YOLO7.
Figure 8. Training summary of YOLO5 across 5epochs
Figure 9. Training summary of YOLO7 across 5epochs
Figure 10. Training summary of YOLO8 across 5epochs
By using an algorithm of deep learning, we will discover which food items contain how much calories and train a model to detect them. In previous work related to this, we were unable to identify an image dataset that suited our requirements therefore, we designed our own. To start with, we list the food items that are mostly eaten in India from various regions. As a result, we collected a variety of food images and uses bounding boxes to identify the location of each food images and used bounding boxes to identify the location of each food items in the images. Our eventual dataset, IndianFoodNet, restrain images more than 5000 with annotations of 15,000 + annotations spreading across 30 food classes. Our custom dataset allows us to train and compare YOLO5, YOLO7, and YOLO8 algorithms owing to both their high accuracy and speed. According to the results, all algorithms appear to perform ample with respect to accuracy and accomplish more than 0.80 mAP. In terms of accuracy, YOLO5 reports the best performance with a mAP of 0.67, whereas it takes the 5ms fastest inference time with YOLO8. Furthermore, we consider the implication of model selection which is based on deployment requirements:
·The results of this research, which uses deep learning to detect food items, provide a first step towards developing a reliable model of detection that will serve people in recognizing food objects more accurately as out of various variants we can able to found the most accurate on basis of metrics.
·To improve the model performance of detecting an object, we hope that the community adds more images of current labels or append the dataset to brace more possible food labels.
·Additionally, this work presents an opportunity for computer vision experts to improve the existing methods and make better use of the visual cues related to food.
For Future, the authors conclude on the basis of performance of different variants of YOLO to estimate calorie on this dataset using YOLO5 or YOLO8. The potential challenges or limitations that future researchers might encounter are to evaluate volume of intake food. On the basis of volume, portion of food is calculated then calorie is estimated which will support to have healthy diet and healthy life.
This is to acknowledge to University of Petroleum & Energy Studies, Dehradun (UPES) for giving an opportunity to provide an environment and work as a research scholar. We also like to acknowledge Nikunj Bansal for guiding in creation of dataset through his expertise.
[1] Liu, C., Cao, Y., Luo, Y., Chen, G., Vokkarane, V., Ma, Y. (2016). Deepfood: Deep learning-based food image recognition for computer-aided dietary assessment. In Inclusive Smart Cities and Digital Health: 14th International Conference on Smart Homes and Health Telematics, ICOST 2016, Wuhan, China, May 25-27, 2016. Proceedings 14, pp. 37-48. https://doi.org/10.1007/978-3-319-39601-9_4
[2] Nelis, J.L.D., Tsagkaris, A.S., Dillon, M.J., Hajslova, J., Elliott, C.T. (2020). Smartphone-based optical assays in the food safety field. TrAC Trends in Analytical Chemistry, 129: 115934. https://doi.org/10.1016/j.trac.2020.115934
[3] Bhargava, A., Bansal, A. (2021). Fruits and vegetables quality evaluation using computer vision: A review. Journal of King Saud University-Computer and Information Sciences, 33(3): 243-257. https://doi.org/10.1016/j.jksuci.2018.06.002
[4] Sathish, S., Ashwin, S., Quadir, M.A., Pavithra, L.K. (2022). Analysis of convolutional neural networks on Indian food detection and estimation of calories. Materials Today: Proceedings, 62: 4665-4670. https://doi.org/10.1016/j.matpr.2022.03.122
[5] LeCun, Y., Bengio, Y., Hinton, G. (2015). Deep learning. Nature, 521: 436-444. https://doi.org/10.1038/nature14539
[6] Hinton, G., Deng, L., Yu, D., Dahl, G.E., Mohamed, A.R., Jaitly, N., Senior, A., Vanhoucke, V., Nguyen, P., Sainath, T.N., Kingsbury, B. (2012). Deep neural networks for acoustic modeling in speech recognition: The shared views of four research groups. IEEE Signal Processing Magazine, 29(6): 82-97. https://doi.org/10. 1109/MSP.2012.2205597
[7] Tompson, J., Jain, A., LeCun, Y., Bregler, C. (2014). Joint training of a convolutional network and a graphical model for human pose estimation. In: Proceedings of the 27th International Conference on Neural Information Processing Systems - Volume 1. MIT Press, Cambridge, MA, USA, pp. 1799-1807. https://doi.org/10.48550/arXiv.1406.2984
[8] Termritthikun, C., Muneesawang, P., Kanprachar, S. (2017). NU-InNet: Thai food image recognition using convolutional neural networks on smartphone. Journal of Telecommunication, Electronic and Computer Engineering (JTEC), 9(2-6): 63-67. https://jtec.utem.edu.my/jtec/article/view/2436
[9] Srigurulekha, K., Ramachandran, V. (2020, January). Food image recognition using CNN. In 2020 International Conference on Computer Communication and Informatics (ICCCI), pp. 1-7. https://doi.org/10.1109/ICCCI48352.2020.9104078
[10] Azizah, L.M.R., Umayah, S.F., Riyadi, S., Damarjati, C., Utama, N.A. (2017). Deep learning implementation using convolutional neural network in mangosteen surface defect detection. In 2017 7th IEEE International Conference on Control System, Computing and Engineering (ICCSCE), pp. 242-246. https://doi.org/10.1109/ICCSCE.2017.8284412
[11] Liu, C., Cao, Y., Luo, Y., Chen, G., Vokkarane, V., Ma, Y., Chen, S., Hou, P. (2017). A new deep learning-based food recognition system for dietary assessment on an edge computing service infrastructure. IEEE Transactions on Services Computing, 11(2): 249-261. https://doi.org/10.1109/TSC.2017.2662008
[12] Pouladzadeh, P. (2017). A cloud-assisted mobile food recognition system. Doctoral dissertation, Université d'Ottawa/University of Ottawa. http://doi.org/10.20381/ruor-20328
[13] Pandey, P., Deepthi, A., Mandal, B., Puhan, N.B. (2017). FoodNet: Recognizing foods using ensemble of deep networks. IEEE Signal Processing Letters, 24(12): 1758-1762. https://doi.org/10.1109/LSP.2017.2758862
[14] Aguilar, E., Bolaños, M., Radeva, P. (2017). Food recognition using fusion of classifiers based on CNNs. In Image Analysis and Processing-ICIAP 2017: 19th International Conference, Catania, Italy, September 11-15, 2017, Proceedings, Part II 19, pp. 213-224. https://doi.org/10.1007/978-3-319-68548-9_20
[15] Pan, L., Pouyanfar, S., Chen, H., Qin, J., Chen, S.C. (2017). Deepfood: Automatic multi-class classification of food ingredients using deep learning. In 2017 IEEE 3rd International Conference on Collaboration and Internet Computing (CIC), pp. 181-189. https://doi.org/10.1109/CIC.2017.00033
[16] Heravi, E.J., Aghdam, H.H., Puig, D. (2017). Classification of foods by transferring knowledge from ImageNet dataset. In Ninth International Conference on Machine Vision (ICMV 2016), pp. 441-445. https://doi.org/10.1117/12.2268737
[17] Martinel, N., Foresti, G.L., Micheloni, C. (2018). Wide-slice residual networks for food recognition. In 2018 IEEE Winter conference on applications of computer vision (WACV), pp. 567-576. https://doi.org/10.1109/WACV.2018.00068
[18] Ciocca, G., Napoletano, P., Schettini, R. (2018). CNN-based features for retrieval and classification of food images. Computer Vision and Image Understanding, 176: 70-77. https://doi.org/10.1016/j.cviu.2018.09.001
[19] Zhang, Y.D., Dong, Z., Chen, X., Jia, W., Du, S., Muhammad, K., Wang, S. H. (2019). Image based fruit category classification by 13-layer deep convolutional neural network and data augmentation. Multimedia Tools and Applications, 78: 3613-3632. https://doi.org/10.1088/1742-6596/1963/1/012014
[20] Williams, H.A., Jones, M.H., Nejati, M., Seabright, M.J., Bell, J., Penhall, N.D., Barnett, J.J., Duke, M.D., Scarfe, A.J., Ahn, H.S., Lim, J.Y. MacDonald, B.A. (2019). Robotic kiwifruit harvesting using machine vision, convolutional neural networks, and robotic arms. Biosystems Engineering, 181: 140-156. https://doi.org/10.1016/j.biosystemseng.2019.03.007
[21] Mezgec, S., Eftimov, T., Bucher, T., Seljak, B.K. (2019). Mixed deep learning and natural language processing method for fake-food image recognition and standardization to help automated dietary assessment. Public Health Nutrition, 22(7): 1193-1202. https://doi.org/10.1017/S1368980018000708
[22] Reddy, V.H., Kumari, S., Muralidharan, V., Gigoo, K., Thakare, B.S. (2019). Food recognition and calorie measurement using image processing and convolutional neural network. In 2019 4th International Conference on Recent Trends on Electronics, Information, Communication & Technology (RTEICT), pp. 109-115. https://doi.org/10.1109/RTEICT46194.2019.9016694
[23] Teng, J., Zhang, D., Lee, D.J., Chou, Y. (2019). Recognition of Chinese food using convolutional neural network. Multimedia Tools and Applications, 78: 11155-11172. https://doi.org/10.1007/s11042-018-6695-9
[24] Knez, S., Šajn, L. (2020). Food object recognition using a mobile device: Evaluation of currently implemented systems. Trends in Food Science & Technology, 99: 460-471. https://doi.org/10.1016/j.tifs.2020.03.017
[25] Alajrami, M.A., Abu-Naser, S.S. (2020). Type of tomato classification using deep learning. International Journal of Academic Pedagogical Research, 3(12): 21-25.
[26] Kong, F., Tan, J. (2012). DietCam: Automatic dietary assessment with mobile camera phones. Pervasive and Mobile Computing, 8(1): 147-163. https://doi.org/10.1016/j.pmcj.2011.07.003
[27] Matsuda, Y., Hoashi, H., Yanai, K. (2012). Recognition of multiple-food images by detecting candidate regions. In 2012 IEEE International Conference on Multimedia and Expo, pp. 25-30. https://doi.org/10.1109/ICME.2012.157
[28] Kawano, Y., Yanai, K. (2014). Foodcam-256: A large-scale real-time mobile food recognition system employing high-dimensional features and compression of classifier weights. In Proceedings of the 22nd ACM International Conference on Multimedia, pp. 761-762. https://doi.org/10.1145/2647868.2654869
[29] Anthimopoulos, M.M., Gianola, L., Scarnato, L., Diem, P., Mougiakakou, S.G. (2014). A food recognition system for diabetic patients based on an optimized bag-of-features model. IEEE Journal of Biomedical and Health Informatics, 18(4): 1261-1271. https://doi.org/10.1109/JBHI.2014.2308928
[30] Pouladzadeh, P., Shirmohammadi, S., Bakirov, A., Bulut, A., Yassine, A. (2015). Cloud-based SVM for food categorization. Multimedia Tools and Applications, 74: 5243-5260. https://doi.org/10.1007/s11042-014-2116-x
[31] Farinella, G.M., Allegra, D., Moltisanti, M., Stanco, F., Battiato, S. (2016). Retrieval and classification of food images. Computers in Biology and Medicine, 77: 23-39. https://doi.org/10.1016/j.compbiomed.2016.07.006
[32] Kagaya, H., Aizawa, K., Ogawa, M. (2014). Food detection and recognition using convolutional neural network. In Proceedings of the 22nd ACM international conference on Multimedia, pp. 1085-1088. https://doi.org/10.1145/2647868.2654970
[33] Bossard, L., Guillaumin, M., Van Gool, L. (2014). Food-101-mining discriminative components with random forests. In Computer Vision-ECCV 2014: 13th European Conference, Zurich, Switzerland, September 6-12, 2014, Proceedings, Part VI 13, pp. 446-461. https://doi.org/10.1007/978-3-319-10599-4_29
[34] Yanai, K., Kawano, Y. (2015). Food image recognition using deep convolutional network with pre-training and fine-tuning. In 2015 IEEE International Conference on Multimedia & Expo Workshops (ICMEW), pp. 1-6. https://doi.org/10.1109/ICMEW.2015.7169816
[35] Meyers, A., Johnston, N., Rathod, V., Korattikara, A., Gorban, A., Silberman, N., Guadarrama, S., Papandreou, G., Huang, J. Murphy, K.P. (2015). Im2Calories: Towards an automated mobile vision food diary. In Proceedings of the IEEE International Conference on Computer Vision, pp. 1233-1241.
[36] Yu, F., Wang, D., Shelhamer, E., Darrell, T. (2018). Deep layer aggregation. In Proceedings of the IEEE Conference on Computer Vision and Pattern Recognition, pp. 2403-2412.
[37] Qiu, J., Lo, F.P.W., Sun, Y., Wang, S., Lo, B. (2022). Mining discriminative food regions for accurate food recognition. arxiv preprint arxiv:2207.03692. https://arxiv.linfen3.top/abs/2207.03692
[38] Aguilar, E., Radeva, P. (2019). Food recognition by integrating local and flat classifiers. In Iberian Conference on Pattern Recognition and Image Analysis, pp. 65-74. https://doi.org/10.1007/978-3-030-31332-6_6
[39] Aguilar, E., Bolaños, M., Radeva, P. (2019). Regularized uncertainty-based multi-task learning model for food analysis. Journal of Visual Communication and Image Representation, 60: 360-370. https://doi.org/10.1016/j.jvcir.2019.03.011
[40] Kayıkçı, Ş., Başol, Y., Dörter, E. (2019). Classification of turkish cuisine with deep learning on mobile platform. In 2019 4th International Conference on Computer Science and Engineering (UBMK), pp. 1-5. https://doi.org/10.1109/UBMK.2019.8906992
[41] Zhu, L., Spachos, P., Pensini, E., Plataniotis, K.N. (2021). Deep learning and machine vision for food processing: A survey. Current Research in Food Science, 4: 233-249.
[42] Sarkar, T., Mukherjee, A., Chatterjee, K. (2021). Supervised learning aided multiple feature analysis for freshness class detection of Indian gooseberry (Phyllanthus emblica). Journal of The Institution of Engineers (India): Series A, 1-15. https://doi.org/10.1007/s40030-021-00585-2
[43] Jahanbakhshi, A., Momeny, M., Mahmoudi, M., Radeva, P. (2021). Waste management using an automatic sorting system for carrot fruit based on image processing technique and improved deep neural networks. Energy Reports, 7: 5248-5256. https://doi.org/10.1016/j.egyr.2021.08.028
[44] Sun, J., Radecka, K., Zilic, Z. (2019). Foodtracker: A real-time food detection mobile application by deep convolutional neural networks. arxiv preprint arxiv:1909.05994. https://arxiv.linfen3.top/abs/1909.05994
[45] Jahanbakhshi, A., Abbaspour-Gilandeh, Y., Heidarbeigi, K., Momeny, M. (2021). A novel method based on machine vision system and deep learning to detect fraud in turmeric powder. Computers in Biology and Medicine, 136: 104728. https://doi.org/10.1016/j.compbiomed.2021.104728
[46] Zhou, L., Zhang, C., Liu, F., Qiu, Z., He, Y. (2019). Application of deep learning in food: A review. Comprehensive Reviews in Food Science and Food Safety, 18(6): 1793-1811. https://doi.org/10.1111/1541-4337.12492
[47] Okamoto, K., Yanai, K. (2016). An automatic calorie estimation system of food images on a smartphone. In Proceedings of the 2nd International Workshop on Multimedia Assisted Dietary Management, pp. 63-70. https://doi.org/10.1145/2986035.2986040
[48] Latif, G., Alsalem, B., Mubarky, W., Mohammad, N., Alghazo, J. (2020). Automatic fruits calories estimation through convolutional neural networks. In Proceedings of the 2020 6th International Conference on Computer and Technology Applications, pp. 17-21. https://doi.org/10.1145/3397125.3397154
[49] Kasyap, V.B., Jayapandian, N. (2021). Food calorie estimation using convolutional neural network. In 2021 3rd International Conference on Signal Processing and Communication (ICPSC), pp. 666-670. https://doi.org/10.1109/ICSPC51351.2021.9451812
[50] Pouladzadeh, P., Kuhad, P., Peddi, S.V.B., Yassine, A., Shirmohammadi, S. (2016). Food calorie measurement using deep learning neural network. In 2016 IEEE International Instrumentation and Measurement Technology Conference Proceedings, pp. 1-6. https://doi.org/10.1109/I2MTC.2016.7520547
[51] Dhanalakshmi, S., Harshitha, S.V., Mukeshwar varma, D., Mayuri, P. (2020). Food classification and calorie estimation using computer vision techniques. International Journal of Emerging Technologies and Innovative Research, 7(6):143-147.
[52] Kumar, R.D., Julie, E.G., Robinson, Y.H., Vimal, S., Seo, S. (2021). Recognition of food type and calorie estimation using neural network. The Journal of Supercomputing, 1-22. https://doi.org/10.1007/s11227-021-03622-w
[53] Ayon, S.A., Mashrafi, C.Z., Yousuf, A.B., Hossain, F., Hossain, M.I. (2021). FoodieCal: A convolutional neural network based food detection and calorie estimation system. In 2021 National Computing Colleges Conference (NCCC), pp. 1-6. https://doi.org/10.1109/NCCC49330.2021.9428820
[54] Ege, T., Yanai, K. (2018). Image-based food calorie estimation using recipe information. IEICE Transactions on Information and Systems, 101(5): 1333-1341. https://doi.org/10.1587/transinf.2017MVP0027
[55] Shen, Z., Shehzad, A., Chen, S., Sun, H., Liu, J. (2020). Machine learning based approach on food recognition and nutrition estimation. Procedia Computer Science, 174: 448-453. https://doi.org/10.1016/j.procs.2020.06.113
[56] Chaudhari, A., More, S., Khane, S., Mane, H., Kamble, P. (2019). Object detection using convolutional neural network in the application of supplementary nutrition value of fruits. International Journal of Innovative Technology and Exploring Engineering (IJITEE), 8(11): 19. https://doi.org/10.35940/ijitee.k1432.0981119
[57] Kakani, V., Nguyen, V.H., Kumar, B.P., Kim, H., Pasupuleti, V.R. (2020). A critical review on computer vision and artificial intelligence in food industry. Journal of Agriculture and Food Research, 2: 100033. https://doi.org/10.1016/j.jafr.2020.100033
[58] Korobova, L.A., Matytsina, I.A., Tolstova, I.S., Mironova, M.S. (2021). Prototype mobile application definitions fresh products based on neural network. In Journal of Physics: Conference Series, 1902(1): 012118. https://doi.org/10.1088/1742-6596/1902/1/012118
[59] Kumar, I., Rawat, J., Mohd, N., Husain, S. (2021). Opportunities of artificial intelligence and machine learning in the food industry. Journal of Food Quality, 2021: 4535567. https://doi.org/10.1155/2021/4535567
[60] Hategan, A.R., Puscas, R., Cristea, G., Dehelean, A., Guyon, F., Molnar, A.J., Mirel, V., Magdas, D.A. (2021). Opportunities and constraints in applying artificial neural networks (ANNs) in food authentication. Honey—A case study. Applied Sciences, 11(15): 6723. https://doi.org/10.3390/app11156723
[61] Chidinma-Mary-Agbai, C.M. (2020). Application of artificial intelligence (AI) in food industry. GSC Biological and Pharmaceutical Sciences, 13(1), 171-178.
[62] Sarkar, T., Bhattacharjee, R., Salauddin, M., Giri, A., Chakraborty, R. (2020). Application of fuzzy logic analysis on pineapple rasgulla. Procedia Computer Science, 167: 779-787. https://doi.org/10.1016/j.procs.2020.03.410
[63] Giovanni Maria Farinella, G.M., Allegra, D., Stanco, F. (2014). A benchmark dataset to study the representation of food images. In European Conference on Computer Vision, pp. 584-599. https://doi.org/10.1007/978-3-319-16199-0_41
[64] Kuhad, P., Yassine, A., Shimohammadi, S. (2015). Using distance estimation and deep learning to simplify calibration in food calorie measurement. In 2015 IEEE International Conference on Computational Intelligence and Virtual Environments for Measurement Systems and Applications (CIVEMSA), pp. 1-6. https://doi.org/10.1109/CIVEMSA.2015.7158594
[65] Antonov, A. (2019). Food-11 image dataset. https://www.kaggle.com/datasets/trolukovich/food11-image-dataset.
[66] Batman. (2020). Food20 dataset (Indian food) https://www.kaggle.com/datasets/cdart99/food20dataset.
[67] Prabhavalkar, N. (2020). Indian food 101. https://www.kaggle.com/datasets/nehaprabhavalkar/Indian-food-101.
[68] Jain, K. (2020). 6000+ Indian food recipes dataset. https://data.mendeley.com/datasets/xsphgmmh7b/1.
[69] Banerjee, S. (2022). Indian food images dataset. https://www.kaggle.com/datasets/IamSouravbanerjee/indian-food-images-dataset.
[70] Ali, S.A., Hromadka, T.V. (2023). Comparison of current complex variable boundary element method (CVBEM) capabilities in basis functions, node positioning algorithms (NPAs), and coefficient determination methods. International Journal of Computational Methods and Experimental Measurements, 11(3): 143-148. https://doi.org/10.18280/ijcmem.110302