Amina A. Fadhil*![]() | Fawaz Yaseen Abdullah
| Fawaz Yaseen Abdullah![]() | Mohammad Tariq Yaseen
| Mohammad Tariq Yaseen![]()
© 2024 The authors. This article is published by IIETA and is licensed under the CC BY 4.0 license (http://creativecommons.org/licenses/by/4.0/).
OPEN ACCESS
This paper aims to solve the problem of air pollution resulting from the operation of electrical generators and car exhausts by monitoring and evaluating the air quality within the University of Mosul. Researchers encountered challenges in sending data across long ranges. This study suggests using LoRa-WAN wireless technology to gather information on air quality using sensor nodes fixed in eight sites inside Mosul University, and then communicate with the cloud via the LoRa gateway to transfer data to the monitoring center. The primary advantage of the proposed technique is the transfer of data with low cost, long-range communication, low energy consumption, low latency, and ease of uploading information to the IoT Cloud platform. This system employs sensor nodes to measure (temperature, CO2, PM1.0, PM2.5, PM10, humidity, and Air Quality Index (AQI)). The sensor nodes are continually powered by a battery. This paper presents two essential contributions: an environmental contribution by presenting findings on air pollution levels, and a technological contribution to monitor and transfer air quality data inside Mosul University to a monitoring center using the LoRa network in the OMNET++ simulation program. The typical CO2 concentrations in the air are about 400 ppm (parts per million), with temperature at 21℃, and humidity at 50%. Standard limits for PM2.5 and PM10 have been set by the World Health Organization (WHO) with a daily average of 15 μg/m3 and 45 μg/m3 respectively. The findings conclude that medium CO2 concentrations above 518 ppm and PM2.5 concentrations above 11 μg/m3 in site 8 were due to car exhausts. The data transmission efficiency between sensor nodes and the LoRa gateway was investigated via the Received Signal Strength Indicator (RSSI) and total received packets. Simulation results in all scenarios demonstrate the possibility of covering the distance between the sensor nodes fixed in the eight sites inside Mosul University and its wireless communication with the LoRa gateway, as well as improved LoRa performance by increasing the total received packets at the network server from 104 to 309 when decreasing the transmission time interval of packets. Our technology is capable of accurately monitoring air quality indicators and effectively transmitting the data synchronously to the cloud to monitor parameters and reduce the impact of air pollution.
Air Quality Index, air pollution level, environmental protection, LoRa technology, OMNET++program
The air quality is influenced by increased emissions from vehicles in Mosul city, Iraq, which is considered a significant environmental threat [1]. One of the most significant challenges facing the modern environment is the issue of air pollution and maintaining air quality [2]. In recent times, studies from the USA and Europe have focused on airborne toxins such as nitrogen dioxide (NO2), ozone (O3), carbon monoxide (CO), and particulate matter (PM), which are considered real health threats. Data on air quality is expressed in parts per million (ppm) and displayed on LCD screens online, making it easy to monitor its effects on health, where new electronic devices could be used for this purpose [3, 4]. The data has been analyzed and collected from sensor nodes as temperature, and IoT assist in transferring the values to the cloud [5]. Real-time air quality surveillance systems have been developed, relying on wireless communication technology [6, 7]. A pollution sensor has been used to monitor and detect air quality on mobile wireless devices [8]. Machine learning with IoT has been implemented to monitor and reduce vehicle emissions of air pollution [9]. Appropriate procedures are taken to understand if the pollutant persists [10].
In the study conducted by Zhao et al. [11], an air quality meter was developed by deploying sensor nodes attached to Unmanned Aircraft vehicles using LoRa technology. They successfully collected information from sensor devices using UAVs that traveled a total distance of about 200 m during 118 seconds. Air quality monitoring system was introduced using unmanned aerial vehicle (UAV) which achieved two goals [12]. It could perform in real time scheme, in addition to, it could perform sensing tasks. The researchers try to deploy new techniques for sensor nodes that are able to measure parameters and then send information to the cloud via LoRa-WAN technology [13]. The CO2 and PM2.5 levels were successfully monitored for air quality in the kitchen of the cafeteria and the laboratory of the University of Rwanda. According to most research, PM2.5 at or below 12 μg/m3 is considered safe. The data was analyzed over the course of eleven months. The results revealed elevated CO2 levels of more than 800 ppm and PM2.5 levels of more than 100 μg/m3 in the kitchen environment, while there was a concentration of 500 ppm of CO2 and 0 μg/m3 of PM2.5 inside the laboratory [14]. A smart, scalable method for monitoring air quality in Myanmar was proposed using low-cost sensor nodes and the LoRa-WAN protocol for long-range communication [15]. The sensor nodes collect data on parameters: such as dust, humidity, temperature, and carbon dioxide from the air, and then send it online in real-time using LoRa technology for monitoring and predicting air pollution effects in the Yangon region. Users can examine the gathered data on the Grafana dashboard, by using their Google login credentials to access the Grafana server. The results show a temperature range of 26–32℃, humidity range of 79–100% H, dust range of 1–70, and carbon dioxide range of 406–529 ppm. The air pollution due to the use of pesticides, fertilizers, and industrialization in India was introduced [16]. They designed a system that contains integrated sensor nodes with microcontrollers and sends sensor data wirelessly using LoRa technology, then displays air quality data online on the IoT platform ThingSpeak. Portable devices can be used in different fields to send and receive data. They sent this data to the cloud ThingSpeak using wireless LoRa models to enable users to read the data online [17]. The results showed elevated levels of PM2.5 pollution ranging from 300 to 1,000 μg/m3, and elevated levels of PM10 pollution ranging from 305 to 1,013 μg/m3. The air quality within building ducting systems was done by integrating microcontrollers and smart sensor nodes with mobile robots using wireless LoRa technology and the instrument of DAQM to solve non-line-of-sight transmission problems. The sensor nodes measured carbon dioxide, carbon monoxide, PM2.5, and smoke levels in a multiple-story building. The findings presented an improvement in the area of coverage due to enhancements in the Packet Delivery Ratio (PDR) and RSSI (received signal strength indicator). Different distances within the campus were covered to analyze the performance of the data transmission. They noted that data packet transmission failure and network disturbance were caused by a low RSSI value. The results indicated that the PDR and RSSI were the lowest at 59.42% and −108 dBm, and the highest values recorded for PDR and RSSI were 100% and −91 dBm, respectively. An air quality monitoring system (AQMS) was developed using LoRa technology-based IoT with Arduino via the TTN platform. This system is powered by recharging batteries with sustainable solar photovoltaic panels. The sensor nodes collect data from the air, such as SO2, CO, NO2, CO2, PM2.5, humidity, and temperature, and send updates to the cloud. The data updates are displayed via a dashboard on the web and a graphical interface using the Virtuino mobile application. The system successfully recorded temperature at 31℃, humidity at 74%, CO2 at 220 ppm, CO at 0.19 ppm, NO2 at 0.17 ppm, SO2 at 0.12 ppm, and PM2.5 at 120 μg/m3, and transmitted them from the LoRaWAN network to the IoT server [18, 19]. The optimization of the system parameters was achieved which influences the performance of a LoRa system and this could transform agriculture field into a new perspective of smart cultivation [20].
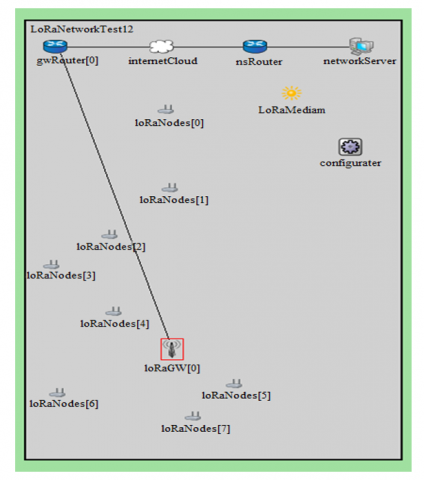
Figure 1. A screen capture shows the FLoRa window, there are eight sensor devices and one LoRa gateway linked to the cloud server by the wireless network
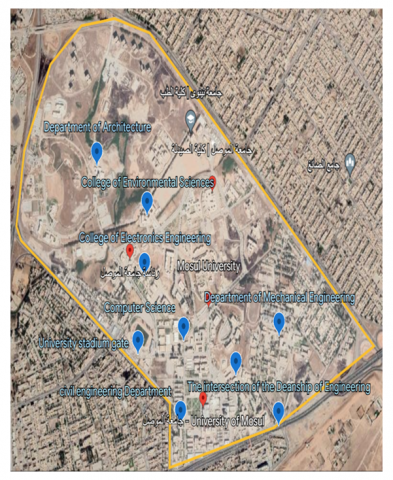
Figure 2. Displays the map of sites to measure air quality in Mosul University
OMNeT++ is a modular, extendable, and component-based C++ simulation toolkit and framework used for creating network simulators for wired and wireless communication. It supports sensor networks and provides a powerful GUI for simulating network protocols like LoRaWAN. OMNET++ also creates a trace file that includes all relevant information about the scenario.
FLoRa (Framework for LoRa) is a framework that enables network simulation and end-to-end simulation of LoRa networks. It relies on the OMNeT++ network simulator and the INET framework. FLoRa allows the construction of LoRa networks using modules for LoRa nodes, gateways, and network servers. Application logic can be installed as stand-alone modules connected to the network server. The network server and nodes enable dynamic management of configuration parameters, including Adaptive Data Rate (ADR). Additionally, each node gathers statistics on energy consumption.
The framework includes both the physical layer and the MAC layer and is freely available as open-source software. The network infrastructure consists of sensor devices, gateways, and servers. In this study, the regional characteristics for the physical layer of LoRa in Europe were used, as shown in Table 1.
Table 1. Parameters of simulation [19]
|
Setting Parameters |
The Number |
|
Simulation time |
1 day |
|
The number of gateways |
1 |
|
The number of sensor device |
8 |
|
Carrier Frequency |
868 MHz |
|
Bandwidth |
125 kHz |
|
Code Rate (CR) |
4/8 |
The simulation time was set to one day to demonstrate the concept of daily air quality monitoring within the University of Mosul. Figure 1 shows a screenshot of the LoRa window, which displays eight sensor nodes, deployed with the central gateway in the deployment region. This paper focuses on the impact of different parameter settings on RSSI, and the total number of received packets at the network server. The parameters of the sensor nodes were measured at eight sites within Mosul University, as depicted in Figure 2.
The fundamental approach of this study is to measure air quality parameters using sensors and transfer the data wirelessly using Lora technology.
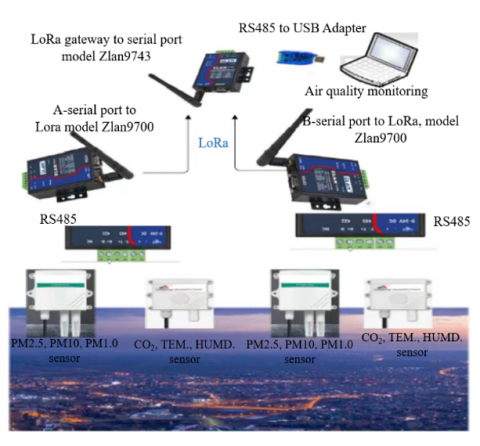
The transmitter consists of a serial port RS485 to LoRa converter (type ZLAN9700) and sensors that collect air quality data. The RS485-LoRa converter was used to address the issue of installing RS485 cables for monitoring various sensor nodes with RS485 interfaces. The LoRa-RS485 converter provides flexibility in wireless applications and can easily connect to any sensor, with RS485 interfaces. The RS485-LoRa (type ZLAN9700) allows users to monitor and control RS485 devices at long ranges (2–8km). RS485 is a serial communication protocol that uses differential signal transmission. This approach improves RS485's resistance to interference, making it suitable for noisy industrial environments where noise can affect both wires simultaneously. However, RS485 can still accurately interpret the data.
The receiving device collects data using the LoRa communication (type ZLAN 9743) of the gateway. The LoRa -RS485 converter in the gateway takes in the data and sends it to a USB adapter via an RS485-USB converter. The data is then processed by the air quality program on the laptop. Setting up the LoRa-RS485 converter is easy with its utility software, and it provides end-to-end encryption. To configure the RS485-LN, you need to send commands from your PC using a USB-RS485 converter.
The diagram of air quality monitoring is shown in Figure 3.
Figure 3. Diagram of air quality monitoring system
The system comprises the following sensors:
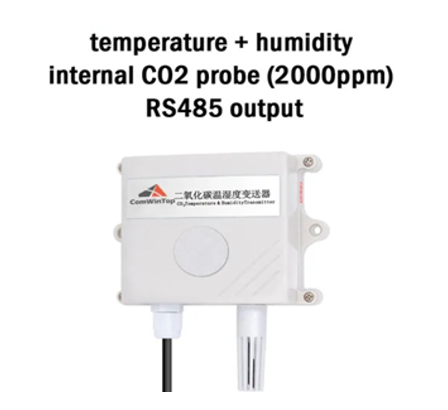
(1) Industrial Carbon Dioxide Sensor (CO2, humidity, and temperature to RS485 Transmitter). The purpose of this sensor device is to detect high-sensitivity gas with a stable signal and excellent precision. One of its features is a broad measurement range and a communication interface with good linearity: RS485 communication) protocol. The IPV65 shell is fully watertight and suitable for usage in severe environments. An analog CO2 Gas Sensor (MG-811 Sensor) is used in this system. The image of this sensor could be seen in Figure 4.
Figure 4. Industrial Carbon Dioxide Sensor (CO2, humidity, and temperature to RS485 Transmitter)
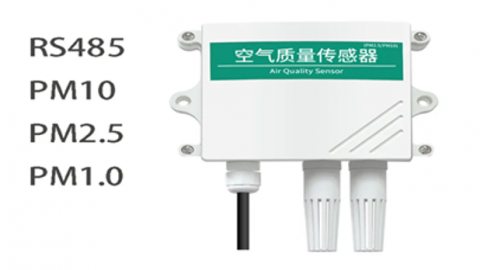
(2) PM2.5 PM10 sensor PM1.0 pollution particles TSP dust detector. This device, utilizes a magnetic proximity sensor. Parameters can be configured using the included configuration software through the 485 interface. Resolution is 1 μg/m3. The image of this sensor could be seen in Figure 5.
Figure 5. PM2.5 PM10 sensor PM1.0 pollution particles TSP dust detector
The accuracy of the sensor is shown in Table 2.
Table 2. Accuracy of PM2.5 PM10 sensor PM1.0
|
Devices |
Value |
|
Efficiency of PM2.5 |
50% @0.3 μm, 98% @ ≥ 0.5μm |
|
Accuracy of PM2.5 |
±3% FS (@100 μg/m3, 25℃, 50% RH) 868 MHz |
|
Devices |
Accuracy of Devices Measuring |
|
PM2.5 |
0~2000 μg/m3 |
|
PM10 |
0~2000 μg/m3 |
|
PM1.0 |
0~2000 μg/m3 |
|
Response speed |
≤90S |
|
Preheating time |
≤2min |
The majority of Internet of Things (IoT) sensor nodes are built with battery lifespans of at least 1-3 years. The lifetime of battery utilization depends on battery type, distance between sensor node and gateway, frequency of data transmission, and usage of sensor nodes.
Specifically, the temperature sensor has a resolution of 0.01℃ and an accuracy of ±0.5℃, operating in the range of −40℃ to ±85℃, while the humidity sensor has a range of 0% RH to 100% RH, with an accuracy of ±3% RH and a resolution of 0.008% RH.
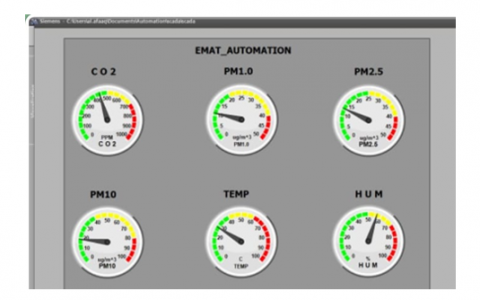
Figure 6 shows the parameters of the air quality displayed on the dashboard.
Figure 6. Air quality monitoring dashboard
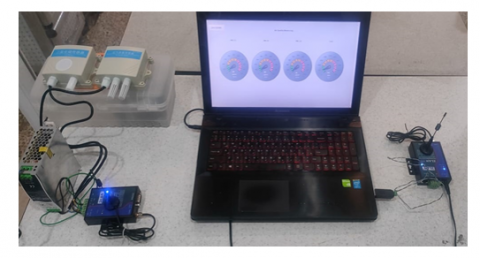
Figure 7 shows the implemented system. It consists of the transmitter part with the two sensors and a 24V power supply. This TX part is placed outside the window where the air quality will be measured. The receiver part consists of opening the Lora gateway module connected to the computer.
Figure 7. Hardware implemented
Sensor nodes have been deployed in optimal locations to achieve the best coverage in the area. Many factors have been considered that influence the efficiency of sensor nodes, such as the type of sensor node, climate, topography, vegetation, number of nodes available, and communication potential.
RSSI (Received Signal Strength Indicator) is a relative measurement that helps determine the sufficient strength of the received signal in a LoRa gateway to establish an acceptable wireless connection from the transmitter device. Since LoRaWAN supports two-way communication, RSSI is an essential measurement for both sensor nodes and gateways. RSSI has a negative value and is expressed in dBm. The strength of the received signal increases as the RSSI number approaches zero. RSSI is higher for shorter distances between the sensor node and the gateway.
This study offers two scenarios to evaluate the performance of LoRa networks. The LoRa network utilizes multiple sites within the University of Mosul.
The network consists of eight sensor devices placed in the simulation network and one gateway placed at the end of the network. The simulation ran for a full day.
The levels of air pollution are not always the same; they can change depending on weather conditions, different times of the day, and the season. To gain a deeper understanding of these trends and patterns in pollution, different locations and times have been selected inside the university.
The Thing Speak (TTN) of LoRa-WAN technology allows free access with a fair access policy. However, the daily air time is limited to 30 seconds. The shortest time interval between transmissions allowed is 30 seconds. In order to accurately examine the air quality, a transmission time interval of 1,000 seconds was chosen to allow for changes in the air molecules Increasing the time interval between transmitted packets reduces the number of times packets are sent during the simulation period of one day, resulting in a decrease in the number of packets received.
Table 3. Parameters values of the sensor devices
|
Time |
Parameters |
Site (1) |
Site (2) |
Site (3) |
Site (4) |
Site (5) |
Site (6) |
Site (7) |
Site (8) |
|
9:00 AM |
Temperature(℃) |
30.4 |
37.7 |
36.6 |
36.2 |
36 |
35.6 |
34.3 |
35.7 |
|
CO2 (ppm) |
413 |
444 |
413 |
537 |
640 |
545 |
465 |
518 |
|
|
PM1.0 (μg/m3) |
4 |
7 |
4 |
6 |
5 |
5 |
3 |
6 |
|
|
PM2.5 (μg/m3) |
7 |
12 |
8 |
10 |
8 |
9 |
7 |
11 |
|
|
PM10 (μg/m3) |
9 |
15 |
10 |
13 |
10 |
11 |
8 |
13 |
|
|
humidity |
38.5 |
48.2 |
48.3 |
34.4 |
45 |
33.2 |
34.1 |
50.3 |
|
|
AQI |
10 |
17 |
11 |
14 |
11 |
12 |
10 |
15 |
|
|
1:00 PM |
Temperature(℃) |
45.4 |
44.5 |
41.5 |
42.2 |
40.5 |
40.4 |
39.2 |
41.3 |
|
CO2 (ppm) |
451 |
477 |
454 |
477 |
445 |
475 |
451 |
487 |
|
|
PM1.0 (μg/m3) |
4 |
8 |
7 |
19 |
7 |
7 |
7 |
6 |
|
|
PM2.5 (μg/m3) |
8 |
14 |
12 |
30 |
12 |
12 |
12 |
11 |
|
|
PM10 (μg/m3) |
10 |
18 |
14 |
39 |
13 |
16 |
15 |
13 |
|
|
Humidity |
27.6 |
26.9 |
26.3 |
25.4 |
26.3 |
25.8 |
26.2 |
25.6 |
|
|
AQI |
11 |
20 |
15 |
42 |
15 |
17 |
17 |
15 |
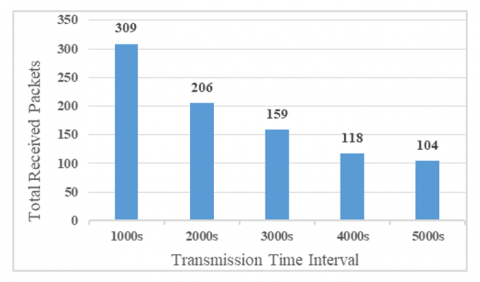
The performance of the LoRa network was evaluated by analyzing the effect of the transmission time interval on the total received packets at the network server. The total received packets decreased from 309 to 104 when the transmission time interval increased from 1,000 seconds to 5,000 seconds, as shown in Figure 8.
Figure 8. The total received packets at the server network vs. transmission time interval of packets employing one LoRa gateway and eight sensor devices
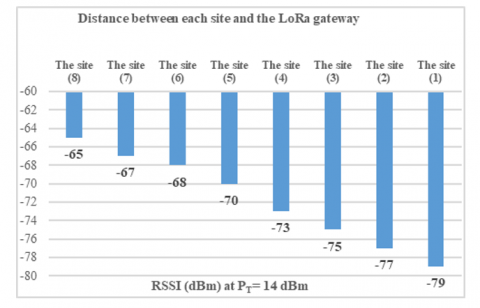
According to the Lora Alliance document, the maximum transmission power is 14 dBm at 868MHz.
The study aimed to examine the effect of the distance between the sensor devices and the gateway on the received signal strength indicator (RSSI) for a transmission power of 14 dBm as shown in Figure 9.
Figure 9. The RSSI versus the distance between the sensor devices and the LoRa gateway for 8 sensor nodes using a single LoRa gateway
In the simulation scenario, data from the sensor devices was gathered, and transferred through the wireless network to the LoRa gateway, before reaching the network server. The network server controls the type of application that a user can use to customize the transmission duration and parameter values for each sensor device. To improve the performance of LoRa technology, it is necessary to research the impact of the distance separation between the sensor devices and the LoRa gateway on the received signal strength indication (RSSI). The RSSI is the strength of the signal received by a specific LoRa gateway from the sensor devices.
Additionally, the total number of received packets at the network server was calculated to ensure the quality of the connection and achieve efficient data transfer.
It should be noted that the LoRa WAN application layer is managed by the application server, which includes tasks such as downlink data encryption and encoding, downlink data queuing, and uplink data decoding and decryption.
The network server, which is the fundamental component of the star topology, is responsible for adjusting the data rate. It connects the application servers to the gateways. The cloud-based network server consists of a processor, router, and moderator. Its job is to ensure that no packets are duplicated by scheduling different acknowledgments. The network server is responsible for both decoding received and eliminating duplicate packets.
This paper provides an analysis and monitoring of the system's efficiency in a real setting in Mosul City. The air quality was assessed in different sites using 8 sensor devices inside Mosul University. The goal of this paper's strategy was achieved through LoRa technology, which shares air quality monitoring using the simulation tool OMNET++. This allows for the sending of sensor devices' data to the cloud for monitoring and performing the required actions in real-time, ultimately decreasing the probability of air pollution.
The RSSI metric was chosen as an indicator of network performance, due to its importance in all LoRa modules. RSSI is utilized to judge the strength of a wireless signal. It is a component of the layer used for wireless transmission and is utilized to assess the quality of the link and determine whether to increase the broadcast transmission strength. In summary, the purpose of RSSI is to measure the strength of wireless signals in the surrounding environment and determine whether the channel is occupied. Its purpose is to assess radio link quality, with a radio link being considered GOOD if its RSSI is greater than −115dB, and BAD if RSSI <= −120 dB.
Total received packets were chosen as a metric to indicate network performance due to the network server's function in the cloud, which manages the network by receiving packets from gateways, scheduling acknowledgments, packet decoding, and ensuring packet de-duplication. To more accurately assess air quality, a time interval of 1,000 seconds was selected between transmitted beams. This allows for anticipation of a change in air molecules when the durations between broadcast packets are extended from sensor nodes. As a result, transmitters will send fewer packets throughout the one-day simulation period, which leads to a lower number of packets received at the network server.
The results showed an increase in the concentration of CO2 and temperature in the presence of generators and parking cars, reaching 487 ppm and 41.3℃ respectively at 1:00 PM. The effectiveness of the network increased through improved network performance, represented by increased RSSI after setting the best distance between sensor devices and the gateway. Additionally, the total received packets increased from 104 to 309 when the transmission time interval decreased from 5,000s to 1,000s.
The President of Mosul University presented a strategy to reduce air pollution inside the university which includes increasing green space, relying on renewable energies, riding bikes, adjusting air conditioners, employing public transportation, and switching to electric cars.
Looking to the future, the work will focus on introducing additional types of sensor devices to measure Nitrogen Dioxide (NO₂), Wind Speed, Wind Direction, Ozone (O₃), and Black Carbon (BC) in order to improve the air quality in Mosul City.
The authors are grateful for all the support that was provided by the University of Mosul.
|
AQI |
Air Quality Index |
|
RSSI |
Received signal strength indicator |
|
PM |
particulate matter (also known as particle pollution). |
|
ppm |
parts per million |
[1] Shihab, A.S. (2021). Assessment of ambient air quality of Mosul city/Iraq via Air Quality Index. Journal of Ecological Engineering, 22(10): 241-250. https://doi.org/10.12911/22998993/142448
[2] Sai, K.B.K., Mukherjee, S., Sultana, P. (2019). Low cost IoT based air quality monitoring setup using Arduino and MQ series sensors with dataset analysis. Procedia Computer Science, 165: 322-327. https://doi.org/10.1016/j.procs.2020.01.043
[3] Hussein, S.H., Yaseen, M.T. (2021). Performance evaluation of low-voltage CMOS switched-capacitor circuit. In 8th International Conference on Electrical and Electronics Engineering, Antalya, Turkey, pp. 40-43. https://doi.org/10.1109/ICEEE52452.2021.9415921
[4] Sharma, P.K., De, T., Saha, S. (2018). IoT based indoor environment data modelling and prediction. In 2018 10th International Conference on Communication Systems & Networks (COMSNETS), Bengaluru, India, pp. 537-539. https://doi.org/10.1109/COMSNETS.2018.8328266
[5] Komala, C.R., Khan, S., Kumari, S., Jeelani, S.A. (2023). Sensing and predictive analysis of indoor air quality based on internet of things: A COVID-19 perspective. International Research Journal of Modernization in Engineering Technology and Science, 5(2): 2148-2152. https://doi.org/10.56726/IRJMETS33855
[6] Girish, S.V., Prakash, R., Balaji Ganesh, A. (2016). Real-time remote monitoring of indoor air quality using Internet of Things (IoT) and GSM connectivity. In Artificial Intelligence and Evolutionary Computations in Engineering Systems, New Delhi, India, pp. 527-533. https://doi.org/10.1007/978-81-322-2656-7_48
[7] Liu, S., Xia, C., Zhao, Z. (2016). A low-power real-time air quality monitoring system using LPWAN based on LoRa. In 2016 13th IEEE International Conference on Solid-State and Integrated Circuit Technology (ICSICT), Hangzhou, China, pp. 379-381. https://doi.org/10.1109/ICSICT.2016.7998927
[8] Marques, G., Ferreira, C.R., Pitarma, R. (2019). Indoor air quality assessment using a CO2 monitoring system based on internet of things. Journal of Medical Systems, 43: 1-10. https://doi.org/10.1007/s10916-019-1184-x
[9] Alvear-Puertas, V.E., Burbano-Prado, Y.A., Rosero-Montalvo, P.D., Tözün, P., Marcillo, F., Hernandez, W. (2022). Smart and portable air-quality monitoring IoT low-cost devices in Ibarra City, Ecuador. Sensors, 22(18): 7015. https://doi.org/10.1109/ICSICT.2016.7998927
[10] Dhanalakshmi, M., Radha, V. (2021). A survey paper on vehicles emitting air quality and prevention of air pollution by using IoT along with machine learning approaches. Turkish Journal of Computer and Mathematics Education, 12(11): 5950-5962. https://www.turcomat.org/index.php/turkbilmat/article/view/6880/6323.
[11] Zhao, Y.L., Tang, J., Huang, H.P., Wang, Z., Chen, T.L., Chiang, C.W., Chiang, P.C. (2020). Development of IoT technologies for air pollution prevention and improvement. Aerosol and Air Quality Research, 20(12): 2874-2888. https://doi.org/10.4209/aaqr.2020.05.0255
[12] Chen, L.Y., Huang, H.S., Wu, C.J., Tsai, Y.T., Chang, Y.S. (2018). A LoRa-based air quality monitor on unmanned aerial vehicle for smart city. In 2018 International Conference on System Science and Engineering, New Taipei, Taiwan, pp. 1-5. https://doi.org/10.1109/ICSSE.2018.8519967
[13] Yaseen, M.T. (2021). Light harvesting enhancement using metal nanoparticles. Eastern-European Journal of Enterprise Technologies, 2(5(110)): 39-45. https://doi.org/10.15587/1729-4061.2021.228806.
[14] Twahirwa, E., Mtonga, K., Ngabo, D., Kumaran, S. (2021). A Lora enabled IoT-based air quality monitoring system for smart city. In 2021 IEEE World AI IoT Congress (AIIoT), Seattle, WA, USA, pp. 0379-0385. https://doi.org/10.1109/aiiot52608.2021.9454232
[15] Thu, M.Y., Htun, W., Aung, Y.L., Shwe, P.E.E., Tun, N.M. (2018). Smart air quality monitoring system with LoRaWAN. In 2018 IEEE International Conference on Internet of Things and Intelligence System (IOTAIS), Bali, Indonesia, pp. 10-15. https://doi.org/10.1109/iotais.2018.8600904
[16] Simitha, K.M., Raj, M.S. (2019). IoT and WSN based air quality monitoring and energy saving system in SmartCity project. In 2019 2nd International Conference on Intelligent Computing, Instrumentation and Control Technologies (ICICICT), Kannur, India, pp. 1431-1437. https://doi.org/10.1109/ICICICT46008.2019.8993151
[17] Abdullah, F.Y., Yaseen, M.T., Hussien, Y.M. (2021). Portable heartbeat rate monitoring system by WSN using LabVIEW. International Journal of Computing and Digital Systems, 10: 353-360. https://doi.org/10.12785/ijcds/100135.
[18] Mullick, A., Abd Rahman, A.H., Dahnil, D.P., Noraini, N.M.R. (2022). Enhancing data transmission in duct air quality monitoring using mesh network strategy for LoRa. PeerJ Computer Science, 8: e939. https://doi.org/10.7717/peerj-cs.939
[19] Jabbar, W.A., Subramaniam, T., Ong, A.E., Shu'Ib, M.I., Wu, W., de Oliveira, M.A. (2022). LoRaWAN-based IoT system implementation for long-range outdoor air quality monitoring. Internet of Things, 19: 100540. https://doi.org/10.1016/j.iot.2022.100540
[20] Griva, A., Boursianis, A.D., Wan, S., Sarigiannidis, P., Karagiannidis, G., Goudos, S.K. (2021). Performance evaluation of LoRa networks in an open field cultivation scenario. In 2021 10th International Conference on Modern Circuits and Systems Technologies (MOCAST), Thessaloniki, Greece, pp. 1-5. https://doi.org/10.1109/MOCAST52088.2021.9493416