Zeena M. Alomari*![]() | Thair J. Alfatlawi
| Thair J. Alfatlawi![]()
© 2024 The authors. This article is published by IIETA and is licensed under the CC BY 4.0 license (http://creativecommons.org/licenses/by/4.0/).
OPEN ACCESS
This research explores the effectiveness of a cutting-edge smart irrigation sprinkler system, which boasts an adjustable water distribution feature. Utilizing a technique known as nozzle-pulsing combined with a variable-speed control mechanism, the system is capable of varying its water discharge rates. The evaluation encompassed measuring flow rates for both the system as a whole and its individual nozzles, as well as assessing travel speed and the uniformity and precision in water delivery. Performance metrics such as CU, DUlq, CV, MAE, MBE, and NRMSE were employed to determine the irrigation system's distribution uniformity and application accuracy. Field testing was conducted in the months of August and September 2023, under varying wind conditions with careful timing to reduce evaporative losses. The prevailing weather conditions were characterized by an absence of rainfall, with ambient temperatures ranging from 25 to 38°C and relative humidity spanning 9 to 35%. Results revealed that the system adeptly modulated irrigation rates between 0 to 25 mm and altered travel speeds from 0 to 3 m/min. The implementation of pulsing to deliver variable volumes of water exerted a negligible effect on the nozzle flow rates, evidenced by an average application error below 6%. The smart sprinkler system achieved an average CU of 89.7% versus 83.8%, an average DUlq of 87.0% versus 76.8%, and an average NRMSE of 19.33% versus 25.84%, paralleling the performance of traditional systems. The study concluded that the described Variable Rate Irrigation (VRI) system is capable of matching the precision and consistency of Constant Rate Irrigation (CRI) systems. The water distribution's consistency and precision were found to be statistically unaffected by the sprinkler cycling rate, cycle duration, or system movement speed (P > 0.05). This opens the door to more accurate and consistent irrigation scheduling for agricultural applications using a novel lateral-move irrigation system endowed with VRI technology, which is vital for water-efficient irrigation practices. This finding underscores the potential of variable-rate sprinkler irrigation as a tool to enhance water management strategies.
sprinkler irrigation, constant-rate irrigation, variable-rate irrigation, pulse on/off, performance criteria, water application uniformity, irrigation accuracy, water productivity
The strain on freshwater resources is exacerbated by a confluence of factors including pollution, burgeoning populations, and the perturbations of climate change, with the latter notably marked by global warming. As global temperatures ascend, the delicate equilibrium between water availability and demand becomes increasingly tenuous, underscoring the necessity for innovative solutions-particularly within the agricultural sector where water use is prodigious. In the face of urbanization's encroachment on water supplies, the optimization of irrigation efficiency transcends mere importance; it becomes imperative.
Self-propelled sprinkler irrigation systems, encompassing center pivots and lateral moves, have revolutionized the irrigation of over 12.5 million hectares-surpassing traditional methods such as flooding [1-3]. These systems aim to distribute water uniformly across farmlands to compensate for soil moisture deficits. Suboptimal irrigation practices can lead to low yields and crop water stress, while over-irrigation risks environmental pollution through nutrient leaching, soil erosion, runoff, deep percolation, and oxygen stress. Uneven water distribution can result in disparate yields and economic returns across an irrigated field. Consequently, addressing irrigation uniformity and minimizing water losses should be at the forefront of irrigation system design and management [4].
Efforts to curtail surface runoff under moving sprinkler systems have focused on improving soil infiltration rates and surface storage capacity through specific tillage practices and the addition of soil surface amendments [5]. While these measures may not eradicate runoff, they can significantly mitigate it. Alternatively, other studies aim to reduce surface runoff by decreasing the sprinkler discharge rate or the machine's travel speed [6]. However, these approaches do not always achieve the lowest possible runoff and often result in reduced application depths per irrigation pass. Moreover, particularly at minimal irrigation depths, these methods may adversely affect distribution uniformity, leading to inconsistent water distribution [7].
Variable-rate irrigation (VRI) is a burgeoning field, addressing the nuanced agricultural needs associated with land irrigation. This advanced technology facilitates optimal plant growth by adjusting water flow or activation to match the heterogeneity of field segments [8-11]. VRI, when integrated with sensing technology and adept water management into existing irrigation frameworks, can distribute water more judiciously, accommodating soil texture and moisture absorption disparities. The potential benefits include heightened water and energy efficiency and bolstered crop yields [12-15].
The advanced automation of self-propelled sprinkler systems lends itself well to the adoption of VRI [16, 17]. In addition, VRI can mitigate runoff, soil erosion, and sedimentation in vulnerable areas such as slopes and valleys. In contrast, constant-rate irrigation systems often lead farmers to tailor their irrigation strategies to the driest sections of the field or to place soil moisture sensors in areas with the lowest water holding capacity, to prevent any portion of the land from being under-irrigated [18]. By accommodating the temporal and spatial variations in soil and crop characteristics within a field, VRI can optimize crop yields by averting both over- and under-irrigation [19].
The water application rate in VRI can be modulated by zone control-altering the water emitted through sprinkler nozzles-or by sector control-varying the speed of the moving irrigation system across the field. The homogeneity of sprinkler irrigation within each management zone under VRI is a critical determinant of crop growth and yield [20-25]. Implementing VRI through the use of different nozzle sizes on a moving sprinkler irrigation system represents another straightforward and cost-effective strategy [26]. The simulation study by Zhou et al. [27] highlights that slower movement or shorter pulsing intervals can enhance application uniformity, albeit with a potential increase in depth application errors.
For VRI systems, precision and consistency in water depth application are paramount, as system accuracy is a key determinant of irrigation efficiency-higher accuracy equates to enhanced efficiency. The accuracy and consistency of VRI can be influenced by a myriad of factors, including operational management, weather conditions, and equipment components [3, 7, 19, 25, 28-34]. It's important to note that the all-irrigation system, especially the sprinkler method, was suggested by ISO standards 2009 (ISO 11545-2009) and Chinese standards (GB/T 19797-2012), along with ASABE Standards, 2016 (ASAE S436.1).
The advent of Variable-Rate Irrigation (VRI) technology heralds a new era in precision agriculture, though its nascent stage presents a slew of challenges that necessitate resolution. One critical question pertains to the uniformity of water application when an irrigation system employs sprinklers that cycle on and off to deliver varied rates of application. Given the paramount importance of high application uniformity for effective irrigation, it is essential that VRI systems offer a level of uniformity that is on par with, if not superior to, that of traditional constant rate irrigation systems.
The central objective of this study was to design and evaluate both the hardware and software components of a smart variable-rate sprinkler system (SVRSS). The key focus was to scrutinize both the uniformity and the depth of water application, ensuring precision irrigation across the entire span of the lateral for both constant and variable application depths, without compromising the integrity of the irrigation process.
2.1 Design and development of the smart variable rate sprinkler system (SVRSS)
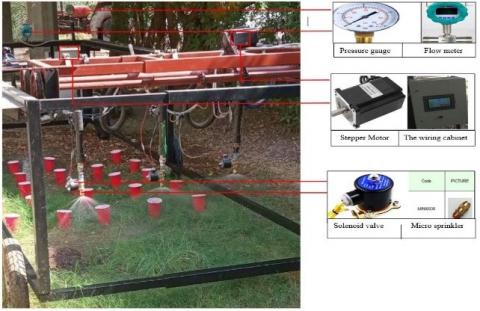
Concerning the mechatronics system, the system consists of machine frames, a watering mechanism, and a graphical user interface, in addition to the actuator. A motorized farm buggy was developed in the fluid mechanics laboratory of the Faculty of Civil Engineering, University of Babylon, and equipped with smart variable rate sprayer accessories. The machine involves black support frames made from iron beside herringbone-patterned wheels merged and assembled. The smart variable rate sprinkler system (SVRSS) is height and width adjustable. The buggy was installed 1 m above the ground surface with 0.50 m of adjustability to accommodate variations in the height of the sprinkler. Each sprinkler outlet pipe was equipped with a micro sprinkler with an approximate height of 0.5 m above ground level. The buggy was 1.5 m wide with 0.50 m of adjustability to accommodate the distance between any two spray heads. The buggy length was made of 5 m to provide a wide space for work. The buggy is provided with equipment that is listed in the Table 1 below and labeled in Figure 1.
Figure 1. The smart variable rate sprinkler system (SVRSS) with its equipment and accessories
Table 1. The various components details utilized in a smart variable rate sprinkler
|
No. |
Equipment |
Specification |
No. |
Equipment |
Specification |
|
1 |
Human Machine Interface (HMI)/ PLC |
HMI: Adopts CoolMay HMI touchscreen programming software. PLC: Compatible with Mitsubishi Works 2/ GX Developer 8.86. |
7 |
Stepper Motor |
HANPOSE - Stepper Motor (Nema 34) Torque 8 Nm 6A Shaft 14mm (34HS11860) |
|
2 |
Relay module |
CHNT Small Electromagnetic Relay with Test Button NJDC-12/3Z 7.5A 28VDC |
8 |
DC Stepper Motor Driver |
Motor Driver Stepper DM556 Hanpose Nema 34 CNC Bipolar |
|
3 |
Three solenoid valves |
Baomain 1/2-inch, Brass Solenoid Valve DC 12 V |
9 |
Supply tank |
250L |
|
4 |
Pressure control valve |
Water Pressure Regulator Valve |
10 |
Power supply |
S-60-12 60W 12VDC 5A |
|
5 |
Three nozzles |
MINI0038 Micro sprinkler 0.8-1.5m3/h, 3-6m wetted diameter |
11 |
Pump |
A 0.37 kW electric pump 30 L/min |
|
6 |
Flow meter |
LWGY-25C105SSNNC, range 1–10 m3/ h, accuracy of 0.5% |
12 |
Pressure gauge |
Gesa,M0301D63R10BR4GGE, range 0–60 PSi, accuracy of 0.5% |
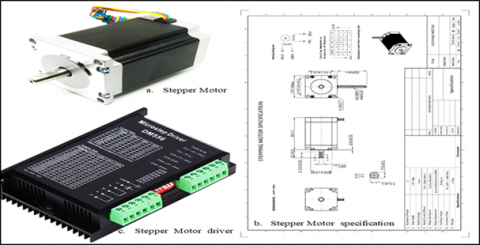
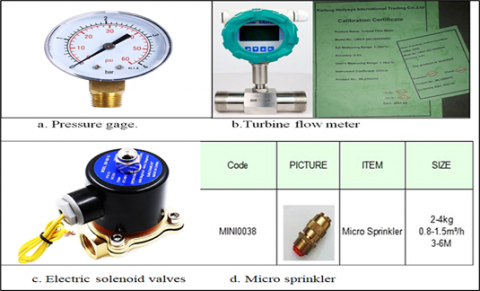
Stepper motors and DC stepper motor drivers are electronic devices that modify the input power to generate a pulsed, or "stepped," current output (refer to Figure 2). The DC stepper motor driver, frequently integrated with the drive circuits, transmits control signals to the drive. These systems are used to regulate motor speeds, torques, and positions. A stepper motor was used to control the speed of the smart variable-rate sprinkler system. Multiphase induction motor drives, offering advantages over standard three phase systems like increased torque density, decreased torque pulsation, and fault-tolerance capacity, have gained significant attention recently [35, 36]. The system constantly monitored the inlet pressure and flow rate using a pressure gauge (Gesa, M0301D63R10BR4GGE, range 0–60 PSI, accuracy of 0.5%) and a turbine flow meter (LWGY 25C105SSNNC, range 1–10 m3/h, accuracy of 0.5%) respectively. The turbine flow meter came with a calibration certificate, as shown in Figure 3. A 0.37 kW electric pump was connected to the water supply pipe, and a 25 mm external diameter PVC pipe was used to carry water to the micro spray sprinkler. The water source was a 250L capacity reservoir. The smart variable rate sprinkler system had software for creating a Variable Rate Irrigation plan and various hardware components. The main hardware devices included a programmable logic controller (PLC) (QM3G-70KFH-24MR, Coolmay, Shenzhen), electronic solenoid valves (Baomain 1/2-inch brass electric solenoid valve water DC 12V N/C), and hydraulic valves connected between the lateral pipe and each drop pipe. Additional hydraulic valves were installed as needed to regulate the water supply during the experiments. Three electric solenoid valves were used to control the activation and deactivation of the micro-nozzles, responding to signals from the control system. Each drop pipe was fitted with a solenoid valve at the junction with the micro sprinkler (specifically, the MINID038 model, weighing 2-4 kg, with a flow rate of 0.8–1.5 m3/h, and a wetted diameter of 3–6 m), as illustrated in Figure 3.
Figure 2. Stepper Motor and DC Stepper Motor Driver
Figure 3. Additional details of the smart variable-rate sprinkler system
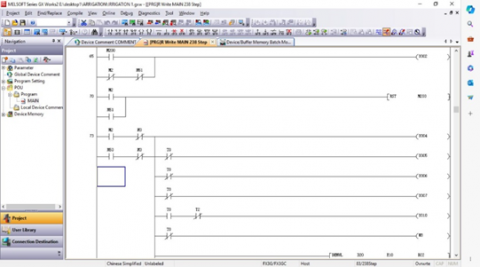
The smart variable rate sprinkler system (SVRSS) included both software for creating a Variable Rate Irrigation plan and hardware components. It used a Mitsubishi program logic controller (PLC) and a Human Machine Interface (HMI) data display along with a ladder line diagram program. (PLC) can broadly be defined as a technology that makes use of electrical power network transmission for data communication by leveraging already-installed electrical power transmission [37]. The programming was done using LabVIEW, a graphical language program developed by National Instruments, as shown in Figure 4. LabVIEW, short for Laboratory Virtual Instrumentation Engineering Workbench, is a program development application similar to various C or BASIC software tools. However, it differs significantly from these applications. LabVIEW uses a graphical language (G) to create programs in block diagram form, while other programming tools use text-based languages. LabVIEW includes libraries of functions and development tools specifically designed for instrument control. It also has application-specific libraries for data acquisition, serial instrument control, data analysis, data presentation, and data storage [38-40].
Figure 4. Schematic of the PLC program used to implement the irrigation strategy
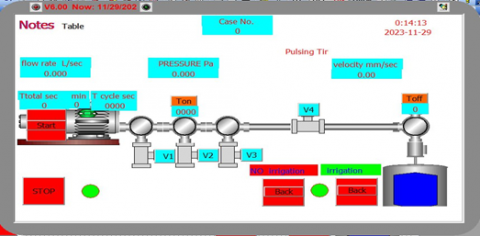
The Human Machine Interface (HMI) displays the status of each sprinkler, the cycle time (CT) setting (seconds) and duty cycle (DC) (%) of solenoid valves, the travel speed setting, the direction of travel, and the total time it takes to perform each single irrigation process as shown in Figure 5.
Figure 5. The software control interface of the variable-rate irrigation system
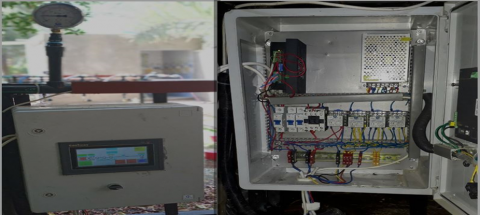
Figure 6. The control cabinet of the smart variable rate sprayer system (SVRSS)
Coolmay's HMI/PLC all-in-one machine performs the following functions:
The PLC, along with the relay expansion modules, was installed in the control cabinet. The controller relay modules activated a brass solenoid valve, regulating the "on/off" cycle of each solenoid valve, such as DC and CT.
It calculates the system's speed and sends control signals to the driving motor, which, in turn, regulates the irrigation pulsing rate. For variable-rate irrigation, the forward/backward speed can be set to any value between 0 and 3.5m/min in the control program.
It keeps track of the total time taken for each individual irrigation process.
Using the controller relay module, a brass solenoid valve was activated to redirect the water back to the tank when the nozzles close during the spraying stop (off time), preventing water backflow towards the supply tank. It also maintains the flow towards the nozzles when they open at the start of spraying (on time).
The wiring cabinets for the PLC and add-ons were custom-built using plastic molding, as depicted in Figure 6.
2.2 Experimental design
2.2.1 Flow rates measurement
During the experiment, flow rates were determined. The nozzles of the sprinkler were located below a metal pipe, and for 30 seconds, the water flow was discharged into a bucket. A measuring cup with a 500 mL volume and 5 mL accuracy was used to measure the applied water in the bucket, and the flow rate was calculated as follows:
$Q=\frac{V}{T}$ (1)
where:
Q is the flow rate of the sprinkler (m3 h-1), V is the Volume of measured water (m3), and T is observed time (h).
2.2.2 Water distribution measurement
The VRI performance of an irrigation system was assessed in grids using constant irrigation rates of 25mm and 15mm to assess uniformity and accuracy. Grid measurements served as a model for a management zone with constant irrigation rates in order to assess the irrigation's uniformity and the water application's accuracy concerning the targeted water depths. Table 2 shows the results of VRI and CRI, where the cycle rates ranged from 25, 50, 75, and 100% using three linear speeds estimated at 11,17% and 33%. These were utilized for comparing the influence of various designed irrigation depths on the water distributions of each combination. The major methods for achieving these irrigation depths for each linear move travel speed/variable-rate combination involved modifying the solenoid valve's duty cycle (DC) and the system's percent timer setting (PTS). The value of DC is equal to 100% which means constant irrigation rate. When the DC is 25% of the cycle time of 60s means that 45s and 15s are turned off and on the solenoid valve [7]. To ensure the CT effect on the distribution of water for each linear speed/ variable-rate combination, cycle times of 30, 45, and 60 that considered in the VRI test. Regarding the CRI test, three sprinklers were utilized. The DC settings are set to 100% to ensure that the sprinkler used was filled during the irrigation. The PTSs values of the system chosen in the CRI test were 11, 17, and 33%, of depths of irrigation of 25, 15, and 8 mm respectively. This was done simultaneously to give a reference for VRI.
Table 2. Trials and applied water for uniformity testing of the smart variable rate sprinkler system
|
Method of Irrigation |
Number of Treatment |
PTSa (%) |
CT (s) |
DC (%) |
Depth of Irrigation (mm) |
|
Constant rate Irrigation |
C1 |
11 |
60 |
100 |
25 |
|
C2 |
17 |
60 |
100 |
15 |
|
|
C3 |
33 |
60 |
100 |
8 |
|
|
Variable Rate Irrigation |
V11 |
11 |
60 |
25,50,75,100 |
6.25,12.5,18.75,25 |
|
V12 |
11 |
45 |
25,50,75,100 |
6.25,12.5,18.75,25 |
|
|
V13 |
11 |
30 |
25,50,75,100 |
6.25,12.5,18.75,25 |
|
|
V21 |
17 |
60 |
25,50,75,100 |
3.75,7.51,1.25,15 |
|
|
V22 |
17 |
45 |
25,50,75,100 |
3.75,7.5,11.25,15 |
|
|
V23 |
17 |
30 |
25,50,75,100 |
3.75,7.5,11.25,15 |
|
|
V31 |
33 |
60 |
25,50,75,100 |
2,4,6,8 |
|
|
V32 |
33 |
45 |
25,50,75,100 |
2,4,6,8 |
|
|
V33 |
33 |
30 |
25,50,75,100 |
2,4,6,8 |
a PTS, percent timer setting (%); CT, cycling time (s); DC, duty cycle (%).
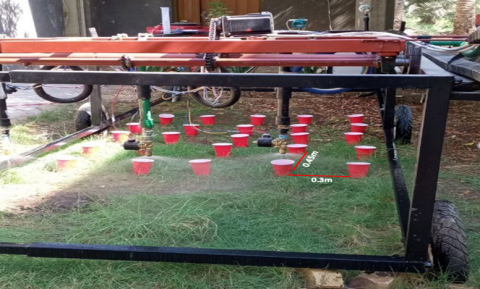
Figure 7. Layout of catch cans in the grid
The water that was applied was collected in catch cans. They were made of plastic and had an inverted cone form. 25 catch cans, each measuring 115 mm in height and 95 mm in opening diameter, were evenly spaced out in a 5×5 grid (Figure 7). The number of catch cans is crucial for understanding water distribution uniformity in an irrigated field. Considerations for determining the value of (n) include field size and configuration, spatial variability, the number of nozzles, nozzle pattern and distribution, practical constraints, and historical data and experience [41].
After the spraying test, a 500 mL measuring cylinder with 5 mL precision was used to measure the applied water in the catch cans. The catch can's cross-sectional area was divided to convert the read data to an average irrigation depth. To reduce evaporation, most tests were carried out in the morning and evening, as shown in Table 3. Additionally, rain (R = 0), average air temperature, and relative humidity were between 25 and 38 °C and 9 and 35%, respectively. A moving superposed water quantity verification test was done to ensure the model's correctness. After starting the system's movement operation and operating for longer than five minutes at working pressure, test results were collected., taking into consideration the possibility that the work at the beginning of the SVRSS may not be steady. This assumption was based on previous studies [42, 43] that adopted the operating method for a period of not less than 5 minutes and not more than 15 minutes before collecting the test data. Tests were conducted under low wind conditions (5 m/s), as advised by ASABE Standards (ASABE Standards 2016).
Table 3. Average weather data was observed during the experiment
|
Treatment Number |
Date |
Time |
Ra (mm) |
T (℃) |
RH (%) |
WS (m/s) |
|
C1 |
8/8/2023 |
4:30-6:30 |
0 |
36 |
11 |
3.6 |
|
C2 |
8/8/2023 |
6:30-8:30 |
0 |
38 |
11 |
3.6 |
|
C3 |
18/9/2023 |
6:30-8:30 |
0 |
25 |
13 |
4.3 |
|
V11 |
9/8/2023 |
7:30-8:30 |
0 |
36 |
12 |
3.6 |
|
V12 |
19/8/2023 |
8:30-10:00 |
0 |
34 |
12 |
2.8 |
|
V13 |
20/8/2023 |
8:30-9:30 |
0 |
34 |
11 |
3.6 |
|
V21 |
2/9/2023 |
6:30-8:30 |
0 |
30 |
10 |
4.3 |
|
V22 |
3/9/2023 |
4:30-6:30 |
0 |
31 |
9 |
4.63 |
|
V23 |
3/9/2023 |
6:30-8:30 |
0 |
31 |
9 |
4.63 |
|
V31 |
14/9/2023 |
4:30-6:30 |
0 |
30 |
35 |
4.63 |
|
V32 |
14/9/2023 |
6:30-8:30 |
0 |
34 |
35 |
4.63 |
|
V33 |
15/9/2023 |
4:30-6:30 |
0 |
30 |
34 |
3.6 |
aR, rainfall (mm); T, temperature (℃); RH, relative humidity (%); WS, wind speed (m/s)
2.2.3 Irrigation uniformity and accuracy calculation
Uniformity coefficients were used to evaluate the homogeneity of the water distribution as a consequence of the catch cans' water depth data. In this research, the CU %, the low quarter DU, and the coefficient of variation (CV) were all used. The International Standard Organization (ISO 11545:2009) and the American Society of Agricultural and Biological Engineers (ASAE S436.1) define a method for assessing the uniformity of water distribution in the field from center-pivot and moving lateral irrigation machines equipped with sprayer or sprinkler nozzles. The catch can test and ASABE Standard S436.1 criteria are commonly used.
The CU (%) developed by Christiansen [44] is calculated using the following equation:
$\mathrm{CU}=\left(1-\frac{\sum_{i=1}^n\left|x_i-\bar{x}\right|}{n \bar{x}}\right) \times 100 \%$ (2)
Another typical metric that measures the homogeneity of self-propelled systems is the lower quarter distribution uniformity coefficient (DUlq) [7]. When the water depths at individual measuring points are significantly lower than the average value or even zero, this indicator can make up for the CU's faulty uniformity forecast. As following were used to determine the DUlq:
DUlq $=\frac{\sum_{i=1}^n \bar{x}_{l q}}{\bar{x}} \times 100 \%$ (3)
where, CU refers to the irrigation uniformity coefficient, DUlq is the lower quarter distribution uniformity coefficient of irrigation, xi is the application depth of point i, mm, DUlq is an average of the lowest one-fourth of catch can measurement, mm, $\bar{x}$ is the area's average application depth in millimeters, and n is the total number of computed points utilized in the evaluation.
The variation coefficient (CV) [45] was utilized to assess the degree of dispersion of water levels captured by-catch cans in the direction of lateral motion:
$\mathrm{CV}=\frac{\sqrt{\frac{\sum_{i=1}^n\left(x_i-\bar{x}\right)^2}{n}}}{\bar{x}} \times 100 \%$ (4)
The accuracy was assessed by the following methods:
To determine how well the observed water depths matched the intended depths in various linear move travel speed/variable-rate combinations, the mean absolute error (MAE) was used [46].
MAE $=\frac{\sum_{i=1}^n\left|P-x_i\right|}{n}$ (5)
where, P is the designed water depth (mm).
The mean bias error (MBE) (Eq. (6)) was utilized to assess the accuracy of the irrigation system's assessment of water depths [31]:
MBE $=\frac{\sum_{i=1}^n\left(P-x_i\right)}{n}$ (6)
The normalized root mean square error (NRMSE) reflects the relative error between the designed and measured irrigation depths [47]:
NRMSE $=\frac{\sqrt{\frac{\sum_{i=1}^n\left(P-x_i\right)^2}{n}}}{\bar{x}} \times 100 \%$ (7)
3.1 Sprinkler irrigation nozzle flow rates measured
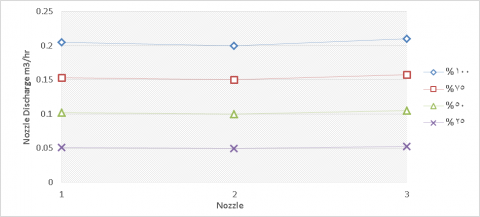
Figure 8. Effects of pulsing on nozzles discharge
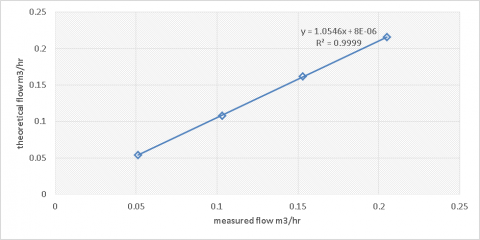
Figure 9. Relationship between theoretical flow and measured flow of nozzle
The nozzle-pulsing method was put to the test to make sure it provided the right volume of irrigation water. Based on the 60s on/off cycle, tests were conducted for nozzle ON times of 100%, 75%, 50%, and 25%. For instance, nozzles will pulse for 15 seconds ON and 45 seconds OFF at a 25% ratio. A bucket was used to collect the water for 30 seconds while the nozzles pulsed On and OFF. For every nozzle ON time rate, flow rates were computed. Figure 8 displays the output from each nozzle at various pulse speeds. For 100%, 75%, 50%, and 25% of the nozzle ON time, respectively, the nozzles produced an average flow of 0.205, 0.153, 0.103 and 0.051 m3/h. For all rates, the average water application rate inaccuracy was under 6%. The observed flow and nozzle theoretical flow had a very high correlation (R2 = 0.9999), as seen in the Figure 9. From the aforementioned analysis, it was found that the pulsing technique to deliver variable amounts of irrigation had little adverse effect on nozzle flow rate.
3.2 Assessing the consistency of water application in irrigation system
3.2.1 Evaluating the consistency of irrigation under constant rate irrigation (CRI)
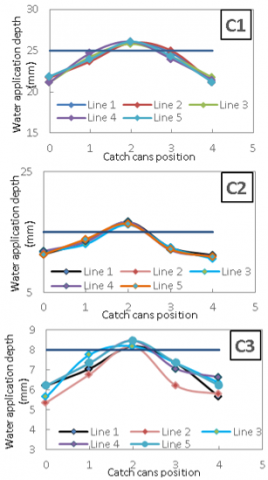
According to Takács et al. [32], the distribution of water plays a crucial role in determining the uniformity of irrigation in linear move irrigation systems. A volumetric flask was utilized to measure the depth of water application (in mm) collected in each catch can, which was used to analyze the distribution of constant rate irrigation (CRI) with three different percent time settings (PTSs), as shown in Figure 10. C1, C2, and C3 correspond to the percent timer settings of 11%, 17%, and 33% under CRI. Figure 10 demonstrates the water distribution patterns of CRI with three PTSs in a grid experiment. It is evident that there is variability in irrigation depths, leading to both underirrigated and overirrigated areas, regardless of the PTSs of the system. The desired irrigation depth is indicated by a horizontal line. This is probably due to the weather conditions. The combined results of the irrigation test for water depths in a model management zone with a constant irrigation rate are shown in Table 4 for CU, DUlq, and CV. For the various (SVRSS) speeds, it appeared that the application depth decreased as the (SVRSS) speed increased, which could be understood easily. However, according to ANOVA single factor analysis (P>0.05), it was noted that the CU, DUlq, and CV values did not suffer obvious differences at various speeds. These results revealed that the irrigation machine's travel speed had no bearing on the regularity of water distribution under CRI, which was similar to the findings [24, 33, 48]. Liu et al. [42] studied a linear-move sprinkler irrigation system in an indoor laboratory, obtaining application depth and CU under different speed conditions. CU values ranging from 84.5% to 89.8% did not linearly relate to the linear-move sprinkler irrigation system speed, which gave a similar trend to that in this study.
In order to assess the irrigation accuracy of the constant rate irrigation method, MAE, MBE, and NRMSE% were calculated and shown in Table 4. The obtained MAE values ranged from 1.1 to 2.6 mm, the MBE was also ranging from 1 to 2.1mm, and NRMSE% ranged from 6% to 32%. Table 4 shows positive MBE values, indicating insufficient irrigation in selected CRI treatments. This was mostly because the low wind and high instantaneous wind would still result in some wind drift and evaporative losses. Playán et al. [49] found that the irrigation system's mean wind drift and evaporative losses were 3.3%, despite average wind speeds below 1 m/s. According to Ortiz et al. [50], the mean wind drift and evaporative losses under the average wind speeds of 1.4-6.2 m/s were 9.2% and 13.6% for fixed spray plates and 8.2% and 12.5% for rotated spray plates at the heights of 1 and 2.5 m/s, respectively. The size of the catch can, the sprinkler height, the sprinkler space, and inaccurate measurement, all had an impact on the genuine irrigation depths. The results published [31, 33] were consistent with the NRMSE and MBE values in the current study. Szabó et al. [34] measured low accuracy values for constant rate irrigation, ranging from 6% to 11% NRMSE, 0.03 to 0.3 mm MBE, and 0.5 to 0.7 mm MAE. In this instance, the usage of various sprinklers and the height of catch cans above the soil may be primarily responsible for the lower values compared to this study.
Table 4. Results of the grid experiment on the irrigation accuracy and uniformity
|
Treatment Number |
CU % |
DUlq % |
CV % |
MAE (mm) |
MBE (mm) |
NRMSE % |
|
C1 |
93.4 |
92.5 |
6.9 |
1.9 |
1.5 |
11.7 |
|
C2 |
87.4 |
84.9 |
14.9 |
2.6 |
2.1 |
32.0 |
|
C3 |
88.5 |
83.8 |
6.09 |
1.1 |
1.0 |
14.3 |
Figure 10. Water distribution pattern in various constant rate irrigation situations
3.2.2 Evaluation of uniformity of irrigation under Variable Rate Irrigation (VRI)
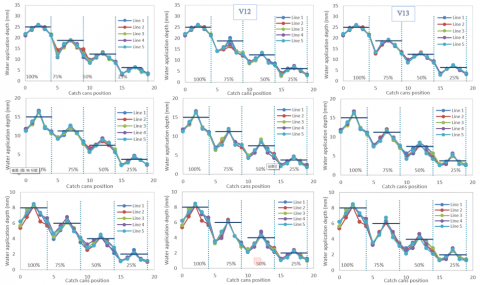
The VRI systems' water distribution characteristics are a key metric for assessing the uniformity of irrigation across various variable sprinkler rate settings. At rates of 100, 75, 50, and 25% of VRI, with three sets of specified irrigation depths and three cycle periods, the variable sprinkler rate settings in the testing area were put to the test. The cycle times of V11, V12, and V13 correspond to irrigation cycles lasting 60, 45, and 30 seconds with irrigation depths of 6.25, 12.5, 18.75, and 25 mm; V21, V22, and V23 correspond to irrigation cycles lasting 60, 45, and 30 seconds with irrigation depths of 3.75, 7.5, 11.25, and 15 mm; and V31, V32, and V33 correspond to irrigation cycles lasting 60, 45, and 30 seconds with irrigation depths of 2, 4, 6,8. The distribution of water in the four variable sprinkler rate settings is shown in Figure 11. The target irrigation depth is shown as a horizontal line. The influence of specific irrigation depth and CT on water distribution in four different variable sprinkler rate settings seems to have a minor effect (see Figure 11). According to Table 5, the CU, DUlq, and CV values for water depths at various variable sprinkler rates (%) ranged from 74.2-93.4%, 65.4-92.5%, and 6.9-22.2%, respectively, for (V11 to V13); 77-88.2%, 67.4-84.4%, and 9.4-17.7%, respectively, for (V21 to V23); and 77.1-88.5%, 69.4-83.8%, and 6-13.9%, respectively, for (V31 to V33). It is evident from Table 5 that the average CU of VRI decreased (89.7% vs. 83.8%) and the average DUlq decreased (87.0% vs. 76.8%) compared to those of CRI in Table 4. This result agreed with findings of Hui et al. and O'Shaughnessy et al. [33, 46]. In contrast, Clark et al. [51] measured good uniformity performance (CU 90%), corresponding with the results [22, 34]. According to their results, the CU% was larger than 90%. Different sprinkler packages (fixed vs. rotatable spray plates), sprinkler spacing and height, operating pressure, grid size, catch can form and size and their height above the soil are possible causes of this variation. The study found no significant differences in CU, DUlq, and CV values across different cycle times (P > 0.05), but application uniformity increased with longer cycles. Consequently, demonstrates high similarity with the experimental findings of Dukes and Perry [7]. All other studies reported for VRI systems use a duty cycle of 60 s. In the context of future Variable Rate Irrigation (VRI) projects, a recommended cycle time of 60 seconds serves the purpose of diminishing the switching frequency of the solenoid valve. This strategy will aim to minimize the number of pulses, thereby safeguarding the long-term sustainability of the mechanical components of the solenoid valve. Optimizing irrigation cycle times enhances water use efficiency, and promotes sustainable management. Technology and expensive equipment are necessary for implementing recommended cycle times. The study found that the mean CU and DUlq decreased in variable sprinkler rate (duty cycle = 25%) as compared with the mean CU and DUlq in irrigation variable sprinkler rate pulsing at duty cycle above 50%. This is consistent with previous research [7, 21]. The reason may be due to the diameter of the nozzle (as smaller diameter nozzles produce smaller drops prone to evaporative losses and wind drift) [52].
3.2.3 Assessing the precision of depth measurement in Variable Rate Irrigation (VRI)
In Table 5, the combined results for MAE, MBE, and NRMSE of variable sprinkler rate settings at 25, 50, 75, and 100% cycle rates are presented. Significant differences in water depths were observed across the variable sprinkler rate settings, indicating effective performance of the VRI system. Moreover, the intended irrigation levels of the variable sprinkler rate settings were found to be distinct in all cases. To evaluate the accuracy of irrigation for each variable sprinkler rate setting, the deviation from the set level was analyzed. The measured water depths in the catch cans were slightly lower than the planned irrigation water depths for all variable sprinkler rate settings. The average NRMSEs of the irrigation depths for different treatments were 19.3%, 34.5%, 26.5%, and 23.06%, respectively. The greater losses of irrigation collectors pulsated at a rate of 75%. The insufficient superposition of irrigation water and wind conditions was one potential explanation for this performance. In addition, neither the sets of specified irrigation depths nor the cycle times showed any variations in any of the water depths' MAE, MBE, or NRMSE that were significant (P > 0.05). This provided an indirect explanation for why adjustments to the percent time setting, cycle times, and variable sprinkler rate settings had little to no impact on irrigation accuracy, which was in line with the findings [33, 34, 45]. According to the results, irrigation uniformity and accuracy were highly associated, and better irrigation uniformity led to higher accuracy, which is in line with the conclusions reached by Yari et al. [31].
Table 5. Results of accuracy of irrigation for variable rate conditions
|
Evaluation Indicator |
Variable Sprinkler Rate (%) |
V11 |
V12 |
V13 |
V21 |
V22 |
V23 |
V31 |
V32 |
V33 |
|
CU (%) |
100 75 50 25 |
93.4 85.4 86.7 78.5 |
93.4 89.7 85.5 76.0 |
93.4 86.4 87.5 74.2 |
87.4 88.2 86.0 77.0 |
87.4 84.5 80.4 77.5 |
87.4 85.7 82.8 77.7 |
88.5 86.0 83.6 77.1 |
88.5 80.2 79.1 77.7 |
88.5 79.2 80.0 77.7 |
|
DUlq (%) |
100 75 50 25 |
92.5 76.3 80.5 72.1 |
92.5 87.1 80.4 65.5 |
92.5 81.9 65.4 81.7 |
84.9 81.2 78.3 71.0 |
84.9 80.2 74.0 67.4 |
84.9 80.6 75.0 74.5 |
83.8 78.0 77.5 74.7 |
83.8 74.2 71.5 69.4 |
83.8 72.4 73.1 74.5 |
|
CV (%) |
100 75 50 25 |
6.9 22.1 12.8 14.0 |
6.9 12.4 15.6 18.9 |
6.9 17.3 11.0 21.3 |
14.9 10.1 9.4 11.3 |
14.9 15.7 17.7 12.3 |
14.9 13.5 12.8 13.4 |
6.0 7.0 6.2 6.1 |
6.0 13.7 10.4 6.0 |
6.0 13.9 8.8 6.7 |
|
MAE (mm) |
100 75 50 25 |
1.9 3.4 2.2 1.7 |
1.9 4.0 2.7 1.5 |
1.9 3.0 2.0 1.6 |
2.6 1.4 0.9 0.9 |
2.6 2.81 1.8 1.0 |
2.6 2.2 1.6 0.9 |
1.1 1.0 0.8 0.6 |
1.1 1.8 1.1 0.5 |
1.1 1.6 0.9 0.5 |
|
MBE (mm) |
100 75 50 25 |
1.5 3.3 1.9 1.6 |
1.5 3.9 2.5 1.2 |
1.5 2.9 1.8 1.3 |
2.1 1.0 0.2 0.6 |
2.1 2.7 1.4 0.6 |
2.1 2.0 1.3 0.3 |
1.0 0.9 0.6 0.5 |
1.0 1.7 0.9 0.4 |
1.0 1.5 0.8 0.2 |
|
NRMSE (%) |
100 75 43.0 25 |
11.7 39.5 31.7 43.9 |
11.7 35.3 48.6 34.0 |
11.7 44.3 27.3 38.6 |
32.0 15.0 10.0 17.1 |
32.0 39.2 34.6 19.9 |
32.0 37.5 28.7 15.1 |
14.3 15.7 13.5 17.5 |
14.3 44.4 25.5 12.3 |
14.3 39.7 19.3 9.2 |
Figure 11. Water distribution pattern under different Variable Rate Irrigation conditions
The integration of the VRI system with existing irrigation technologies involves a holistic approach that incorporates precision application with sensor integration, data analytics and decision support systems, automation and remote monitoring, compatibility with diverse irrigation methods, and adaptability to ensure optimal water management in agriculture. Researchers developed, tested, and assessed a smart sprinkler system with adjustable water delivery rates in a controlled laboratory environment. The main goal was to analyze the flow rates of the entire system and individual nozzles, the travel speed, and the consistency and accuracy of water distribution across the entire irrigation area, considering both fixed and variable water depths. The system comprises solenoid valves, solid-state relays, and a mechanism for controlling forward and reverse speed, all managed by a programmable logic controller (PLC). To enhance the sprinkler's performance, the nozzles, valves, and speed settings were calibrated. Testing revealed that the typical error in water application was less than 6% during nozzle pulsing. Various water depths were used to evaluate the performance of the Smart Variable Rate Sprinkler System (SVRSS) at both fixed and variable application depths. The constant and variable sprinkler rate settings were tested along the lateral pipe of the SVRSS. Multiple catch-can experiments were carried out to assess the consistency and accuracy of the SVRSS application. These tests were conducted in an area with an average wind speed of less than 5 m/s. The results demonstrated that the water could be pulsed on and off to achieve any specified application rate using the programmable logic controller (PLC). Moreover, tests for uniformity demonstrate that the system is capable of regulating the irrigation rate from 0 to 25mm of water and controlling the forward and backward speed between 0 to 3 m/min. The average Coefficient of Uniformity (CU) (89.7% vs. 83.8%), average Distribution Uniformity (DUlq) (87.0% vs. 76.8%), and average Normalized Root Mean Square Error (NRMSE) (19.33% vs. 25.84%) of Variable Rate Irrigation (VRI) were similar to those of Constant Rate Irrigation (CRI). The results indicate that the VRI system described in this study could achieve the same level of accuracy and uniformity in irrigation as the CRI system. The uniformity and precision of water application were not significantly impacted by the sprinkler cycling rate, cycle periods, or system movement speed (P > 0.05). This finding promotes the advancement of variable-rate sprinkler irrigation as a strategy for improved water management. The electrically actuated variable rate mechanism for Soil Variable Rate Sprinkler System (SVRSS) utilized many easily accessible components. However, the use of electric solenoid valves led to some delay in opening and closing the valve due to the operational time of the valve mechanism. This delay may result in reduced uniformity compared to the constant rate method. This limitation could have practical implications for precision agriculture practices. The delayed response of the valve mechanism may compromise the precise control expected in VRI systems, potentially leading to suboptimal water distribution across different zones within the irrigation field. The variability in irrigation timing may consequently affect crop health, potentially resulting in uneven growth patterns or, in extreme cases, inadequate water supply to certain regions. Further investigations are warranted to assess and compare the uniformity of water distribution on both surface and subsurface levels. This evaluation should extend across diverse design parameters and field conditions, including considerations such as the impact of sprinkler design parameters (such as diameter, hydraulic characteristics, height, and nozzle spacing), the manner in which water is applied by sprinklers (above canopy or within canopy), the influence of soil type, and the effects of initial moisture content. These aspects collectively contribute to a comprehensive understanding of the efficacy and performance of the nozzle-pulsing method and variable-speed control system in varied agricultural settings.
[1] Sheffer, C. (1971). The Conditions of Agricultural Growth: The Economics of Agrarian Change under Population Pressure. Routledge. https://doi.org/10.2307/277729
[2] Lamm, F.R., Bordovsky, J.P., Howell Sr, T.A. (2019). A review of in-canopy and near-canopy sprinkler irrigation concepts. Transactions of the Asabe, 62(5): 1355-1364. https//doi.org/10.13031/trans.13229
[3] Al Al-Baaj, A.A., Lewis, A. (2019). Variable pulsed irrigation algorithm (VPIA) to reduce runoff losses under a low-pressure lateral move irrigation machine. Horticulturae, 5(1): 10. https://doi.org/10.3390/horticulturae5010010
[4] Roth, G., Harris, G., Gillies, M., Montgomery, J., Wigginton, D. (2013). Water-use efficiency and productivity trends in Australian irrigated cotton: A review. Crop and Pasture Science, 64(12): 1033-1048. https://doi.org/10.1071/CP13315
[5] Silva, L.L. (2017). Are basin and reservoir tillage effective techniques to reduce runoff under sprinkler irrigation in Mediterranean conditions?. Agricultural Water Management, 191: 50-56. https://doi.org/10.1016/j.agwat.2017.06.003
[6] Silva, L.L. (2006). The effect of spray head sprinklers with different deflector plates on irrigation uniformity, runoff and sediment yield in a Mediterranean soil. Agricultural Water Management, 85(3): 243-252. https://doi.org/10.1016/j.agwat.2006.05.006
[7] Dukes, M.D., Perry, C. (2006). Uniformity testing of variable-rate center pivot irrigation control systems. Precision Agriculture, 7(3): 205-218. https://doi.org/10.1007/s11119-006-9020-y
[8] Yan, H., Hui, X., Li, M., Xu, Y., 2020. Development in sprinkler irrigation technology in China. Irrigation and Drainage, 69: 75-87. https://doi.org/10.1002/ird.2435
[9] Hussain, N., Farooque, A.A., Schumann, A.W., McKenzie-Gopsill, A., Esau, T., Abbas, F., Acharya, B., Zaman, Q. (2020). Design and development of a smart variable rate sprayer using deep learning. Remote Sensing, 12(24): 4091. https://doi.org/10.3390/rs12244091
[10] Farooque, A.A., Hussain, N., Schumann, A. W., Abbas, F., Afzaal, H., McKenzie-Gopsill, A., Esau, T., Zaman, Q., Wang, X. (2023). Field evaluation of a deep learning-based smart variable-rate sprayer for targeted application of agrochemicals. Smart Agricultural Technology, 3: 100073. https://doi.org/10.1016/j.atech.2022.100073
[11] Li, M., Wang, Y., Guo, H., Ding, F., Yan, H. (2023). Evaluation of variable rate irrigation management in forage crops: Saving water and increasing water productivity. Agricultural Water Management, 275: 108020
[12] Hedley, C.B., Yule, I.J., Tuohy, M.P., Vogeler, I. (2009). Key performance indicators for simulated variable-rate irrigation of variable soils in humid regions. Transactions of the ASABE, 52(5): 1575-1584. https://doi.org/10.13031/2013.29146
[13] Vories, E., Rhine, M., Straatmann, Z. (2017). Investigating irrigation scheduling for rice using variable rate irrigation. Agricultural Water Management, 179: 314-323. https://doi.org/10.1016/j.agwat.2016.05.032
[14] Barker, J.B., Heeren, D.M., Neale, C.M.U., Rudnick, D.R. (2018). Evaluation of variable rate irrigation using a remote sensing-based model. Agricultural Water Management, 203: 63-74. https://doi.org/10.1016/j.agwat.2018.02.022
[15] Sharma, V., Irmak, S. (2020). Economic comparisons of variable rate irrigation and fertigation with fixed (uniform) rate irrigation and fertigation and pre-plant fertilizer management for maize in three soils. Agricultural Water Management, 240: 106307. https://doi.org/10.1016/j.agwat.2020.106307
[16] Sui, R., Yan, H. (2017). Field study of variable rate irrigation management in humid climates. Irrigation and Drainage, 66(3): 327-339. https://doi.org/10.1002/ird.2111
[17] Andrade, M.A., O’Shaughnessy, S.A., Evett, S.R. (2020). ARSPivot, A sensor-based decision support software for variable-rate irrigation center pivot systems: Part A. Development. Transactions of the ASABE, 63(5): 1521-1533. https://doi.org/10.13031/trans.13907
[18] Daccache, A., Knox, J.W., Weatherhead, E.K., Daneshkhah, A., Hess, T.M. (2015). Implementing precision irrigation in a humid climate: Recent experiences and on-going challenges. Agricultural Water Management, 147: 135-143. https://doi.org/10.1016/j.agwat.2014.05.018
[19] Peters, R.T., Flury, M. (2017). Variable rate irrigation on center pivots. What is it? Should I invest? In Proceedings, 2017 Western Alfalfa and Forage Symposium, Reno, NV, USA. http://irrigation.wsu.edu/Content/Fact-Sheets/VRI.pdf
[20] Omary, M.O.H.A.M.M.A.D., Camp, C.R., Sadler, E.J. (1997). Center pivot irrigation system modification to provide variable water application depths. Applied Engineering in Agriculture, 13(2): 235-239. https://doi.org/10.13031/2013.21604
[21] Han, Y.J., Khalilian, A., Owino, T.O., Farahani, H.J., Moore, S. (2009). Development of Clemson variable-rate lateral irrigation system. Computers and Electronics in Agriculture, 68(1): 108-113. https://doi.org/10.1016/j.compag.2009.05.002
[22] Chavez, J.L., Pierce, F., Elliott, T.V., Evans, R.G., Kim, Y., Iversen, W.M. (2010). A remote irrigation monitoring and control system (RIMCS) for continuous move systems. Part B: Field testing and results. Precision Agriculture, 11: 11-26. https://doi.org/10.1007/s11119-009-9110-8
[23] Irmak, S., Odhiambo, L.O., Kranz, W.L., Eisenhauer, D.E., (2011). Irrigation efficiency and uniformity, and crop water use efficiency. Biological Systems Engineering: Papers and Publications. 451. https://digitalcommons.unl.edu/biosysengfacpub/451.
[24] LaRue, J., Evans, R., Sidney, M. (2012). Considerations for variable rate irrigation. In 24th Annual Central Plains Irrigation Conference. Colby, Kansas, USA, pp. 111-116.
[25] O’Shaughnessy, S.A., Evett, S.R., Colaizzi, P.D., Andrade, M., Marek, T.H., Heeren, D.M., Lamm, F.R., LaRue, J.L. (2019). Identifying advantages and disadvantages of variable rate irrigation: An updated review. Applied Engineering in Agriculture, 35(6): 837-852. https://doi.org/10.13031/aea.13128
[26] Liu, J., Gull, U., Putnam, D.H., Kisekka, I. (2021). Variable-rate irrigation uniformity model for linear-move sprinkler systems. Transactions of the ASABE, 64(4): 1295-1302. https://doi.org/10.13031/trans.14313
[27] Zhou, Z., Tao, S., Mo, J. (2018). Simulation of spraying process in lateral VRI sprinkler system based on PWM. In MATEC Web of Conferences, 246: 03012. https://doi.org/10.1051/matecconf/201824603012
[28] Zhao, W., Li, J., Yang, R., Li, Y. (2014). Field evaluation of water distribution characteristics of variable rate center pivot irrigation system. Transactions of the Chinese Society of Agricultural Engineering, 30(22): 53-62. https://doi.org/10.3969/j.issn.1002-6819.2014.22.007
[29] Sui, R., Fisher, D.K. (2015). Field test of a center pivot irrigation system. Applied Engineering in Agriculture, 31(1): 83-88. https://doi.org/10.13031/aea.31.10539
[30] Zhao, W., Li, J., Yang, R., Li, Y. (2015). Field evaluating system performance of a variable rate center pivot irrigation system. In 26th Euro-mediterranean Regional Conference and Workshops, Montpellier, France, pp. 12-15.
[31] Yari, A., Madramootoo, C.A., Woods, S.A., Adamchuk, V.I. (2017). Performance evaluation of constant versus variable rate irrigation. Irrigation and Drainage, 66(4): 501-509. https://doi.org/10.1002/ird.2131
[32] Takács, S., Bíró, T., Helyes, L., Pék, Z. (2019). Variable rate precision irrigation technology for deficit irrigation of processing tomato. Irrigation and Drainage, 68(2): 234-244. https://doi.org/10.1002/ird.2299
[33] Hui, X., Lin, X.J., Zhao, Y., Xue, M.Y., Zhuo, Y., Guo, H., Xu, Y.C., Yan, H.J. (2022). Assessing water distribution characteristics of a variable-rate irrigation system. Agricultural Water Management, 260: 107276. https://doi.org/10.1016/j.agwat.2021.107276
[34] Szabó, A., Tamás, J., Kövesdi, Á., Nagy, A. (2023). Evaluation of new pivoting linear-move precision irrigation machine. Irrigation and Drainage. 72(4): 322-933. https://doi.org/10.1002/ird.2850
[35] Siadatan, A.R., Rafiee, M., Afjei, E. (2014). Design, construction and comparison of a sensorless driver circuit for switched reluctance motor. International Journal of Engineering, 27(1): 143-156.
[36] Zandzadeh, M.J., Saniei, M., Kianinezhad, R. (2020). Space vector pulse width modulation with reduced common mode voltage and current losses for six-phase induction motor drive with three-level inverter. International Journal of Engineering, 33(4): 586-597. https://doi.org/10.5829/ije.2020.33.04a.10
[37] Adegoke, O.A.O.M., Oluwafemi, I.B., Akinsanmi, O. (2020). A time domain noise measurement and analysis for broadband indoor power line communications. Instrumentation Mesure Métrologie, 19(2): 103-105. https://doi.org/10.18280/i2m.190204
[38] Vernekar, H.G., Maheshan, C.M. (2022). Flow rate Controlled Water Sprinkler using myRIO controller and LabVIEW. Journal of Electrical Engineering, 4(4): 297-306. https://doi.org/10.36548/jeea.2022.4.006
[39] Yan, Y., Wu, Z.Y., Wu, X.T., Zhou, X.L., Weng, C.X. (2019). A Linux-based integrated structural health monitoring system for bridges in remote regions. Instrumentation Mesure Métrologie, 18(6): 527-534. https://doi.org/10.18280/i2m.180603
[40] Liu, X., Qiao, X., Shi, X.D., Liu, Q.M., Shi, Y.G. (2019). A novel apple size and surface quality detection and grading system. Instrumentation Mesure Métrologie, 18(3): 237-242. https://doi.org/10.18280/i2m.180302
[41] Mecham, B. (2004). Using distribution uniformity to evaluate the quality of a sprinkler system. Irrigation Association’s, 379-386.
[42] Liu, J., Zhu, X., Yuan, S., Fordjour, A. (2019). Modeling the application depth and water distribution uniformity of a linearly moved irrigation system. Water, 11(4): 827. https://doi.org/10.3390/w11040827
[43] Mahmood, G.H. (2018). Interactions of soil water run-off with overhead (centre-pivot) irrigation and soil cultivations. Doctoral Dissertation, Harper Adams University. https://hau.repository.guildhe.ac.uk/id/eprint/17394.
[44] Christiansen, E.J. (1941) The uniformity of application of water by sprinkler systems. Agricultural Engineering, 22(3): 89-92.
[45] Liu, J.P., Liu, X.F., Zhu, X.Y., Yuan, S.Q. (2016). Droplet characterisation of a complete fluidic sprinkler with different nozzle dimensions. Biosystems Engineering, 148: 90-100. https://doi.org/10.1016/j.biosystemseng.2016.05.008
[46] O’Shaughnessy, S.A., Urrego, Y.F., Evett, S.R., Colaizzi, P.D., Howell, T.A. (2013). Assessing application uniformity of a variable rate irrigation system in a windy location. Applied Engineering in Agriculture, 29(4): 497-510. https://doi.org/10.13031/aea.29.9931
[47] Wang, Y., Li, M., Hui, X., Meng, Y., Yan, H. (2020). Alfalfa canopy water interception under low-pressure sprinklers. Agricultural Water Management, 230: 105919. https://doi.org/10.1016/j.agwat.2019.105919
[48] HASSAN, I. (2015). Technical evaluation of performance of center pivot sprinkler irrigation system at west Omdurman, Sudan. Doctoral Dissertation, Sudan University of Science and Technology, http://repository.sustech.edu/handle/123456789/12009.
[49] Playán, E., Salvador, R., Faci, J.M., Zapata, N., Martínez-Cob, A., Sánchez, I. (2005). Day and night wind drift and evaporation losses in sprinkler solid-sets and moving laterals. Agricultural Water Management, 76(3): 139-159. https://doi.org/10.1016/j. agwat.2005.01.015
[50] Ortiz, J.N., Tarjuelo, J.M., De Juan, J.A. (2009). Characterisation of evaporation and drift losses with centre pivots. Agricultural Water Management, 96(11): 1541-1546. https://doi.org/ 10.1016/j.agwat.2009.06.015
[51] Clark, G.A., Srinivas, K., Rogers, D.H., Stratton, R. Martin, V.L. (2003) Measured and simulated uniformity of low drift nozzle sprinklers. Transactions of the ASAE, 46(2): 321-330. https://doi.org/10.13031/2013.12983
[52] Dwomoh, F.A., Shouqi, Y., Hong, L., 2014. Droplet size characterization of the newtype complete fluidic sprinkler. IOSR Journal of Mechanical and Civil Engineering, 11(4): 70-73.