Rafi M. Qasim![]() | Ammar S. Dawood*
| Ammar S. Dawood*![]()
© 2023 IIETA. This article is published by IIETA and is licensed under the CC BY 4.0 license (http://creativecommons.org/licenses/by/4.0/).
OPEN ACCESS
This research examines the behavior of a weir-gate hydraulic structure when subjected to the presence or absence of a side obstacle. The study focuses on two scenarios, free flow and submerged flow, and employs a side obstacle with dimensions of 15 cm in height, 30 cm in length, and 1 cm in thickness, located 30 cm downstream from the weir-gate structure. A correlation matrix is derived using measured and calculated data to establish the relationship between various variables, both dimensional and non-dimensional. The results show a clear correlation between Froude number and discharge coefficient, while a random trend is observed between discharge coefficient and Reynolds number. A proper trend is found between Reynolds number and Froude number at the downstream location. The discharge coefficient is significantly influenced by factors such as gate water depth, weir water head, and vertical distance between the weir and gate. Additionally, the study investigates the effect of average water depth at the downstream on discharge and flow velocity. Two models, linear regression and artificial neural network, are developed and tested to estimate the coefficient of discharge (Cd). The ANN model proves to be the best-fit model for all scenarios, with an MSE of 0.00013141 and an R-squared value of 0.99. The machine learning algorithms used in this study demonstrate an increase in prediction accuracy for Cd.
open channel, side, obstacle, weir-gate, hydraulic structure
The weir-gate hydraulic structure plays an important role in regulating stream flow in river networks or open artificial channels. The functionality of weir-gate is based on removing the floating material by the weir, accompanied by removing the sediment material by the gate. Here, the weir and the gate operate simultaneously without any fluctuation. The weir-gate discharge structure can be used to divert, distribute, and control the stream flow. The interference between gate and weir flow velocities, water deepness over the weir sharp crest, discharge quantity, and discharge coefficient value are important hydraulic variables which dominate the hydraulic response of weir-gate structure (composite hydraulic structure). The existence of rivers, open channel, and flumes refers to a big challenge to the flow because of the reduced flow momentum, hydraulic energy losses, and different flow depth around the obstacle. The reduction in momentum happens owing to the drag force which is exerted on the flow; also the losses occur owing to the decrease in flow velocity. In general, the flow depth before the obstacle is higher compared to the flow depth after the obstacle. Several researchers have dealt with the issue of the weir-gate hydraulic structure. Qasim et al. [1] did an experimental study to assess the influence of weir-gate hydraulic structure inclination angle, the study adopted angle range from 45 degrees to 135 degrees with the horizontal bed of the flume and compared the result with the case when the inclination angle equal to 90 degrees. The investigations include the impact of the inclination angle on the actual flow rate, discharge coefficient, water depth at the downstream region of the flume, and cross-sectional area of flow which crosses the gate and weir respectively. Qasim et al. [2] dealt with an experimental study to give a suitable image for the behavior of composite hydraulic structures for free flow case and submerged flow case. The study looks for hydraulic variables affect, geometrical variables affect and the interference among them. Abdulhussein et al. [3] investigated the performance of the discharge structure experimentally and statistically. The study is built to reveal the influence of longitudinal obstacle on the performance of the discharge structure, the longitudinal obstacle is located downstream of the discharge structure. Abdulhussein et al. [4] availed from many experimental results to obtain equations which are employed to predict the flow rate that passes through combined hydraulic structure. Abdulhussein et al. [5] studied how the hydraulic features of weir-gate hydraulic structure will be influenced by rectangular obstacle which is installed at the downstream of the hydraulic structure. here, the length and thickness of the obstacle is considered changeable while the width is constant. Qasim et al. [6] investigated how the combined hydraulic will be influence by the discordance of the bed flume, the investigation dealt with hydraulic characteristics at the downstream of the combined structure. Notably, every published research has demonstrated that machine learning systems can reliably predict Cd.
Many studies [7-10] investigated experimental the hydraulic behavior of flow through combined structure which consists of combined weir and gate in order to obtain an equation to describe discharge coefficient equation. Hayawi et al. [11, 12] did an experimental study to investigate the hydraulic variable and geometrical variable of combined structure. Some researchers [13-15] performed many experiments in order to reveal the hydraulic features of flow through combined structure.
Many researchers [16-24] dealt with flow through combined structure to give a good understanding about hydraulic characteristics for the flow through this structure.
Machine learning models have been found to be superior to traditional regression-based techniques in forecasting discharge coefficients in hydraulic structures [25, 26]. Furthermore, recent studies have demonstrated that the integration of machine learning models with meta-heuristic algorithms can further enhance the precision of these forecasts [27]. Machine learning has proven to be highly successful in accurately modeling intricate hydraulic problems, providing fast and exact predictions of the discharge coefficient for different types of weirs.
Consequently, machine learning has gained significant popularity in hydraulic engineering, often used in conjunction with other approaches like Artificial Neural Network, Support Vector Machine, and Adaptive-Network-based Fuzzy Inference Systems [27-30]. Machine learning methods offer a promising approach to predict discharge coefficients using experimental data, addressing a major challenge in hydraulic engineering research [25]. Machine learning methods have shown considerable potential in forecasting the discharge coefficient in weir-gate hydraulic systems [26]. The integration of machine learning techniques with meta-heuristic algorithms has shown advantageous in the domain of hydraulic engineering. The aforementioned studies have demonstrated the effectiveness of these approaches in precisely determining the discharge coefficients of weir structures. These methods outperform standard empirical formulae and provide more exact results [25, 31-34].
Recent research has continuously shown encouraging results in using machine learning to forecast discharge coefficients for different hydraulic structures, including submerged radial gates, oblique side weirs, and labyrinth lateral weirs [26].
The integration of a hybrid grey wolf optimization-based KELM approach has yielded promising results in predicting the discharge coefficient of submerged radial gates. Furthermore, these machine learning techniques have effectively been employed to predict discharge coefficients using experimental data for side weirs in circular channels [25]. The literature extensively records the broad efficacy of machine learning techniques in modeling hydraulic issues, particularly in forecasting the discharge coefficient of different types of weirs. This success has been evidenced in several researches [35-40]. Machine learning methods provide a combination of high precision and effectiveness in predicting discharge coefficients. Moreover, they possess the capacity to manage intricate nonlinear interactions that are frequently observed in hydraulic systems [41]. Machine learning has shown to be a valuable tool for hydraulic engineers in forecasting the discharge coefficient of weirs. This enables more dependable and precise forecasts in the planning and functioning of hydraulic infrastructure. Scientists have examined the utilization of artificial intelligence methods, such as artificial neural networks, adaptive neuro fuzzy inference systems, support vector machines, and group technique of data processing [26, 37, 42]. Safari et al. [43] evaluated various models - Artificial Neural Networks (ANN), Gene Expression Programming (GEP), and regression models - in estimating the discharge coefficient for rectangular broad-crested weirs. The main finding seems to be a comparative analysis of these models in accurately predicting the flow over a specific type of weir, highlighting the strengths and weaknesses of each approach.
Machine learning methods, including artificial neural networks, adaptive neuro fuzzy inference systems, support vector machines, and group method of data handling techniques, are now employed to enhance the precision of predictions in the design and administration of hydraulic structures. These methodologies are employed to precisely represent the discharge coefficient for various categories of weirs, as demonstrated by Ghaderi et al. [44].
The utilization of machine learning methodologies in predicting the discharge coefficient of various types of weirs, including submerged radial gates, oblique side weirs, and labyrinth lateral weirs, has shown substantial effectiveness and advantages in the domain of hydraulic engineering.
The application of machine learning approaches has shown great promise in improving the accuracy and efficiency of computing the discharge coefficient for various types of weirs [26].
Ghaderi et al. [44] investigated the discharge coefficients of trapezoidal sharp-crested side weirs under subcritical flow regimes using computational fluid dynamics (CFD). The study found that the side weir geometry, specifically the side wall angle, significantly influences the discharge coefficient. The numerical model developed provided satisfactory predictions of the discharge coefficients compared to experimental data. The authors recommend the numerical model to precisely predict side weir discharge coefficients across various geometries and flow conditions.
Kulkarni and Hinge [45] presented a comparative study between experimental measurements and CFD simulations to predict the discharge coefficient of compound broad-crested weirs. The results showed close alignment between the experimental and CFD values of discharge coefficients. The maximum deviation was under 5%. The study demonstrated that CFD analysis can reliably predict the discharge capacity of such weirs. The authors noted the approach can help develop rating curves to operate weir structures more effectively.
Machine learning techniques have been effectively employed in various hydraulic structures, including submerged radial gates and oblique side weirs [45]. Granata et al. [25] demonstrated the successful integration of hybrid grey wolf optimization with KELM to get precise forecasts of discharge coefficients in submerged radial gates. Moreover, it was demonstrated that machine learning techniques accurately predicted discharge coefficients for side weirs in circular channels using experimental data. In addition, the successful use of machine learning methods in hydraulic modeling and the estimation of discharge coefficients demonstrates their efficacy and efficiency [46, 47].
The objective of this study is to develop and evaluate two models capable of quantitatively estimating the Cd necessary to determine the hydraulic Behavior of Weir-Gate Hydraulic Structure. In fact, hydraulic response of composite hydraulic structure will be more affected by the existence of artificial or natural obstacles in the downstream region. In the condition of severe flow rate, the existence of obstacles is even amplified due to the altered in the hydraulic characteristics of the regime. Therefore, this study deals with a noticeable problem represented by the interaction between the composite hydraulic structure and the side obstacle, where the composite hydraulic structure is near the side obstacle. The current paper includes a comparison study between two different flow conditions, the first deals with free flow while the second deals with submerged flow. Two options of the side obstacle are considered in this experiment, the first option deals with one side obstacle, while the second option deals with two side obstacles. The paper involves the correlation matrix to show the relation between many variables, these variables are hydraulic variables and geometrical variables. In addition, the study focused on the evaluation of discharge, discharge coefficient and average downstream water depth statistical. Firstly, current study cope with the impact of side obstacle on hydraulic operation of weir-gate structure or the study imply to the interaction between two different structures in the same channel, this study has not been considered previously. secondly, the obstacle has momentous impact which lead to rise of the water depth at downstream of weir-gate hydraulic structure. Ultimately, the interference between hydraulic response of obstacle and hydraulic response of weir-gate structure represents a vastly challenge.
To compute the theoretical flow rate which passes the weir-gate structure:
$Q_{ {theor }}=Q_{ {weir }}+Q_{ {gate }}$ (1)
The theoretical flow rate that passes the rectangular weir can be computed from the study [48]:
$Q_{w e i r}=\frac{2}{3} \sqrt{2 g} b h^{3 / 2}$ (2)
The theoretical flow rate which passes the rectangular gate can be computed by adopting the continuity equation.
$Q_{\text {gate }}=V A=\sqrt{2 g H} A$ (3)
For free-flow status:
$H=d+y+h$ (4)
For submerged flow status:
$H=d+y+h-h_d$ (5)
The actual flow rate that passes the weir-gate structure can be computed from:
$Q_{ {act }}=c_d Q_{ {theor }}$ (6)
$Q_{a c t}=c_d\left[\frac{2}{3} \sqrt{2 g} b h^{3 / 2}+\sqrt{2 g H} A\right]$ (7)
where, H is upstream water depth, h is depth of water on the weir crest, y is vertical distance between weir and gate, d is opening height, A is flow area passing gate, V is water velocity, b is width of the weir, g is acceleration owing to gravity, Qweir is weir flow rate, Qgate is gate flow rate, Qtheor is theoretical flow rate, Qact is actual flow rate, cd is discharge coefficient.
The Reynolds number [49] and the Froude number [50] are computed by using the following equations:
$R_e=\frac{V h_d}{v}$ (8)
$F_r=\frac{V}{\sqrt{g y}}$ (9)
where, ν is the kinematic viscosity of water, y is depth of water.
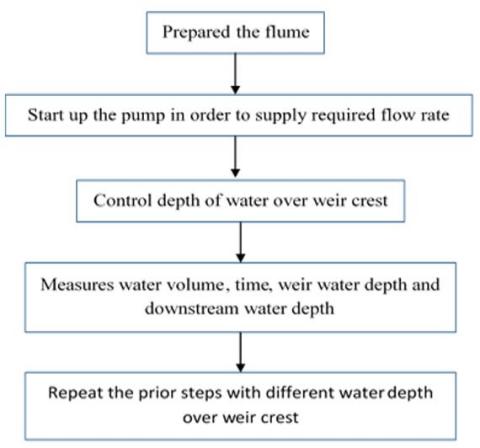
Figure 1. Experimental settings flow chart
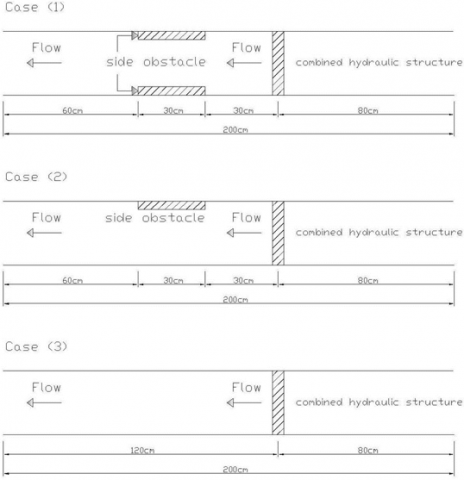
Figure 2. Combined weir-gate structure details
The experiments work is conducted in the Basra Engineering Technical College in the hydraulic laboratory. The flume has a total length of 200 cm, 7.5 cm wide, and 15 cm depth. The experiments are performed with and without side obstacles with various weir-gate structures upstream water depth, and with various geometric dimensions of weir-gate structure. The obstacle has a rectangular shape, which is located at a certain distance equal to 30 cm measured from the downstream of the weir-gate structure. The length of the obstacle is equal to 30 cm with depth equal to the depth of the flume (15 cm) and wide equal to 1 cm. The volumetric method is used to measure the flow rate while the water depth at the downstream zone is measured by a scale fixed on the wall of the flume. The flume bed is considered fixed and horizontal for all experimental work. The weir-gate structure is made from 5 mm thick wood sheet material. In addition, the side obstacle is made from wood material. The weir-gate structure is located at a distance equal to 80 cm from the beginning of the flume. Figure 1 shows experimental settings flow chart, while Figure 2 illustrates all details of combined weir-gate discharge structure as well Figure 3 illustrates the whole hydraulic system. For any experiment run, the following are the measured flow rate, upstream water depth, downstream water depth and water depth above the crest of weir. The current paper concentrates on three different cases, and these cases are
A: Flume with obstacles on both sides (case-1).
B: Flume with obstacle on one side (case-2).
C: Flume without obstacle (case-3).
Figure 3. Whole hydraulic system for various cases
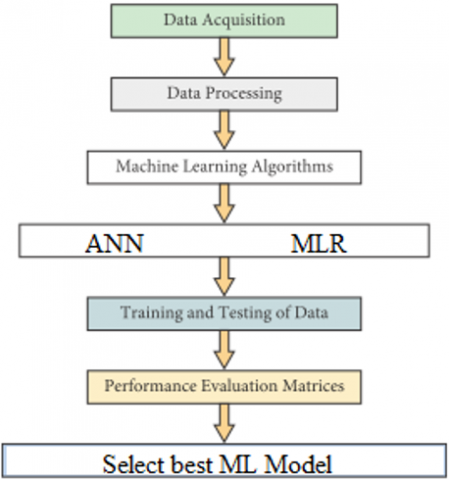
The parameters that were used for models in this study were given using machine learning, which is one of the approaches that are utilized in artificial intelligence (Tables 1 and 2). In order to accurately predict the weir features and prove their efficacy, machine learning methods are now being used [51-55]. For this model, we used 90 run experiments. (This study employs 80% and 20% data for LR and SVM model prediction in training and testing, respectively. In the course of this research, two different types of machine learning models - specifically, LR and ANN models - were built to forecast Cd. The processes involved in the technique are depicted in flowchart form in Figure 4.
Figure 4. Flowchart of the developed methodology
4.1 Multiple linear regression (MLR)
The linear regression approach (LR) depicts a target variable Y (also known as a response variable) as a linear function of a set of researcher-controlled parameters Xj (called regressors or predictors). LR model can be expressed as follows:
$Y_i=\beta_o+\beta_1 x_{i, 1}+\cdots+\beta_k x_{i, k}+\varepsilon_i \cdot i=1,2, \ldots, n$ (10)
4.2 Artificial neural network (ANN)
Artificial Neural Networks (ANNs) are widely employed in the field of artificial intelligence in order to facilitate pattern detection, categorization, and regression analysis. The principle of function fitting is widely known. The application of artificial neural networks (ANNs) that aims to minimize the error, which is the discrepancy between the output of the model and the observed data. There are several characteristic features of this system that render it an optimal selection for addressing linear and nonlinear correlation problems.
4.3 Model’s performance criteria
In order to assess the effectiveness of the developed machine learning models, the statistical performance criteria outlined below.
4.3.1 Mean absolute error (MAE)
The mean absolute error is a commonly used statistical measure for quantifying error. This study evaluates the effectiveness of models utilized for continuous variables, such as the Cd. The prediction error of a model is mathematically defined as the difference between the actual value and the anticipated value. Each row of data is assigned a value. In this scenario, the average is computed by taking the absolute value of each difference. The scoring system is linear, implying that every individual error carries equal weight in the total average. The user has provided a numerical reference.
4.3.2 Mean squared error (MSE)
The mean squared error (MSE) is approximately equivalent to the mean absolute error (MAE), with the distinction that the discrepancy between the observed and predicted values is squared rather than measured in absolute terms. The act of squaring the variances serves to accentuate the disparities by magnifying larger discrepancies. The system provides enhanced error tolerance and delivers a more precise evaluation of faults.
4.3.3 Root mean squared error (RMSE)
Both the mean squared error approach and the root mean squared error approach are essentially the same thing.
4.3.4 Coefficient of correlation (R)
The correlation coefficient, often known as r, is a statistical metric that is used to quantify the degree to which a model and its corresponding experimental data fit together. A metric that is used to assess the strength and direction of a linear relationship between two variables is referred to as the coefficient of correlation (abbreviated as r).
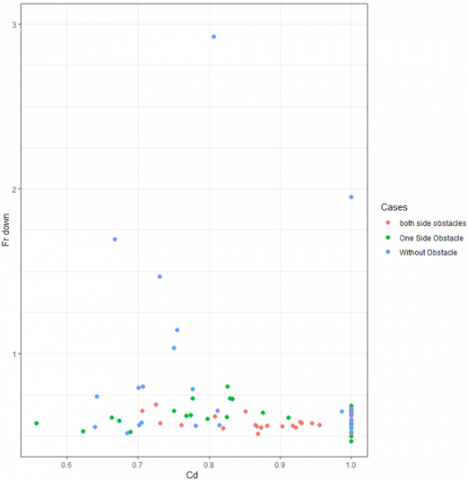
The weir gate is the main hydraulic structure for the surface water distribution, measurement, diversion, and regulation. They have various geometrical features such as irregular and regular shapes, large or small geometrical dimensions and remove nonacceptable materials, which affect the surface water movement pattern, and hence the amount of water that can be flowed in the river, artificial open channels or flumes. Experiment work that reflects the effect of the side obstacle on the hydraulic characteristics of weir-gate structure is explained. Figure 5 indicates the relation between the discharge coefficient values and the downstream Froude number values for three different cases. In general, the figure illustrates, with increasing discharge coefficient, the range of Froude number values between 0.5 and 1, but there is some fluctuation appearing in the case without side obstacles. Here, the value of Froude number is greater than 1. This happens in the free flow case and the reason for this is deviating due to the overlapping between under flow and over flow velocities. The figure implies that the presence of obstacles/obstacle dominates the downstream Froude number values as compared with the case of without obstacles/obstacle. In addition, when the Froude number values less than 1, this means low flow velocity and the dominant force is gravity. On the other hand, the discharge coefficient is more sensitive to the flow velocity, so any change in flow velocity will reflect directly on the discharge coefficient. Figure 6 is plotted to express the relationship between the discharge coefficient and the downstream Reynolds number. There is no direct or indirect relationship between the discharge coefficient and the Reynolds number. The figure shows a random pattern in the relationship, so we can consider both parameters as independent for various three cases. For more clarification, Reynolds number depends on the water velocity and water depth, as well, Reynolds number is directly proportional with the flow velocity, but the discharge coefficient has inversely proportional with flow velocity, therefore, the flow velocity refers to the conflict between the two parameters. Flow velocity will promote the random trend in the relationship.
Figure 5. Relation between discharge coefficient and downstream Froude number
Figure 6. Relation between discharge coefficient and Reynolds number
Figure 7 is plotted to express the relation between the Froude number and the Reynolds number in the downstream zone. There is no direct or indirect relation between the Froude number and the Reynolds number. The figure indicates a gradual increase in Froude number with an increase in Reynolds number. There is no dramatic altered in relation pattern, the deviates in relation rely on the interference between over flow and under flow velocities. For more reasons, both Froude number and Reynolds number depend on the water velocity and water depth. In addition, both Froude number and Reynolds number have a direct proportional to the water velocity, so any increase or decrease in water velocity will reflect directly on Froude number and Reynolds number.
Figure 7. Relation between Froude number and Reynolds number at the downstream
Figure 8 indicates the relationship between discharge values with the downstream flow velocity values for three different cases. It is obvious from the figure that with increasing in flow velocity, Despite the existence of obstructions the continuity equation predicts that the real discharge will be greater since there is a direct proportionate between the discharge and flow velocity. This will cause the actual discharge to rise.
Figure 8. Relation between actual flow rate and flow velocity
Figure 9 indicates the relationship between the flow velocity values and the average downstream flow depth values for three different cases. It is clear from the figure as the average downstream water depth increases the flow velocity will increase, also the figure indicates the fluctuation in result for the case without obstacle side. When the cross section of the flume changes in the longitudinal direction due to the presence of the obstacles, the water depth will rise before the obstacle and then decrease this change will lead to the increase in flow velocity. Furthermore, the deviation in the result will attribute to the overlapping between the weir velocity and gate velocity.
Figure 9. Relation between flow velocity and the average depth of water in the downstream
Figure 10 indicates the relationship between discharge values and the average downstream flow depth values for the three different cases. It is clear from the figure that as the average downstream water depth increases the discharge will increase, also the figure indicates the fluctuation in result for the case without obstacle side. Figure 10 has the same pattern as Figure 9 owing to the direct proportional between discharge and flow velocity according to the continuity equation.
Figure 10. Relation between flow rate and average depth of water downstream
Figure 11 is drawn to express the relation between the discharge coefficient and (y/H) for various cases, where H represents the upstream water depth and y represents the vertical distance between weir and gate. In general, as the distance (y) increases, the discharge coefficient decreases due to the inversely proportional between them, but the presence of the obstacle will reflect on the relation and change the pattern trend. The variation in results will be attributed to the overlapping between the weir and gate flow velocity respectively.
Figure 11. Relation between discharge coefficient and y/H
Figure 12. Relation between discharge coefficient and hd/H
Figure 12 is drawn to express the relation between the discharge coefficient and (hd/H) for various cases, where H represent the upstream water depth and hd represent the average downstream water depth. In essence, there is no direct or indirect relation between the discharge coefficient and the depth of the water downstream of the hydraulic regime. Furthermore, there is no empirical equation or theoretical equation between them. Therefore, both of them can be considered independent parameters. The figure implies that the discharge coefficient increase with the increase in (hd/H) for different cases.
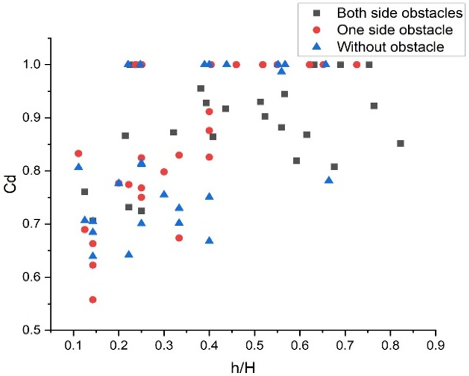
Figure 13 is drawn to express the relation between the discharge coefficient and (h/H) for various cases, where H represent the upstream water depth and h represent the water depth above e the crest of the weir. Figures refer to the increase in discharge coefficient with increase in (h/H) for the case of the obstacle existence. In the case without of the obstacle, the behavior alters and varies in some positions. When the ratio (h/H) between (0-0.45) the discharge coefficient decrease with increase in the ratio values. While after the ratio (h/H) value equal to (0.45) the discharge value increase with increase in the ratio (h/H). The variation happens due to the interaction between weir flow velocity and gate flow velocity.
Figure 14 is drawn to express the relation between the discharge coefficient and (d/H) for various cases, where H represent the upstream water depth and d represent the gate opening depth. It is obvious from the figure that the discharge coefficient values decrease with increase in (d/H) because of the inversely proportional between the discharge coefficient and the depth of the gate opening. The variation in results will be attributed to the interaction between the weir flow velocity and the gate flow velocity.
Tables 1-3 present statistical data pertaining to the present experimental investigation. Specifically, these tables provide information on the actual flow, average downstream water depth, and discharge coefficient, respectively. The statistical estimation yields highly similar values for the mean and median, indicating that the collected experimental data have a symmetrical or balanced distribution. The standard deviation of a population's measured data indicates that it seeks to approximate the mean of the measured data. Furthermore, the tables encompass the measures of variance, range, maximum, and minimum.
Figure 13. Relation between discharge coefficient and h/H
Figure 14. Relation between discharge coefficient and d/H
Table 1. Statistical data for the actual discharge
|
Case |
Mean |
Median |
Standard Deviation |
Sample Variance |
Range |
Maximum |
Minimum |
|
Both side obstacle |
0.000931 |
0.0009 |
0.000284 |
8.07E-08 |
0.001156 |
0.001601 |
0.000445 |
|
One side obstacle |
0.001034 |
0.000928 |
0.000387 |
1.5E-07 |
0.001499 |
0.001974 |
0.000474 |
|
Without obstacle |
0.001013 |
0.001 |
0.000315 |
9.93E-08 |
0.001118 |
0.001596 |
0.000478 |
Table 2. Statistical data for the average depth of the water in the downstream
|
Case |
Mean |
Median |
Standard Deviation |
Sample Variance |
Range |
Maximum |
Minimum |
|
Both side obstacle |
3.7955 |
3.7875 |
0.735855 |
0.541483 |
2.5875 |
5.1375 |
2.55 |
|
One side obstacle |
3.7405 |
3.65 |
0.665972 |
0.443519 |
2.4375 |
4.9625 |
2.525 |
|
Without obstacle |
3.093286 |
2.975 |
0.630495 |
0.397524 |
2.4625 |
4.0375 |
1.575 |
Table 3. Statistical data for the discharge coefficient
|
Case |
Mean |
Median |
Standard Deviation |
Sample Variance |
Range |
Maximum |
Minimum |
|
Both side obstacle |
0.89023 |
0.902919 |
0.091992 |
0.008463 |
0.293922 |
1 |
0.706078 |
|
One side obstacle |
0.846952372 |
0.829493784 |
0.139686971 |
0.01951245 |
0.442547149 |
1 |
0.557452851 |
|
Without obstacle |
0.826429 |
0.781475 |
0.139477 |
0.019454 |
0.360882 |
1 |
0.639118 |
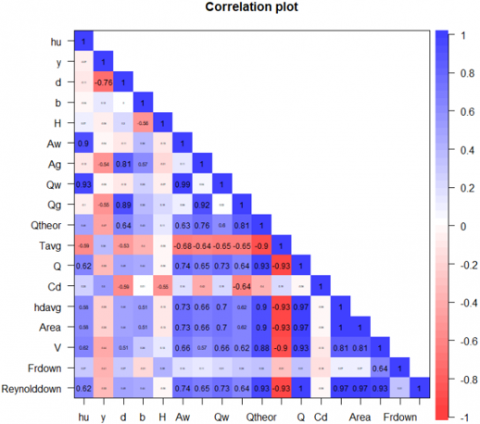
Figure 15. Correlation matrix for both side obstacle cases
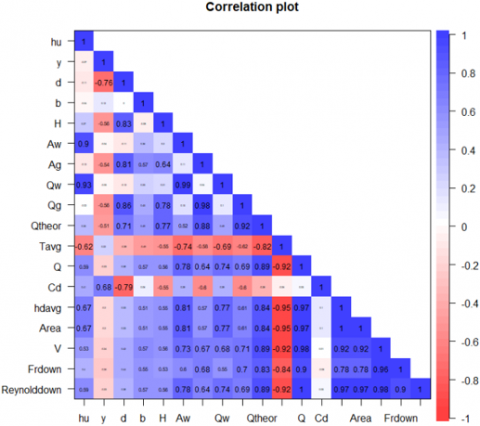
Figure 16. Correlation matrix for the one-side obstacle case
Figure 17. Correlation matrix for the case of without obstacle
Figures 15-17 show the correlation plot for the different experimental case studies. For any figure, this figure includes the dominant variables which will be controlled the behavior of weir-gate structure. These variables are hydraulic variables and geometrical variables. In general, the correlation matrix refers to the relationship between any two elements or variables. This relationship may be described as strong, weak, or moderate. In this study, the correlation matrix is employed to indicate the linkage between the variables which control the operation of the weir-gate structure at the acceptable level without any fluctuation. The target of using the correlation matrix is to establish a clear relationship between different variables that control the weir-gate hydraulic structure of the weir gate. In addition, a correlation matrix is used to predict the actual discharge and the average depth of the downstream water. The figures show positive and negative correlation. The positive correlation means that both variables have the same direction, while the negative correlation means that both variables move in the opposite direction. Moreover, when the correlation values are nearest or closer to zero, this implies a weak relationship between the variables. A positive linear correlation occurs when the correlation between two variables equals 1, while, A negative linear correlation occurs when the correlation between two variables is equal to -1. The figures include a positive linear correlation. Furthermore, include positive values of the correlation but less than 1, depending on these values, the relationship between variables may be strong, weak, or moderate. Moreover, it is observed that the tables do not include values equal to -1, but the tables include negative correlation values. Depending on the negative value of the correlation, the relationship between variables may be strong, weak, or moderate. It is clear that the correlation matrix is employed to summarize the hydraulic variables and geometrical variables data, respectively, to predict a reasonable and relevant relationship between variables with or without side obstacles.
Correlation analysis, a widely used statistical technique, may be employed to assess the degree of linear association between two dependent variables. No consideration is given to the degree of reliance or autonomy of the variables. In most of the research, researchers looked for a linear relationship between two variables by employing the correlation analysis technique. The correlation coefficients for numerous parameters were calculated, resulting in the correlation matrix. The significance of the association was calculated using p values. Significant variance exists if and only if p is less than 0.05 and 0.01 (p0.05 and p0.01) (Figures 15-17). When p > 0.05, the difference does not matter [53, 54]. The accepted range for the significance level is from 0.01 to 0.05. The results of a Pearson correlation analysis, performed on all variables (input/output), are shown in Figures 15-17.
Based on the analysis of all four statistical variables, it can be concluded that the ANN model demonstrates the highest level of suitability for the Cd data in both phases of training and testing, with the MLR model ranking second in terms of performance. In addition, the artificial neural network (ANN) model demonstrates superior performance in terms of root mean square error (RMSE), mean square error (MSE), and mean absolute error (MAE) for the variable Cd. Additionally, it exhibits a strong correlation coefficient for the Cd data. The multiple linear regression (MLR) model demonstrates that the root mean square error (RMSE) is the most effective statistical indicator for prediction. On the other hand, the mean squared error (MSE) and mean absolute error (MAE) exhibit the greatest fit for artificial neural networks (ANN) throughout both training and testing phases. Therefore, it can be inferred that Artificial Neural Network (ANN) is the optimal model for estimating Cd across all four statistical indices.
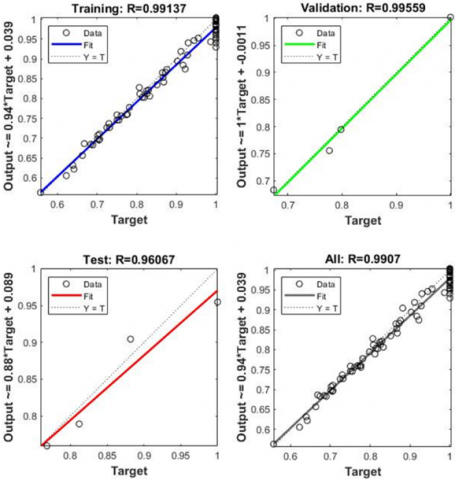
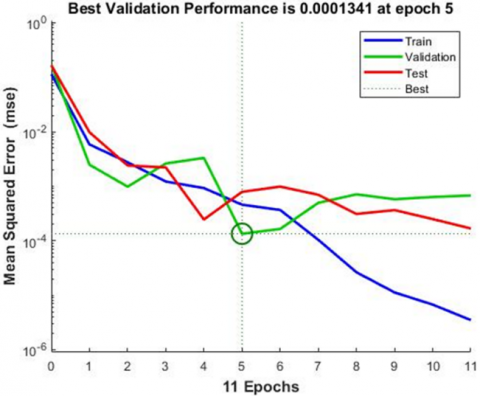
Figure 18 shows that the Training, validation, and testing stages in estimation of Cd, which show R value more than 0.99 in Training and validation, while it about 0.96 in testing stage of ANN modeling. Furthermore, Figure 19 show the best epoch of 5 that get minimum prediction error (MSE) in ANN simulation (0.00013141) from total of 11 epochs.
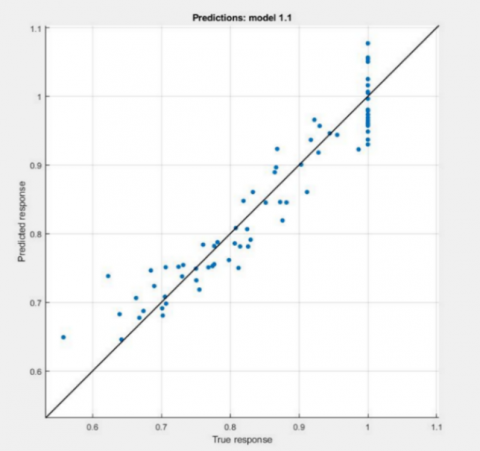
The MLR modeling show less statistical indicator parameters (MSE and R) than the ANN model. In this study the application of MLR model got R equal to 0.9 and MSE equal to 0.0015209. These statistical indicator parameters were less than its values when comparing with ANN model. Figure 20 show the predicted and true responses (Cd).
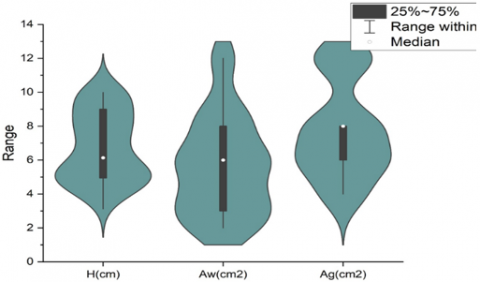
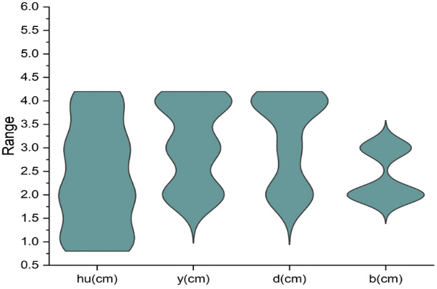
The Box–Whisker plots (for inputs and output) and normal distribution of output (Cd), are shown in Figures 21 and 22, respectively.
Figure 18. Correlation matrix for the case of without obstacle
Figure 19. MSE best value from the process of estimation of Cd
Figure 20. The predicted and true responses (Cd)
Figure 21. The Box–Whisker plots (for inputs and output)
Figure 22. The normal distribution and histogram of output (Cd)
The hydraulic behavior of the weir-gate hydraulic construction exhibits greater sensitivity to the presence of a side obstruction as opposed to its absence. The sensitivity of the discharge coefficient is seen to be influenced by several variables, including the vertical separation between the weir and the gate, the hydraulic head above the weir crest, and the water depth at the gate opening. Furthermore, the correlation between the discharge coefficient and Reynolds number is characterized as stochastic, in contrast to the correlation between the discharge coefficient and Froude number.
In addition, the relationship between Reynolds number and Froude number at the downstream moves in the same direction and this implies a suitable trend in the relationship. Also, it is clear that the actual discharge, downstream flow velocity, and average downstream water depth are more sensible to the presence or absence of the side obstacle in the flume. It is found that the discharge coefficient increases with increasing in the average downstream water depth regardless of both parameters being considered independently. A correlation matrix gives a good indicator and guide to predict the relationship between hydraulic variables and geometrical variables. Furthermore, provide a good relation among hydraulic variables or geometrical variable. The variation in statistical data for the different cases reflects the impact of the presence or absence of the side obstacle on the hydraulic response of weir-gate structure. Two machine learning models were constructed and evaluated to provide predictions for the variable Cd. The study's findings indicate that the application of machine learning models has promise in mitigating some constraints frequently encountered in conventional approaches to assessing Cd. It is recommended to consider alternative strategies for assessing and forecasting the coefficient of drag (Cd) rather than depending exclusively on the aforementioned procedures. Subsequent inquiries should prioritize the exploration and advancement of machine learning (ML) models, encompassing classification and regression models, in the realm of engineering. This would enable improvements in the estimate of Cd. Hydraulic systems have the ability to effectively decrease both the costs and time associated with hydraulic control, owing to their expanded functionality. In conclusion, the utilization of the artificial neural network (ANN) model has demonstrated significant effectiveness and utility in the forecasting of Cd.
[1] Qasim, R.M., Abdulhussein, I.A., Al-Asadi, K.H.A. L.I.D. (2020). Experimental study of composite inclined weir–gate hydraulic structure. Wseas Transactions on Fluid Mechanics, 15: 54-61. https://doi.org/10.37394/232013.2020.15
[2] Qasim, R.M., Abdulhussein, I.A., Mohammed, A.A., Maatooq, Q.A. (2022). Evaluation of the hydraulic behavior of the composite hydraulic structure considering a bed flume with special obstacle. INCAS Bulletin, 14(3): 61-74. https://doi.org/10.13111/2066-8201.2022.14.3.6
[3] Abdulhussein, I.A., Qasim, R.M., Mohammed, A.A., Maatooq, Q.A. (2022). Flow-composite hydraulic structure-longitudinal obstacle interaction. GEOMATE Journal, 23(96): 40-49. https://doi.org/10.21660/2022.96.3247
[4] Abdulhussein, I.A., Qasim, R.M., Hameed, M.A. (2022). Determination of the general formula to estimate the discharge quantity of composite structure for free flow. Instrumentation, Mesure, Metrologie, 21(1): 13-20. https://doi.org/10.18280/i2m.210103
[5] Abdulhussein, I.A., Qasim, R.M., Maatooq, Q.A. (2022). Hydraulic interaction between composite structure and block obstacle. International Journal on Technical and Physical Problems of Engineering, 14(2): 65-73.
[6] Qasim, R.M., Mohammed, A.A., Abdulhussein, I.A. (2022). An investigating of the impact of bed flume discordance on the weir-gate hydraulic structure. HighTech and Innovation Journal, 3(3): 341-355. https://doi.org/10.28991/HIJ-2022-03-03-09
[7] Hassan, F.A., Khassaf, S.I., Omran, H.A. (2015). Determining the coefficient of discharge due to flow over composite weir and below gates. Asian Transactions on Engineering, 5(6): 1-6. http://doi.org/10.13140/RG.2.2.33844.86406
[8] Khassaf, S.I., Habeeb, M. (2014). Experimental investigation for flow through combined trapezoidal weir and rectangular gate. International Journal of Scientific and Engineering Research, 5(4): 312-323.
[9] Khassaf, S.I., Yost, S.A., Abbas, H.A. (2013). Coefficient of discharge for a compound weir combined with semicircular gate. International Journal of Advance Research, 1(9): 1-8.
[10] Khassaf, S.I., Abbas, H.A. (2013). Study the free flow over compound weir and below semi circular gate. International Journal of Scientific & Engineering Research, 4(10): 1486-1491.
[11] Hayawi, H.A.M., Yahia, A.A.G., Hayawi, G.A.M. (2008). Free combined flow over a triangular weir and under rectangular gate. Damascus university journal, 24(1): 9-22.
[12] AG Alniami, A., Hayawi, G.A.M., AM Hayawi, H. (2009). Coefficient of discharge for a combined hydraulic measuring device. Al-Rafidain Engineering Journal (AREJ), 17(6): 92-100. https://doi.org/10.33899/rengj.2009.43616
[13] Alhamid, A.A, Husain, D., Negm, A.M., (1996) Discharge equation for simultaneous flow over rectangular weirs and below inverted triangular weirs. Arab Gulf Journal of Scientific Research, 14(3): 595-607.
[14] Alhamid, A.A. (2000). Discharge measurements in sewers using combined weir-gate device. WIT Transactions on Ecology and the Environment, 40: 133-142. https://doi.org/10.2495/HY000121
[15] Negm, A.A.M., Al-Brahim, A.M., Alhamid, A.A. (2002). Combined-free flow over weirs and below gates. Journal of Hydraulic Research, 40(3): 359-365. https://doi.org/10.1080/00221680209499950
[16] Ferro, V. (2000). Simultaneous flow over and under a gate. Journal of Irrigation and Drainage Engineering, 126(3): 190-193. https://doi.org/10.1061/(ASCE)0733-9437(2001)127:5(325)
[17] Jalil, S.A., Sarhan, S.A. (2013). Experimental study of combined oblique weir and gate structure. ARPN Journal of Engineering and Applied Sciences, 8(4): 306-315.
[18] Gharahgezlou, M., Golmai, S.H. (2013). The mathematical model for determining the discharge-depth equation in the semi submerged combinational model of rectangular broadcrested weir-gate. Technical Journal of Engineering and Applied Sciences, 3(19): 2420-2426.
[19] AL-Saadi, A.K.I. (2013). Study coefficient of discharge for a combined free flow over weir and under gate for multi cases. Euphrates journal of agriculture science, 5(4): 26-35.
[20] Al-Suhaili, R.H., Al-Baidhani, J.H., Al-Mansori, N. (2014). Hydraulic characteristics of a rectangular weir combined with equal and unequal size three rectangular bottom openings. International Journal of Computational Engineering Research, 4(1): 13-29.
[21] Obead, I.H., Hamad, R. (2014). Experimental study of coupled flow through combined weir-gate structure. Journal of Babylon University, Engineering Sciences, 22(1): 151-161.
[22] Al-Suhaili, R.H., Al-Baidhani, J.H., Al-Mansori, N. (2015). Removal efficiency of sediment by self-cleaning of combined rectangular weir with three ectangular bottom openings by using ANN. Journal of University of Babylon, 23(2).
[23] Parsaie, A., Haghiabi, A.H., Saneie, M., Torabi, H. (2017). Predication of discharge coefficient of cylindrical weir-gate using adaptive neuro fuzzy inference systems (ANFIS). Frontiers of Structural and Civil Engineering, 11: 111-122. http://doi.org/10.1007/s11709-016-0354-x
[24] Saad, N.Y., Fattouh, E.M. (2017). Hydraulic characteristics of flow over weirs with circular openings. Ain Shams Engineering Journal, 8(4): 515-522. http://doi.org/10.1016/j.asej.2016.05.007
[25] Granata, F., Di Nunno, F., Gargano, R., de Marinis, G. (2019). Equivalent discharge coefficient of side weirs in circular channel: A lazy machine learning approach. Water, 11(11): 2406. https://doi.org/10.3390/w11112406
[26] Idrees, A.K., Al-Ameri, R. (2022). A review of hydraulic performance and design methods of labyrinth weirs. Water Supply, 22(11): 8120-8138. https://doi.org/10.2166/ws.2022.378
[27] Mahdavi-Meymand, A., Sulisz, W., Zounemat-Kermani, M. (2022). A comprehensive study on the application of firefly algorithm in prediction of energy dissipation on block ramps. Eksploatacja i Niezawodność, 24(2): 200-210. http://doi.org/10.17531/ein.2022.2.2
[28] Yildiz, A., Yarar, A., Kumcu, S.Y., Marti, A.I. (2020). Numerical and ANFIS modeling of flow over an ogee-crested spillway. Applied Water Science, 10(4): 1-10. http://doi.org/10.1007/s13201-020-1177-4
[29] Karbasi, M., Jamei, M., Ahmadianfar, I., Asadi, A. (2021). Toward the accurate estimation of elliptical side orifice discharge coefficient applying two rigorous kernel-based data-intelligence paradigms. Scientific Reports, 11(1): 19784. https://www.nature.com/articles/s41598-021-99166-3
[30] Nasrabadi, M., Mehri, Y., Ghassemi, A., Omid, M.H. (2021). Predicting submerged hydraulic jump characteristics using machine learning methods. Water Supply, 21(8): 4180-4194. https://doi.org/10.2166/ws.2021.168
[31] Mohammed, A.Y., Sharifi, A. (2020). Gene Expression Programming (GEP) to predict coefficient of discharge for oblique side weir. Applied Water Science, 10(6): 1-9. http://doi.org/10.1007/s13201-020-01211-5
[32] Ghaderi, A., Daneshfaraz, R., Dasineh, M., Di Francesco, S. (2020). Energy dissipation and hydraulics of flow over trapezoidal–triangular labyrinth weirs. Water, 12(7): 1992. https://doi.org/10.3390/w12071992
[33] Gharib, R., Heydari, M., Kardar, S., Shabanlou, S. (2020). Simulation of discharge coefficient of side weirs placed on convergent canals using modern self-adaptive extreme learning machine. Applied Water Science, 10. http://doi.org/10.1007/s13201-019-1136-0
[34] Sangeeta, Haji Seyed Asadollah, S.B., Sharafati, A., Sihag, P., Al-Ansari, N., Chau, K.W. (2021). Machine learning model development for predicting aeration efficiency through Parshall flume. Engineering Applications of Computational Fluid Mechanics, 15(1): 889-901. https://doi.org/10.1080/19942060.2021.1922314
[35] Fu, Z., Cui, Z., Dai, W., Chen, Y. (2018). Discharge coefficient of combined orifice-weir flow. Water, 10(6): 699. https://doi.org/10.3390/w10060699
[36] Mohammed, J.R., Shiba, S.J. (2017). Side weir flow investigation in a circular channel using computational fluid dynamics (CFD) for subcritical flow condition. Journal of Duhok University, 20(1): 626-637. https://doi.org/10.26682/sjuod.2017.20.1.55
[37] Mehri, Y., Esmaeili, S., Soltani, J. (2020). Experimental study and performance comparison on various types of rectangular piano key side weirs at a 120º section of a 180º curved channel. Applied Water Science, 10: 1-13. https://doi.org/10.1007/s13201-020-01306-z
[38] Bonakdari, H., Zaji, A.H. (2018). New type side weir discharge coefficient simulation using three novel hybrid adaptive neuro-fuzzy inference systems. Applied water science, 8: 1-15. http://doi.org/10.1007/s13201-018-0669-y
[39] Li, Z., Wang, N., Li, Y., Sun, X., Huo, M., Zhang, H. (2019). Collective efficacy of support vector regression with smoothness priority in marine sensor data prediction. IEEE Access, 7: 10308-10317.
[40] Azimi, H., Shabanlou, S. (2018). Numerical study of bed slope change effect of circular channel with side weir in supercritical flow conditions. Applied Water Science, 8(6): 166. http://doi.org/10.1007/s13201-018-0816-5
[41] Xu, J., Yoon, H.S. (2016). A review on mechanical and hydraulic system modeling of excavator manipulator system. Journal of Construction Engineering, 1-11. http://doi.org/10.1155/2016/9409370
[42] Azimi, H., Bonakdari, H., Ebtehaj, I. (2019). Design of radial basis function-based support vector regression in predicting the discharge coefficient of a side weir in a trapezoidal channel. Applied Water Science, 9: 1-12. http://doi.org/10.1007/s13201-019-0961-5
[43] Safari, S., Takarli, A., Salarian, M., Banejad, H., Heydari, M., Ghadim, H.B. (2022). Evaluation of ANN, GEP, and regression models to estimate the discharge coefficient for the rectangular broad-crested weir. Polish Journal of Environmental Studies, 31(5): 4817-4827. http://doi.org/10.15244/pjoes/147592
[44] Ghaderi, A., Dasineh, M., Abbasi, S., Abraham, J. (2020). Investigation of trapezoidal sharp-crested side weir discharge coefficients under subcritical flow regimes using CFD. Applied Water Science, 10(1): 1-12. http://doi.org/10.1007/s13201-019-1112-8
[45] Kulkarni, K.H., Hinge, G.A. (2022). Comparative study of experimental and CFD analysis for predicting discharge coefficient of compound broad crested weir. Water Supply, 22(3): 3283-3296. https://doi.org/10.2166/ws.2021.403
[46] Khadim, Q., Kiani-Oshtorjani, M., Jaiswal, S., Matikainen, M.K., Mikkola, A. (2021). Estimating the characteristic curve of a directional control valve in a combined multibody and hydraulic system using an augmented discrete extended Kalman filter. Sensors, 21(15): 5029. https://doi.org/10.3390/s21155029
[47] Sun, X., Bi, Y., Karami, H., Naini, S., Band, S.S., Mosavi, A. (2021). Hybrid model of support vector regression and fruitfly optimization algorithm for predicting ski-jump spillway scour geometry. Engineering Applications of Computational Fluid Mechanics, 15(1): 272-291. http://doi.org/10.1080/19942060.2020.1869102
[48] Streeter, V.L., Wylie, E.B. (1983). Fluid Mechanics. SI Metric Ed. McGraw-Hill.
[49] Negm, A.A.M., Al-Brahim, A.M., Alhamid, A.A. (2002). Combined-free flow over weirs and below gates. Journal of Hydraulic Research, 40(3): 359-365. https://doi.org/10.1080/00221680209499950
[50] Fox, R.W., McDonald, A.T., Pritchard, P.J. (1994). Introduction to Fluid Mechanics, John Wiley and Sons, New York.
[51] Hassan, A.A., Mawat, M.J., Dawood, A.S. (2019). Prediction of compressive strength of concrete containing pozzolanic materials by applying neural networks. Int J Civ Eng Technol, 10(2): 526-537.
[52] Abdulkareem, I.A., Abbas, A.A., Dawood, A.S. (2022). Modeling pollution index using artificial neural network and multiple linear regression coupled with genetic algorithm. Journal of Ecological Engineering, 23(3): 236-250. https://doi.org/10.12911/22998993/146177
[53] Dawood, A.S., Li, Y.L. (2012). Response surface methodology (RSM) for wastewater flocculation by a novel (AlCl3-PAM) hybrid polymer. Advanced Materials Research, 560: 529-537. https://doi.org/10.4028/www.scientific.net/AMR.560-561.529
[54] Dawood, A.S. (2017). Using multivariate statistical methods for the assessment of the surface water quality for a river: A case study. International Journal of Civil Engineering and Technology (IJCIET), 8(10): 588-597.
[55] Abdulkareem, I.A., Dawood, A.S., Abbas, A.A. (2022). Integration of an artificial neural network and a simulated annealing algorithm for the optimization of the river water pollution index. Regional Studies in Marine Science, 56: 102719. https://doi.org/10.1016/j.rsma.2022.102719