Praveen Kumar Moganam* | Denis Ashok Sathia Seelan
© 2020 IIETA. This article is published by IIETA and is licensed under the CC BY 4.0 license (http://creativecommons.org/licenses/by/4.0/).
OPEN ACCESS
Detection of defects in a typical leather surface is a difficult task due to the complex, non-homogenous and random nature of texture pattern. This paper presents a texture analysis based leather defect identification approach using a neural network classification of defective and non-defective leather. In this work, Gray Level Co-occurrence Matrix (GLCM) is used for extracting different statistical texture features of defective and non-defective leather. Based on the labelled data set of texture features, perceptron neural network classifier is trained for defect identification. Five commonly occurring leather defects such as folding marks, grain off, growth marks, loose grain and pin holes were detected and the classification results of perceptron network are presented. Proposed method was tested for the image library of 1232 leather samples and the accuracy of classification for the defect detection using confusion matrix is found to be 94.2%. Proposed method can be implemented in the industrial environment for the automation of leather inspection process.
machine vision, leather defects, gray level co-occurrence matrix, texture analysis, perceptron neural network
ifferent visual appearances due to the non-homogeneous, random nature of color texture [1]. Production of high quality, defect free leather products is affected by many defects such natural, mechanical, flaying, curing and tanning defects which are introduced during the large scale production of leather. The presence of defects in leather is considered as a critical factor as it increases the rejection costs in a typical leather fabric industry. Currently, human inspectors are employed for inspection of leather surfaces and they usually miss a significant number of defects due to various factors such as fatigue, repetitive tasks, lighting conditions and color blindness. In order to achieve improved productivity with high quality in a large scale production of leather, there is a need for an automated inspection system to ensure the quality of leather in the leather factories [2].
A wide variety of image processing and analysis methods are proposed by various researchers for automated leather defect inspection [3]. Krastev et al. [4] showed a histograms-based detection method, using the χ 2 criteria for image analysis and histogram construction. Spatial gray level co-occurrence matrix (GLCM) is widely used as texture features extraction method for defect identification on textured surfaces [5]. As frequency domain features are generally less sensitive to noise than spatial-domain features, multichannel Gabor filters are used as joint spatial/spatial- frequency representations for analyzing textured images with highly specific frequency and orientation characteristics [6]. In frequency domain approaches, the textural features are generally derived from the Fourier transform for understanding the periodicity in texture patterns of the leather [7]. Wavelet transform is applied for feature extraction and segmentation of defective regions [8]. It is found that many image processing techniques including histogram, edge detection, Gabor filters, Fourier transform, wavelet transform have been applied for understanding textures and defects in leather for machine vision based visual inspection. However, these methods have high computational requirements and low accuracy of defect detection due to the complexity and nature leather defects in the texture pattern of leather surface.
In order to improve the accuracy of leather defect detection, few researchers have attempted artificial intelligence, machine learning and classifier based approaches. Kwak et al. presented a method based on decision trees for the classification of leather surfaces using geometric and statistical descriptors of leather texture. Fuzzy logic based image processing technique is employed for analysing features set of the leather images to perform the surface defects recognition [9]. A deep learning approach using convolutional neural network is proposed for an automatic leather grading system [10]. Lovergine et al. used a leather patch as a unit for the classification of leather surface based on local consistency and gradient orientation [11]. Auto adaptive edge detection method is developed for leather defect detection [12]. Vianaet. al. adopted support vector machine for leather defect classification [13]. Liu et al. [14] developed feed forward neural network with decision tree for obtaining attributes and classification of leather surface defects. Amorim et al used different classifiers such as decision tree C4.5, nearest neighborhood, Naïve Bayes and support vector machine for leather defect classification [15]. Pereira et al. applied nearest neighborhood, multi-layer perceptron, and support vector machine for leather defect identification [16]. In order to improve the accuracy of fault classification, method based on the Support Vector Machines Classifier (SVC) with wavelet packet decomposition (WPD) is presented to perform a multi-class classification task [17].
It is found that there are rapid advancements in machine vision based image processing applications for leather defect inspection. Many image processing techniques and machine learning based classifier techniques have been proposed by various researchers for leather grading, defect classification applications. However, the accuracy of defect detection is still a concern due to complexity, random nature of defects and color texture patterns of leather. With a focus on improving the accuracy of defect detection in leather surface and reducing the computational requirements, this paper presents a perceptron neural network based classifier approach for leather defect detection using statistical texture feature extraction.
In this work, the leather images are acquired by a machine vision system in a controlled environment, pre-processed before performing the feature extraction using gray level co-occurrence matrix (GLCM). A perceptron neural network is developed by training to classify the defective and non-defective leather image sample.
2.1 Leather image acquisition
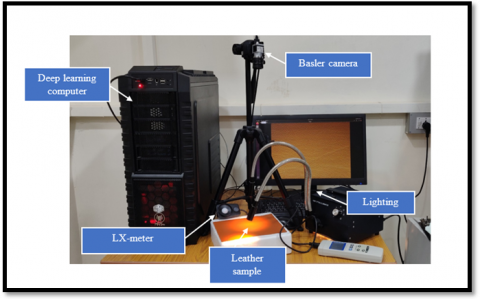
In the present work, a machine vision system consisting of a high resolution CMOS camera (BASLER acA4600), Personal computer with MATLAB software (Version. 2019a) is established for acquisition of leather images. The leather images were captured under a controlled lighting condition and the camera was mounted on an adjustable stand at a distance of 10 cm as shown in Figure 1.
Figure 1. Machine vision inspection system for defect identification in leather samples
Technical specification of the high resolution camera used for the acquisition of leather images is shown in Table 1. It is capable of acquiring images with a resolution of 4608pixels ×3288 pixels and it is suitable for identifying finer details of different defects in the leather.
In this work, an image library consisting of 2000 defective and non-defective leather images is built using the machine vision system. Figure 2 shows the acquired leather images samples with typical defects such as folding marks, grain off, growth marks, loose grain, pin holes. The nature of texture patterns of these leather defects is found to be different for the visual perception. In order to reduce the computations of defect identification in leather, the acquired color images of the leather samples are converted into gray scale and their intensity variations are analysed and it is explained in the next section.
Table 1. Specifications of camera used for leather image acquisition
|
Specifications |
Description |
|
Sensor type |
CMOS |
|
Sensor size |
6.5mm×4.6mm |
|
Resolution(H×V) |
4608 px×3288 px |
|
Resolution |
14MP |
|
Pixel size (H×V) |
1.4 μm×1.4 μm |
|
Frame rate |
10fps |
|
Mono/ color |
color |
|
Interface |
USB 3.0 |
Figure 2. Acquired images of leather samples
2.2 Gray intensity analysis of leather defects
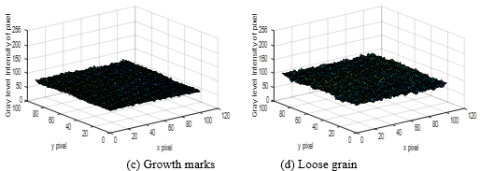
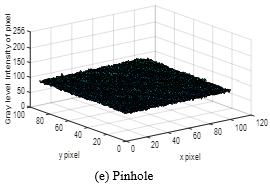
Figure 3 shows the respective gray level intensity values of different leather defects for the leather images shown in Figure 2. Folding marks in the leather surface shows a large change in intensity values for a short distance as visualized in Figure 3(a). Grain off, growth marks and pinhole defects show the random and non-uniform variation in intensity in the isolated spatial regions of the pixels as depicted in Figure 3 (b), (c) and 3(e) respectively. Loose grain defect is found to be finer in nature and it shows uniform gray level the specific spatial locations of pixels as shown in Figure 3(d).
Though the folding mark can be identified easily by the visual perception in the leather images, detection of other leather defects such as grain off, growth marks, loose grain, and pin holes requires a more detailed image processing algorithms due to the finer size and the nature of the texture patterns.
Figure 3. Defective leather samples and its gray level intensity variations
As the single pixel statistics do not provide rich enough descriptions of textures for practical applications, Grey Level Co-occurrence Matrix (GLCM) is used for interpreting the nature of the texture pattern of the leather surface in the present work. In order to implement an automated visual inspection and classification of leather samples in an industrial environment, a perceptron neural network is established for classifying the defective and non-defective leather samples. The steps involved in the proposed method are shown in Figure 4 and it is explained in this section.
3.1 Division and indexing of leather images
In order to identify the location of defects in the given leather image, the given leather image of size (M x N) 4608 pixels ×3288 pixels is partioned with a non overlapping block of size (m x n) 200 x 150 and it is indexed as f(i,j). Here i = 1,2,3.....M/m, j=1,2,3,....N/n.
Figure 4. Block diagram of leather defect classification approach using perceptron neural network
3.2 GLCM for leather samples with different defects
For image block of size m x n, Grey Level Co-occurrence Matrix is constructed by counting all pairs of a reference and neighboring pixel separated by an offset (d) having the gray levels i and j at the specified relative orientation (θ) as given below:
P[i,j|d,ө]=nij (1)
where, nij is the number of occurrences of reference and neighbouring pixels (i,j) lying at offset (d) in the image. Further, the elements of GLCM P[i,j] are normalised by dividing each entry by the total number of pixel pairs.
The number of rows and columns of co-occurrence matrix P[i,j] is equal to the number of distinct gray levels (n). A GLCM is calculated at four different orientations (0o, 45o, 90o and 135o) and offsets (d=-3,-2,-1,0,1,2,3) for the given gray scale image. For reducing the computational burden of calculating GLCM for the given image, the gray level was set to 32. A typical GLCM matrix converts the raw counts to probability values by dividing each count by the sum of all counts to produce a normalized co-occurrence matrix.
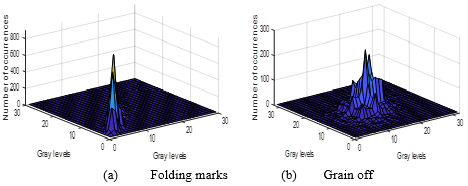
Figure 5 shows the calculated GLCM for the given leather image samples with different defects as depicted in Figure 2. From Figure 5 (a), it can be noticed that there are more number of occurrences for pixels having the gray levels between 0-15 for the folding mark defect in the leather surface as compared to the other gray levels. Grain of defect showed different gray level variations between 5-15 as compared to folding mark defect and it indicates the change in nature of the texture for different defects in the leather surface. The number of occurrences of gray levels between 10-20 is found to be higher for the growth marks as shown in Figure 5(c). Though the loose grain and pinhole defects showed similar gray level variations between 5-15, the magnitude of number of occurrences of the gray levels is found to be different.
Though GLCM provides a numerical data about the texture in a matrix, it is not directly useful for the comparison of textures of defective and non-defective leather samples. Hence numerical texture features are extracted from GLCM as they represent the texture of the leather surface more compactly.
3.3 Texture feature extraction of the leather image
Among the various texture features such as contrast, correlation, dissimilarity, energy, entropy, homogeneity, mean, and variance are calculated using GLCM as these features are found to be statistically significant for the classification of leather samples. The formulae for calculating the different texture features from GLCM of an image are highlighted in Table 2.
Figure 5. GLCM for the different defective leather samples
Table 2. Texture features used for leather defect identification
|
Texture parameters |
Description |
|
$Entropy=\underset{i=0}{\overset{ng-1}{\mathop{\sum }}}\,\underset{j=0}{\overset{ng-1}{\mathop{\sum }}}\,-{{p}_{ij}}*\log {{P}_{ij}}$ |
statistical randomness of the leather surface |
|
$Correlation=\frac{\underset{i=0}{\overset{ng-1}{\mathop{\sum }}}\,\underset{j=0}{\overset{ng-1}{\mathop{\sum }}}\,-(i,j)p(i,j)-{{\mu }_{x}}{{\mu }_{y}}}{{{\sigma }_{x}}{{\sigma }_{y}}}$ |
linear dependency of grey levels of neighbouring pixels |
|
$Contrast=\underset{i,j=0}{\overset{ng-1}{\mathop{\sum }}}\,{{p}_{i,j}}{{(i-j)}^{2}}$ |
measure of the intensity between a pixel and its neighbour |
|
$Energy=\underset{i,j=0}{\overset{ng-1}{\mathop{\sum }}}\,{{p}^{2}}_{i,j}$ |
orderliness of pixels |
|
$Homogeneity=\underset{i,j=0}{\overset{ng-1}{\mathop{\sum }}}\,\frac{{{p}_{i,j}}}{1+{{(i-j)}^{2}}}$ |
smoothness of the gray level distribution |
|
$Dissimilarity=\underset{i,j=0}{\overset{ng-1}{\mathop{\sum }}}\,{{p}_{i,j}}\left| i-\left. j \right| \right|$ |
measure of distance between pairs of pixels |
|
$Mean\,\,\,\,{{\mu }_{i}}=\underset{i,j=0}{\overset{ng-1}{\mathop{\sum }}}\,i({{P}_{i,j}})$ |
estimate of the average intensity of all pixels |
|
$Variance\,\,\,\,\,\,{{\sigma }^{2}}_{i}=\underset{i,j=0}{\overset{ng-1}{\mathop{\sum }}}\,{{p}_{i,j}}{{(i-{{\mu }_{i}})}^{2}}$ |
dispersion of gray level distribution of pixels |
In this work, the texture features are extracted from the library of leather image samples using GLCM and they were further analysed for the classification of defective and non-defective samples using perceptron neural network.
3.4 Perceptron neural network approaches
In the present work, single layer and multi-layer perceptron neural approaches have been developed for leather defect detection and classification applications.
3.4.1 Single layer perceptron neural network
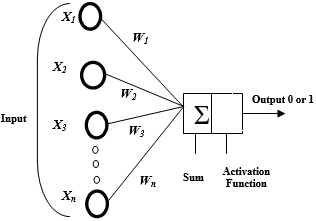
Due to its simplicity in computation and its effectiveness in real time practical applications, a single neuron perceptron neural network is established for the classification of defective and non-defective leather images using the extracted texture features of the leather images. The schematic diagram of the perceptron neural network with the input neurons (x1, x2, ..., xn), associated weights (w1, w2, ..., wn), summing junction, activation function (f) and the output (y) is shown in Figure 6.
Here, the input refers to the texture feature vector (x1, x2, ..., xn) such as contrast, correlation, dissimilarity, energy, entropy, homogeneity, mean, variance. Perceptron produces the binary output (y) using an activation function (f) based on the weighted sum of input values as given by the Eq. (2).
y=f(w1x1+...+wnxn)=f(WX) (2)
Here W = (w1, w2, ..., wn) and it is the weight vector.
X = (x1, x2, ..., xn) and itis the texture feature vector of the leather image, f is the step activation function, y is the output of the neural network.
In this approach, perceptron neural network is trained with a large amount of leather image data to best describe the features of the input data for adjusting weights. Training of the perceptron neural network is initialized with a labelled data set (x1, x2, ..., xn, ytarget) and the random weights (w1, w2, ..., wn) for achieving the desired classification (y = 0 or 1). The error (e) in classification is computed and correction is carried out by changing the magnitude weights (∆w) iteratively using perceptron learning algorithm until the desired classification is achieved.
(a) Single layer perceptron neural network
(b) Multi-layer perceptron neural network
Figure 6. Schematic diagram of perceptron neural network
3.4.2 Multi-layer perceptron neural network
In order to classify the leather defects in the leather images, a multi-layer perceptron with hidden layers is developed and the typical architecture is shown in Figure 6(b). One hot encoding scheme is used to define the target values for the different leather defects as shown in Table 4. Based on the mean square error cost function as given by Eq. (3), Feed forward architecture with gradient descent method is used to optimize the weights to reduce the errors in the output layer using sigmoid activation functions.
$C(w, b) \equiv \frac{1}{2 n} \sum_{x}\|y(x)-a\|^{2}$ (3)
Here, w refers to the weights of the network, b denotes biases, n is the total number of training inputs, a is the vector of outputs from the network when x is input.
The gradient descent update rule for the weights and bias is given by the following equations
$w_{k} \rightarrow w_{k}^{\prime}=w_{k}-\eta \frac{\partial C}{\partial W_{k}}$ (4)
$b_{l} \rightarrow b_{l}^{\prime}=b_{l}-\eta \frac{\partial C}{\partial b_{l}}$ (5)
Proposed multi-layer perceptron has five neurons for classifying the leather defects Grain off, loose grain, growth marks, pinhole along with the non-defective leather. For the robust development of proposed perceptron neural network, perceptron neural network needs to be validated and tested using unseen data set. Validation data is used for network generalization to prevent the architecture from over fitting or under fitting. The testing samples are used to evaluate the classification performance of the unseen input data to examine the robustness of the neural network architecture. It is ensured that there is no overlapping of the images.
Proposed perceptron neural network for leather image classification and image processing routines using perceptron neural network are implemented in MATLAB environment. This section presents the image processing results for texture feature extraction of leather samples and classification results of perceptron for leather images. These images are converted to grey scale format before processing for extracting the statistical texture features using GLCM matrix. The testing and validation results of the proposed perceptron classifier are also presented in this section.
4.1 Extracted texture features of defective and non-defective leather samples
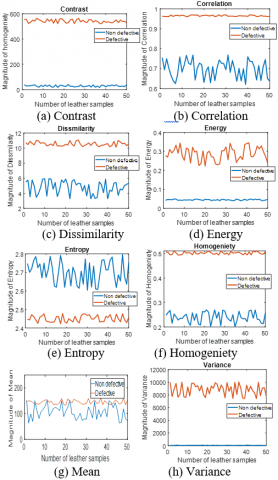
Figure 7 shows the typical values of extracted texture features like contrast, correlation, dissimilarity, Energy, Entropy, Homogeneity, Mean, and Variance for the 50 leather samples using GLCM. It can be noticed that there is clear magnitude variations between different features for the defective and non-defective leather samples
Figure 7. Comparison of extracted statistical texture features of leather samples
4.2 Training of perceptron neural network
In order to ensure the robust and accurate classification of defective and non-defective samples, the labelled data set of 1232 leather images are considered for training the neural network. The sample values of training data set and the corresponding target of the perceptron are shown in Table 3. Here the defective and non-defective class of leather samples are identified as 0 and 1 respectively.
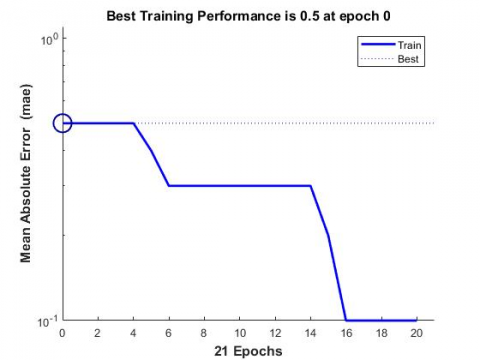
Perceptron learning algorithm is applied to train the network for the given input data and convergence of the iteration is reached in 21 epochs. The best training performance is reached in 25 epochs for the minimum absolute errors as shown in Figure 8.
Figure 8. Training results and performance of proposed perceptron neural network
Table 3. Sample values of training data set for the single layer perceptron neural network
|
Texture parameters |
||||||||
|
Contrast |
Dissimilarity |
Homogeneity |
Entropy |
Energy |
GLCM mean |
GLCM variance |
GLCM correlation |
Class |
|
41.26 |
4.796 |
0.200 |
2.832 |
0.047 |
63.37 |
55.33 |
0.627 |
0 |
|
66.64 |
6.036 |
0.167 |
3.022 |
0.038 |
71.70 |
87.94 |
0.621 |
0 |
|
52.82 |
5.343 |
0.186 |
2.953 |
0.041 |
85.20 |
78.71 |
0.664 |
0 |
|
23.25 |
3.726 |
0.237 |
2.626 |
0.057 |
151.13 |
33.46 |
0.652 |
0 |
|
17.60 |
3.196 |
0.272 |
2.611 |
0.058 |
154.92 |
38.96 |
0.774 |
0 |
|
62.47 |
5.725 |
0.178 |
3.004 |
0.039 |
69.30 |
89.29 |
0.650 |
1 |
|
25.87 |
3.777 |
0.244 |
2.708 |
0.054 |
130.16 |
46.94 |
0.724 |
1 |
|
63.69 |
5.882 |
0.171 |
3.020 |
0.038 |
78.22 |
90.34 |
0.647 |
1 |
|
31.50 |
4.298 |
0.213 |
2.752 |
0.050 |
185.08 |
45.84 |
0.656 |
1 |
|
82.41 |
6.648 |
0.156 |
3.108 |
0.034 |
69.42 |
110.77 |
0.628 |
1 |
Table 4. Sample values of training data set for the multi layer perceptron neural network
|
Texture parameters |
||||||||||||||||
|
Name of the defects |
Contrast |
Dissimilarity |
Homogeneity |
Entropy |
GLCM mean |
GLCM variance |
GLCM correlation |
Classification |
||||||||
|
Non-defective |
41.26 |
4.79 |
0.21 |
2.83 |
63.37 |
55.33 |
0.62 |
1 |
0 |
0 |
0 |
0 |
0 |
|||
|
Loose grains |
519.7 |
10.7 |
0.51 |
2.42 |
150.91 |
9583.7 |
0.97 |
0 |
1 |
0 |
0 |
0 |
0 |
|||
|
Grain off |
350.0 |
14.73 |
0.06 |
3.46 |
38.49 |
198.96 |
350.04 |
0 |
0 |
1 |
0 |
0 |
0 |
|||
|
Growth marks |
801.0 |
22.50 |
0.04 |
3.79 |
52.84 |
479.62 |
801.04 |
0 |
0 |
0 |
1 |
0 |
0 |
|||
|
Pinhole |
498.1 |
17.06 |
0.06 |
3.59 |
68.93 |
271.71 |
0.08 |
0 |
0 |
0 |
0 |
0 |
1 |
|||
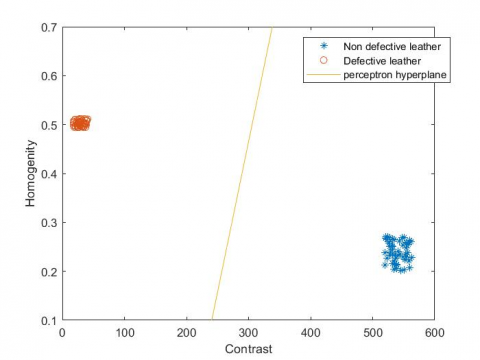
Estimated weight vector for the given training samples of input feature vector using the perceptron algorithm is found to be W = [-2387.63 -289.793 -165.742 -4735.84 5524.64 -36.517 -2.185 -10.654]’. Using these weight values, a hyper plane is computed for the given feature vectors to classify the defective and non-defective leather samples. Figure 9 shows the calculated hyper plane for the input features such as contrast and homogeneity. It can be noticed that all the leather samples are classified between the defective and non-defective class.
Figure 9. Estimated hyper plane for the classification of defective and non-defective leather samples
Further, a labeled data set of 1232 leather images are considered for training multi layer neural network for the classification of leather defects. The sample values of the training data set and the corresponding target of the perceptron are shown in Table 4.
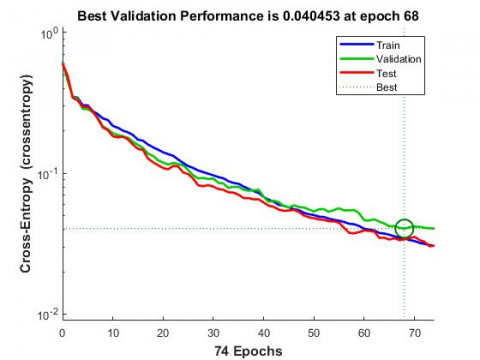
Figure 10 shows the training and validation performance of the proposed neural network. It is found that the best validation performance is achieved at 68 epochs with the minimum mean square error value of 0.040453.
Figure 10. Training and validation performance of proposed neural network
4.3 Classification performance of multi layer perceptron
In order to quantify the classification performance of the proposed neural network, confusion matrix is constructed as it provides the information on the actual and predicted classifications of leather surfaces. Based on the confusion matrix, metrices like precision, false discovery rate, sensitivity, false positive rate and accuracy are calculated as given by the following equations:
Precision (Positive Prediction Value) $=\frac{T P}{T P+F P}$ (6)
False Discovery Rate $=F P /(F P+T P)$ (7)
Sensitivity (true positive rate $)=\frac{T P}{T P+F N}$ (8)
False positive rate $=\frac{F N}{F N+T P}$ (9)
Overall accuracy $=\frac{T P+T N}{T P+T N+F P+F N}$ (10)
where, TP (true positive) is the correctly classified positive leather samples, TN (true negative) is the correctly classified negative leather samples FP(false positives) is the incorrectly classified negative samples and FN (false negative) is the incorrectly classified positive leather samples.
Figure 11 shows the confusion matrix of the proposed perceptron neural network for the training, testing and validation data. Here the diagonal elements represent the correct classifications whereas all the other entries show misclassifications. High numbers in green cells represent for correct responses and the low numbers in red cells corresponds to incorrect responses. The percentage values in the far right column of the confusion matrix shows the precision (or positive predictive value) and false discovery rate of proposed neural network for the classification of each class of leather. Further, the bottom row of the confusion matrix shows the sensitivity and false positive rate. The bottom right cell of the confusion matrix shows the overall accuracy of the prediction and it is found to be 94.2%.
Figure 11. Confusion matrix of the proposed neural network classifier for training, testing and validation data sets
4.4 Testing and validation of perceptron neural network
In order to test and validate the performance of the proposed perceptron neural network, a data set consisting of 1232 samples of defective and non-defective leather samples are presented and the classification results are analysed. A computing system of 64 bit 8 GB RAM, 2.70 GHz is used for defect detection and classification applications in MATLAB Version 2020. The detection time for the leather defect classification is found to be 0.5 sec. Table 5 shows the classification accuracy of the proposed method for different defects and it is found to be higher than the existing techniques such as support vector machine [16], feed forward neural network [15].
It is noted the trained perceptron neural network is able to recognize leather defects and the overall accuracy of classification is found to be 94.2%. These results indicate the improved classification performance of the proposed method for leather defect detection and classification applications.
Table 5. Accuracy of classification of leather defects
|
Type of sample |
Samples of training set |
Accuracy |
|
Non defective |
251 |
94.4% |
|
Grain off |
250 |
94.5% |
|
Growth marks |
240 |
92.2% |
|
Loose grains |
241 |
94.3% |
|
Pinhole |
250 |
95.3% |
4.5 Detection of defects in leather images
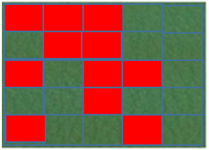
In the proposed method, the given image is divided and indexed using non over lapping image blocks of size 200 x 150 for detecting the leather defects. Presence of defect in the given image block is identified by the perceptron neural network and it is marked in red color as shown in Figure 12.
Figure 12. Defect detection in leather images using proposed method
From these results, it is found that proposed method is useful in detecting and locating the defects in the leather images. Proposed machine vision based method using perceptron neural network can be implemented in an industrial environment for the leather defect detection and classification applications.
This paper presented perceptron based neural network approaches for the leather defect detection and classification by using GLCM based texture analysis. The nature of texture pattern of different leather defects such as folding marks, grain off, growth marks, loose grain, pin holes are found to be distinct and it is clearly identified by using GLCM with a grey level of 32 for the window size of 200 x 150. A significant change in number of occurrences of grey levels is visualized in GLCM for different leather defects. These results prove the effectiveness of GLCM for distinguishing the different leather defects.
Single layer and multi-layer perceptron neural network are applied for discriminating the defective, non-defective leather samples using labelled data set of extracted texture features like contrast, correlation, dissimilarity, energy, entropy, homogeneity, mean and variance and convergence of the iteration is reached in 68 epochs. In the proposed method, the given image is divided and indexed using non over lapping image blocks of size 200 x 150 for detecting the leather defects. Proposed method achieves an improved classification accuracy of 94.2% as compared to the existing methods. The proposed leather defect detection and classification method requires lesser computational requirements and it can be suitably implemented for automated visual inspection of leather defects.
Authors thank Science Engineering Research Board, New Delhi for proving research funding to establish the machine vision system through Early Career Research Grant (DST No: SB/FTP/ETA-276/2012). Authors thank Management of Vellore Institute of Technology, Vellore and K.H. Leather Private Limited, Vellore, Tamil Nadu, India for providing necessary infra structural facilities and leather samples respectively.
[1] He, F.Q., Wang, W., Chen, Z.C. (2006). Automatic visual inspection for leather manufacture. Key Engineering Materials, 326-328: 469-472. http://dx.doi.org/10.4028/www.scientific.net/KEM.326-328.469
[2] Kohli, P., Garg, S. (2013). Leather quality estimation using an automated machine vision system. IOSR Journal of Electronics and Communication Engineering (IOSR-JECE), 6(3): 44-47. http://dx.doi.org/10.9790/2834-0634447
[3] Aslam, M., Khan, T.M., Naqvi, S.S., Holmes, G., Naffa, R. (2019). On the application of automated machine vision for leather defect inspection and grading: A survey. IEEE Access, 7: 76065-176086. http://dx.doi.org/10.1109/ACCESS.2019.2957427
[4] Krastev, K., Georgieva, L., Angelov, L. (2004). Leather features selection for defects recognition using fuzzy logic. CompSysTech '04: Proceedings of the 5th International Conference on Computer Systems and technologies, pp. 1-6. https://doi.org/10.1145/1050330.1050367
[5] Haralick, R.M., Shanmugam, K., Dinstein, I. (1973). Textural features for image classification. IEEE Transactions on Systems, Man and Cybernetics, 3(6): 610-621. https://doi.org/ 10.1109/TSMC.1973.4309314
[6] Daugman, J.G. (1985). Uncertainty relation for resolution in space, spatial frequency and orientation optimized by two- dimensional visual cortical filters. Journal of the Optical Society of America, 2(7): 1160-1169. https://doi.org/10.1364/JOSAA.2.001160
[7] Azencott, R., Wang, J.P., Younes, L. (1997). Texture classification using windowed Fourier filters. IEEE Transactions on Pattern Analysis and Machine Intelligence, 19(2): 148-153. https://doi.org/10.1109/34.574796
[8] Unser, M. (1995). Texture classification and segmentation using wavelet transforms. IEEE Transaction on Image Processing, 4(11): 1549-1560. http://dx.doi.org/10.1109/83.469936
[9] Kwak, C., Ventura, J.A., Tofang-Sazi, K. (2001). Automated defect inspection and classification of leather fabric. Intelligent Data Analysis, 5(4): 355-370. http://dx.doi.org/10.3233/ida-2001-5406
[10] Liong, S.T., Gan, Y.S., Huang, Y.C., Yuan, C.A., Chang, H.C. (2019). Automatic defect segmentation on leather with deep learning. https://arxiv.org/abs/arXiv:1903.12139
[11] Lovergine, F.P., Branca, A., Attolico, G., Distante, A. (1997). Leather inspection by oriented texture analysis with a morphological approach. Proceedings of International Conference on Image Processing, pp. 669-671. http://dx.doi.org/10.1109/ICIP.1997.638584
[12] Kasi, M.K., Rao, J.B., Sahu, V.K. (2014). Identification of leather defects using an autoadaptive edge detection image processing algorithm. 2014 International Conference on High Performance Computing and Applications (ICHPCA), pp. 1-4. http://dx.doi.org/10.1109/ICHPCA.2014.7045326
[13] Viana, R., Rodrigues, R.B., Alvarez, M.A., Pistori, H. (2007). SVM with stochastic parameter selection for bovine leather defect classification. PSIVT 2007: Advances in Image and Video Technology, 600-612. http://dx.doi.org/10.1007/978-3-540-77129-6_52
[14] Liu, B., Wu, S.J., Zou, S.F. (2010). Automatic detection technology of surface defects on plastic products based on machine vision. 2010 International Conference on Mechanic Automation and Control Engineering, Wuhan, pp. 2213-2216. https://doi.org/10.1109/MACE.2010.5536470
[15] Amorim, W.P., Pistori, H., Pereira, M.C., Jacinto, M.A.C. (2010). Attributes reduction applied to leather defects classification. 2010 23rd SIBGRAPI Conference on Graphics, Patterns and Images, pp. 353-359. http://dx.doi.org/10.1109/SIBGRAPI.2010.54
[16] Pereira, R.F., Medeiros, C.M.S., Filho, P.P.R. (2018). Goat leather quality classification using computer vision and machine learning. 2018 International Joint Conference on Neural Networks (IJCNN), pp. 1-8. http://dx.doi.org/10.1109/IJCNN.2018.8489265
[17] Cui, J., Wang, Y.R. (2010). A novel approach of analog fault classification using a support vector machines classifier. Metrology and Measurement Systems, XVII(4): 561-582. http://dx.doi.org/10.2478/v10178-010-0046-0