Zhigang Yu | Guoman Huang* | Chenxi Zhang
© 2020 IIETA. This article is published by IIETA and is licensed under the CC BY 4.0 license (http://creativecommons.org/licenses/by/4.0/).
OPEN ACCESS
The surface deformation caused by coalmining generally consists of surface settlement in the mining period and the surface uplift after the closure of the coalmine. This paper attempts to disclose the features of surface deformation after the closure of coalmines in Zibo coalfield. The coalmines in the study area was observed and analyzed in two stages: the mining period and the post-closure period. The spatial distribution and rate of surface deformation were estimated based on the images taken by Envisat’s advanced synthetic-aperture radar (ASAR) in the first stage, and based on Sentinel-1A/B images in the second stage. According to the results of small baseline interferometric synthetic aperture radar (SBAS-InSAR), most coalmines in the study area uplifted after closure, and the uplift areas in the second stage basically corresponded to the settlement areas in the first stage. But the uplifts in the settlement basins were more obvious. In the five settlement basins in the south, the uplifts are about 41%, 58%, 34%, 48%, and 35% of the peak settlements, respectively, with an average of 42%. In addition, the time series of surface uplift was not linear, but followed the Richards equation of biological growth. The maximum uplift rate was 170mm/year. The surface uplift is directly caused by the rise of groundwater level, and also affected by local geology. Finally, there is no direct correlation between underground mining location and surface uplift. The research shed new light on the complex surface deformation after the closure of coalmines.
coalmine, surface deformation, settlement, uplift, time series, interferometric synthetic aperture radar (InSAR)
The surface deformation induced by coalmining is a long and complex process. There are two distinctive stages of this process, namely, surface settlement and surface uplift. Surface settlement occurs during coalmining, due to roof collapse, fracturing, and groundwater extraction [1-3]. This phenomenon usually takes place above the target coal seam, forming a settlement basin [4]. The surface uplift happens after the coalmine is closed and the pumping is halted, as the groundwater flows back to restore the hydrostatic equilibrium.
At the end of the 20th century, surface uplifts were observed in several coal basins in Belgium, France, Germany, and Poland, after the largescale closure of coalmines across Europe [5-7]. By 2018, a total uplift of about 0.5m had been recorded. Once a coalmine is closed, the surface deformation could last for over a decade [8, 9].
Targeting the longwall panels of closed coalmines, Vervoort and Declercq [10] reported that the maximum surface uplift occurred in different areas from the maximum residual settlement, but the magnitude of surface uplift and residual settlement was the same. In general, surface uplift is about 2-4% of surface settlement [5]. Pöttgens [11] suggested that the rise of groundwater in the coalmine pushes up the pore pressure, which in turn triggers the surface uplift. Whitworth [12] observed that the recovery of mine water followed an exponential curve, and the recharge rate decreased with time. Focusing on abandoned coalmines in Limburg, the Netherlands, Cuenca [13] found that groundwater level is greatly correlated with surface displacement induced by water influx.
The above studies mainly deal with the basic mechanism of surface deformation after the closure of coalmines in Europe. Surface deformation will become common in China, due to the closure of more and more coalmines. Both surface settlement and uplift of closed coalmines will threaten the surface infrastructures and buildings. To further understand the surface deformation in closed coalmines, it is very meaningful to probe into new cases in different regions.
More recently, repeat-pass spaceborne interferometric synthetic aperture radar (InSAR) has established a strong position in the detection of surface deformation [14-20]. This technology supports all-weather 24/7 monitoring of slow surface deformation in a wide area with fine spatial resolution and millimeter accuracy [21]. Compared with traditional measuring methods (e.g. Global Positioning System (GPS) and level meter), the repeat-pass spaceborne InSAR obtains densely distributed observation points, and provides detailed information about surface deformation, facilitating the monitoring of slow surface deformation.
In this paper, the small baseline InSAR (SBAS-InSAR) is introduced to monitor the surface deformation of main coalmines in Zibo coalfield before and after the closure process [22, 23]. Based on the monitored data, the authors analyzed the relationship between surface settlement and surface uplift, and the spatiotemporal features of surface uplift. The research results provide new insights to the surface deformation after the closure of coalmines.
Located in central Shangdong province, China, the study area (N: 36°29’20’’-36°48’30’’; E: 117°49’30’’-118°5’15’’) cover an area of 800km2 within Zibo coalfield. As part of the Zibo syncline basin, the study area is bounded by low and medium mountains on the south and east, and dotted with 9 main coalmines (e.g. Nanding mine) and multiple small coalmines.
The basic information of the study area is shown in Figure 1, where the locations of the main coalmines and the nearby Zhangzhao mine were superimposed on Google Maps, the blue pointer is the location of surface overflow in May 2016 after the closure of Shigu mine, and the photos were taken in May 2018.
Figure 1. The study area
Zibo coalfield is a Paleozoic North China coal-bearing deposit. From old to new, the strata are Ordovician, Carboniferous, Permian, and Quaternary. Among them, the upper Carboniferous Taiyuan formation is the main coal-bearing stratum. This formation provides 10 thin coal thins with a dip angle of 5-14°. Five of them are minable or partially minable.
The groundwater in the coalfield mainly includes Quaternary loose rock pore water, Carboniferous and Permian sandstone-shale stone fissure water, and Ordovician limestone fissure-karst water. Specifically, the Quaternary loose rock pore water is mainly supplied by atmospheric precipitation and surface water infiltration, and discharged through underground runoff, artificial exploitation, and phreatic water evaporation; Carboniferous and Permian sandstone-shale stone fissure water is mainly supplied by atmospheric precipitation and local Quaternary loose rock pore water, and discharged through artificial exploitation and water springs; Ordovician limestone fissure-karst water mainly comes from the infiltration of surface runoffs from southeastern mountains, which is replenished by precipitation in the mountains and blocked by the coal bearing strata, and discharged through lateral runoff, artificial mining, and water springs.
Originally, the three types of groundwater each has its own recharge and drainage system. However, the water systems are interconnected by cracks in the areas affected by coalmining. During the mining period, groundwater is mainly discharged through mine drainage.
Industrial mining in the study area can be traced back to 1904. Since then, underground mining has continued for over a century. By the end of the 20th century, the mineable coal reserves gradually depleted. As shown in Table 1, Zhaili mine was closed in 1987, Hongshan mine was shut down in 1994, Longquan mine ceased to operate in 2012, and the remaining mines were closed successively from 2014 to 2015.
Table 1. Closing time of coalmines in Zibo coalfield
|
Nanding |
Fengshui |
Shuanggou |
Hongshan |
Zhaili |
|
July 2014 |
October 2015 |
December 2015 |
April 1994 |
January 1987 |
|
Longquan |
Shigu |
Xihe |
Xiazhuang |
Zhangzhao |
|
January 2012 |
June 2015 |
July 2015 |
December 2014 |
October 2014 |
With the closure of coal mines, groundwater pumping also came to a halt, followed by a rebound of mine water level. For example, the mine water of Hongshan mine was below -200m during the mining period. After the coalmine was closed in April 1994, the mine water level increased rapidly, at an initial rate of 3.5m/d. The level rose to +45m in July 1996, and further grew to 73m in June 1997, flowing over along the north inclined shaft. Shigu mine was closed in June 2015. About 11 months later, overflow occurred in that mine. Overall, the study area has an abundance of groundwater, which is recharged at a fast rate.
3.1 Datasets
Table 2. List of ASAR images for InSAR analysis
|
Number |
Observed date |
Pass |
Track |
Orbit |
|
1 2 3 4 5 6 7 8 9 10 |
20060829 20070220 20070710 20090120 20091201 20100105 20100316 20100420 20100525 20100803 |
Descending Descending Descending Descending Descending Descending Descending Descending Descending Descending |
404 404 404 404 404 404 404 404 404 404 |
23504 26009 28013 36029 40538 41039 42041 42542 43043 44045 |
The study area was observed in two stages. In the first stage, the spatial distribution and rate of surface deformation were estimated based on ten L0-level images (descending pass; C-band) of the study area taken by Envisat’s advanced synthetic-aperture radar (ASAR) from August 29, 2006 to August 3, 2010 (Table 2). The topographic phase contributions were removed by the digital elevation model (DEM) data (spatial resolution: 30m) of Shuttle Radar Topography Mission (SRTM). The orbital accuracy of the ASAR images was improved based on the Doris orbit data released by the European Space Agency (ESA).
In the second stage, 134 Sentinel-1A/B images (descending pass; TOPS mode; C-band) captured on 99 days from March 2015 to December 2018 were analyzed (Table 3). The research area is located on the edge of these images. The ESA’s precise orbit ephemerides (POD) were adopted as the orbit data.
Table 3. List of Sentinel-A/B images for InSAR analysis
|
Data type |
Observed date |
Data type |
Observed date |
|||
|
Sentinel-1A descending |
20150308 |
20151221 |
Sentinel-1B descending |
20160928 |
20170619 |
20180226 |
|
20150401 |
20160102 |
20161010 |
20170701 |
20180310 |
||
|
20150519 |
20160114 |
20161022 |
20170713 |
20180322 |
||
|
20150612 |
20160126 |
20161103 |
20170725 |
20180403 |
||
|
20150624 |
20160207 |
20161115 |
20170806 |
20180415 |
||
|
20150706 |
20160219 |
20161127 |
20170818 |
20180427 |
||
|
20150718 |
20160302 |
20161209 |
20170830 |
20180509 |
||
|
20150730 |
20160314 |
20161221 |
20170911 |
20180521 |
||
|
20150811 |
20160326 |
20170102 |
20170923 |
20180602 |
||
|
20150823 |
20160407 |
20170114 |
20171005 |
20180614 |
||
|
20150916 |
20160419 |
20170126 |
20171017 |
20180626 |
||
|
20150928 |
20160513 |
20170207 |
20171029 |
20180708 |
||
|
20151010 |
20160525 |
20170219 |
20171110 |
20180720 |
||
|
20151022 |
20160606 |
20170303 |
20171122 |
20180825 |
||
|
20151103 |
20160630 |
20170315 |
20171204 |
20181012 |
||
|
20151115 |
20160712 |
20170327 |
20171216 |
20181024 |
||
|
20151127 |
20160817 |
20170408 |
20171228 |
20181105 |
||
|
20151209 |
20160829 |
20170502 |
20180109 |
20181117 |
||
|
20170514 |
20180121 |
20181129 |
||||
|
20170526 |
20180202 |
20181211 |
||||
|
20170607 |
20180214 |
20181223 |
||||
The surface settlement rate was extracted by SBAS-InSAR, a technology developed in 2002 to monitor the temporal evolution of surface deformation based on Small Baseline (SB) subset. The subset is defined by a pair of data with an SB, aiming to reduce spatial decorrelation. In other words, several SB subsets are combined to obtain all the available SB interferograms. The combination is processed by singular value decomposition (SVD), producing the time series of deformation. This technology overcomes the limitations of spatial decorrelation, temporal decorrelation, and atmospheric effect, demands fewer SAR data than permanent scatterer (PS)-InSAR [24, 25], and captures lots of reflectors in rural areas and vegetation covered areas [21].
The InSAR Scientific Computing Environment (ISCE) software was employed to process the InSAR data. The spatial and temporal decorrelations were minimized by Generic InSAR Analysis Toolbox (GIAnT), a suite of Python libraries and scripts that implement various published time-series InSAR algorithms in a common framework [26].
Then, a baseline network (Figure 2) was constructed in two steps: first, 30 interference pairs were generated based on ASAR images, with the time baseline threshold of 950d and space baseline threshold of 800m; next, 489 interference pairs were generated based on Sentinel-1A/B images, with the time baseline threshold of 75d and space baseline threshold of 150m.
In addition, the study area, lying in a mountainous area, is greatly affected by the stratified atmosphere. To remove the effect of stratified atmosphere, a DEM-based empirical approach was adopted. This approach assumes that the elevation is linearly correlated with interferometric phase. Hence, the atmospheric phase corresponding to an elevation can be estimated from the interferogram [27].
Figure 2. Spatial and temporal baselines of interferometric pairs
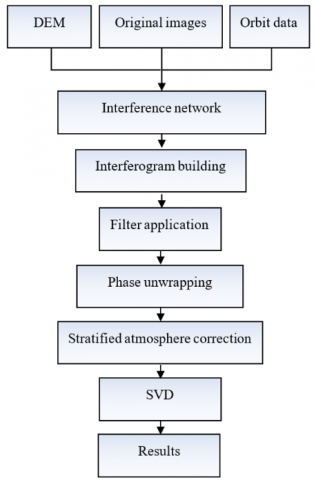
As shown in Figure 3, the procedure of SBAS data processing can be summarized as: Firstly, an interference network was generated based on the baseline parameters. Next, the interferograms were constructed, followed by filtering and phase unwrapping. After that, the stratified atmosphere was corrected empirically based on the DEM. Then, the SVD was carried out to calculate the interference network. Finally, the results were obtained from the time series of surface deformation rate.
Figure 3. Workflow of SBAS data processing
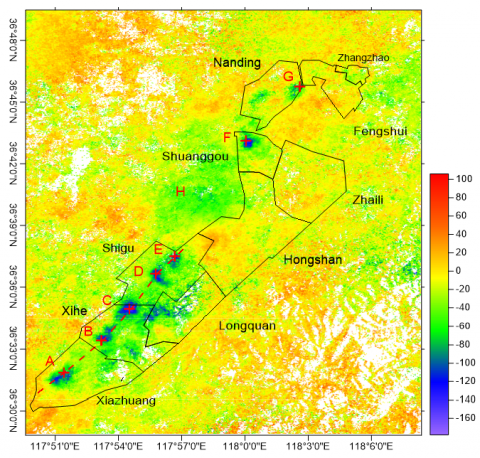
Focusing on vertical deformation, the line-of-sight (LOS) displacement was purely back projected to the vertical direction, in the light of local incidence angle [28]. In this way, two surface deformation maps of Zibo coalfield were retrieved, respectively for the first stage (Figure 4) and the second stage (Figure 5). Note that the positive values (red) indicate uplift motion or uplift rate, while negative values (blue) indicate settlement motion or settlement rate.
As shown in Figure 4, the surface deformation in the first stage was generally a downward motion. The settlement mainly occurred in operating coalmines, including Xiazhuang, Xihe, Longquan, and Shihu in the south, and Nanding and Shuanggou in the north. In total, seven settlement basins (A-G) were observed. The location of maximum settlement in each basin is marked with a red cross. The profile line passing through the centers of basins A-E is denoted as a red dotted line.
As shown in Figure 5, the surface deformation of the study area in the second stage was generally an upward motion. There are two main uplifting areas (I-N): Xiazhuang, Xihe, Longquan and Shigu in the south, and Fengshui and Nanding in the north. The surface uplift was insignificant in Shuanggou mine, while an obvious step was formed in Nanding mine (M). The maximum uplift appeared in Xihe mine (111m; 30mm/year). The center of the second uplift is indicated by a black cross.
Table 4 lists the center and cumulative settlement of each basin. The largest settlement basin was found in Shigu mine, with a settlement of -172mm (-43mm/year). This settlement basin is clearly the result of underground mining. No obvious deformation was observed in Fengshui mine, which is still in production, possibly due to the thickness of the coal seam. Similarly, no deformation was observed in Hongshan mine (closed in January 1987) and Zhaili mine (closed in April 1994). Notably, a 43km2 area of surface deformation (maximum: -90mm) was observed to the west of Hongshan mine (H in Figure 4), although no coalmine lies in this area.
Table 5 lists the center and cumulative settlement of each uplifting location. At point O in Figure 5 (corresponding to settlement basin H in the first stage), surface uplift took place in the second stage. The maximum cumulative uplift was 40mm (10mm/year). In the second stage, no sign of surface deformation was observed in Zhaili and Hongshan, both of which were closed early).
Figure 4. Cumulative settlement of the study area in the first stage (mm)
Figure 5. Cumulative uplift of the study area in the second stage (mm)
Table 4. Center and cumulative settlement of each settlement basin in the first stage
|
Location |
Longitude |
Latitude |
Cumulative settlement mm |
Settlement rate mm/year |
|
A |
117º51'31'' |
36º31'55'' |
-152 |
-38 |
|
B |
117º53'17'' |
36º33'29'' |
-154 |
-39 |
|
C |
117º54' 37'' |
36º34'58'' |
-169 |
-42 |
|
D |
117º55'54'' |
36º36'41'' |
-126 |
-32 |
|
E |
117º56'44'' |
36º37'32'' |
-172 |
-43 |
|
F |
118º00'04'' |
36º43'05'' |
-148 |
-37 |
|
G |
118º02'34'' |
36º45'43'' |
-122 |
-31 |
|
H |
117º58'08'' |
36º40'43'' |
-99 |
-25 |
|
Location |
Longitude |
Latitude |
Cumulative uplift mm |
Uplift rate mm/year |
|
I |
117º52'07'' |
36º31'31'' |
82 |
22 |
|
J |
117º53'41'' |
36º33'30'' |
111 |
30 |
|
K |
117º55'37'' |
36º34'25'' |
101 |
27 |
|
L |
117º56'49'' |
36º36'55'' |
91 |
24 |
|
M |
118º00'42'' |
36º43'50'' |
98 |
26 |
|
N |
117º58'34'' |
36º39'47'' |
72 |
11 |
Because the observation period only lasts 4.5 years, the authors did not observe continuous spatiotemporal evolution of surface deformation. However, the two-stage analysis provides new insights to surface deformation of the coalfield after the closure of mines.
5.1 Spatial correlation between settlement and uplift
The comparison between Figures 4 and 5 shows that, the settlement areas of the first stage basically correspond to the uplift areas of the second stage, although the settlement centers does not coincide with the uplift centers.
Figure 6 shows the profile of settlement centers A-E in the south (sandstone pattern) and that of the corresponding uplift areas (black curve). The profile line is about 20km from southwest to northeast. The data that are missing due to decorrelation in the first stage were neglected. It can be seen that the uplift curve was much gentler than the settlement curve, carrying no abrupt changes as the settlement curve. There is a bulge in the uplift curve of the second stage. The peak settlements of the five basins were 152, 154, 169, 126, and 172mm, and the corresponding uplifts were 63, 90, 58, 52, and 61mm, respectively. The uplifts are about 41%, 58%, 34%, 48%, and 35% of the peak settlements, respectively, with an average of 42%.
Figure 6. The profiles of settlement centers in the south and corresponding uplift areas
In the settlement profile, there is a -20 to -50mm (-5 to -12mm/year) settlement between the basins, in addition to the bowl-shaped settlements in the basins. The uplifts at the corresponding positions exceeded the settlements. These results demonstrate that uplift and settlement are roughly correlated, rather than proportionate to each other.
Mining operations can only proceed in dry space. During coalmining groundwater is continuously pumped out from the roadways and surrounding rocks, resulting in a decline of groundwater level in and around the mine. As a result, a depression cone is formed in the regional distribution of groundwater. After the coalmine is closed, the pumping immediately comes to an end. Then, the groundwater in the mine is recharged. The rising groundwater level leads to a rising pore pressure and the expansion of underground clay, which in turn bring surface uplift. The uplift is often proportional to the increment of groundwater level. In the settlement basins, the groundwater level rise faster than the surroundings. That is why the surface above the basins exhibits uplift motion.
5.2 Nonlinear evolution of uplift
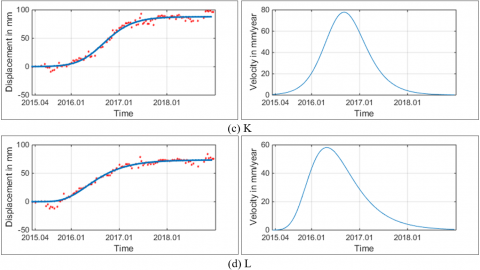
To quantify the surface uplift in the second stage, the time series of surface deformation at all uplift centers were plotted (Figure 7). In the left subgraphs, the red dots are the observed values of uplift, and the blue lines are fitted by the Richards equation. In the right subgraphs, the blue lines are the fitted curves of deformation rate.
As shown in Figure 7, the surface deformation was nonlinear in the second stage. The deformation at most uplift centers, except for I, could be divided into two phases: rapid uplift phase (the uplift rate increased to the peak before slowing down) and uplift mitigation phase (the uplift was slow and gradually dropped to zero, i.e. the deformation stabilized). Uplift center I was different from other uplift centers, due to the early closure of the mine (December 2014).
To fully understand the deformation features, the Richards equation [29] was employed to fit the deformation curve of each uplift center. This equation models the nonlinear biological growth: slow growth, fast growth, slow growth, and equilibrium. The data fitting helps to unveil the evolution law of deformation time series. The Richards equation can be expressed as:
Figure 7. Time series of deformation at each uplift center and fitted curves of deformation rate
Table 6. Fitting results of each uplift center in the second stage
|
Location |
Maximum deformation rate (mm/year) |
Average deformation rate (mm/year) |
Maximum-average ratio |
|
I |
170 |
22 |
7.7 |
|
J |
79 |
30 |
2.6 |
|
K |
78 |
27 |
2.9 |
|
L |
58 |
24 |
2.4 |
|
M |
77 |
26 |
3.0 |
|
N |
46 |
11 |
4.2 |
where, y(t) is the predicted deformation at time t; a is the progressive limit of deformation, i.e. final deformation; b is the initial deformation coefficient; k is deformation rate coefficient; m is the shape parameter of the deformation curve. The deformation rate at time t can be obtained through first-order derivation:
$v(t)=\frac{a b k}{1-m}\left(1-b e^{-k t}\right)^{\frac{m}{1-m}} e^{-k t}$ (2)
The fitting results (Figure 7) show that the surface deformation clearly sped up and then slowed down in the second stage. Table 6 lists the maximum deformation rates fitted at I-N. It is clear that the deformation process cannot be described reasonably with only one average value (Vervoort, 2016).
The nonlinear surface deformation is mainly attributable to the change of groundwater level. Once the mine is closed, the groundwater continues to flow towards the mine pit. As the drainage is terminated, the recharge amount far outnumbers the outward penetration. Thus, the groundwater level will rise at a faster speed. However, the higher the water level, the more the diversion channels. The outflow volume will continue to increase, and the water level will grow at an increasingly slow rate. The relationship between groundwater and surface water will become more and more complex. The groundwater level will reach the highest level, when the amount of pit water equals the amount of infiltration. The resulting dynamic equilibrium is different from the natural state and the normal production stage.
5.3 Influence of geological conditions
The above analysis suggests that in the south of the coalfield, each settlement center basically corresponds to an uplift (of course, this is not applicable to all mines). Take Shuanggou mine and its surroundings for example. In the first stage, the peak settlement of -148mm occurred on the northern surface of the mine, while almost no deformation took place in the second stage.
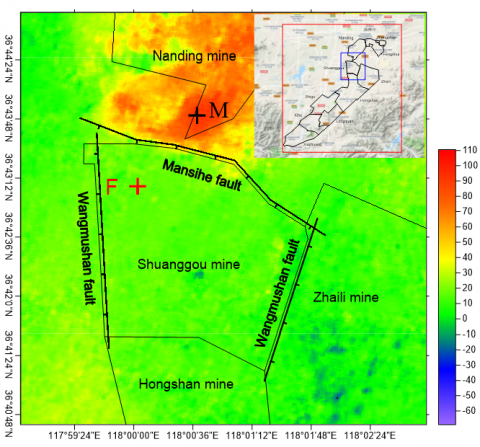
As shown in Figure 8, there was also a 60-80mm uplift step along Mansihe fault, i.e. the northern boundary of Shuanggou mine. Manshihe is an east-west trending fault with a drop of 60-80m, rising in the north and falling in the south. The fault does not contain any water. Shuanggou mine is bordered in the east by Panlongshan fault (drop: 140m), which rises in the west and falls in the east, in the west by Wangmushan fault (drop: 350-550m), and in the south by Hongshan mine, where sufficient protective coal pillars are reserved.
Figure 8. The uplift step in the north of Shuanggou mine
Shuanggou mine has simple hydrogeological conditions. There are four groups of aquifers in the mine: the aquifer group of Ordovician fissure limestone, the aquifer group of middle Carboniferous Xujiazhuang fissure limestone, the aquifer group of sandstones on coal seam roof and floor and thin fissure limestone, and the aquifer group of fissure sandstone above coal-bearing stratum. The first two groups have high water resistance, thanks to the even distribution of clay shale, mudstone and other water resisting strata. Most of the latter two groups are covered by upper Quaternary yellow laterite, whose underdeveloped fissures and weak water bearing property limit the infiltration of atmospheric precipitation.
Due to the above geological conditions, the groundwater was recharged slowly after Shuanggou mine was closed. As a result, the groundwater level rose by a limited margin. This explains why the surface deformation was unobvious in the mine, and why uplift step appeared along the Manshihe fault in the north. Of course, the surface of this mine will be lifted with further recharge of groundwater. It would be interesting to investigate the surface deformation in this area.
5.4 Relationship between surface uplift and underground mining location
Zhangzhao mine and the area in the northwest of Fengshui mine were analyzed to clarify the possible relationship between surface uplift and underground mining location.
Zhangzhao mine started operation in 1987 and was closed at the end of 2014. There are four minable coal seams: 0.57m-thick coal seam #3, 0.67m-thick coal seam #5, 0.62m-thick coal seam #10-1, and 1.01m-thick coal seam #10-2.
The northwest of Fengshui mine was included into the mine in 2004. In the south part of this area stands a petrochemical plant. Thus, the coal under this part was not mined. The mining operations in the northwest of Fengshui mine lasted from 2006 to October 2015. There are two minable coal seams: the 0.6-1.0m-thick coal seam #3, and the 1.01m-thick coal seam #5.
Figure 9 presents the distribution of mining locations in Zhangzhao mine and the northwest of Fengshui mine. In the first stage, no settlement was observed in either region. In the second stage, both regions were uplifted. The surface uplift of Zhanghao mine was between 10 and 57mm. The areas with greater-than-40mm uplift mainly concentrate in the south, center, and east of the mine. The largest uplift of 57mm appeared in area A. The other areas with greater-than-50mm uplift include areas B (50mm), C (51mm), D (51mm), and E (51mm). Among them, area C is the only area with mining operations.
The surface uplift in the northwest of Fengshui mine fell between 6 and 54mm. The areas with greater-than-40mm uplift concentrate in the southeast. The maximum uplift (54mm) appeared in the area of the petrochemical plant, though no mining operation was performed here. Among the areas with mining operations, the maximum settlement occurred in area B (44mm). Hence, mining location does not strictly correspond to surface uplift, and surface uplift might occur in non-mining areas.
The above phenomena demonstrate that coalmining not only affects the groundwater level, but also alter the original form of groundwater dynamic field, due to fault structure, mining fissures on the floor, and various manmade well holes. The mining operations may even cause the groundwater to move across strata, resulting in abnormal change of groundwater level. This indirectly leads to the uplift of the surface.
Figure 9. Relationship between surface uplift and underground mining location
Based on the SAR images collected in two stages, this paper monitors and characterizes the surface deformation after the coalmines in Zibo coalfield were closed. From the perspective of satellite observations, the research strategy sheds new light on the features of surface deformation after the closure of coalmines. The InSAR results show that the surface deformation in the study area is a nonlinear process affected by multiple factors. This finding is of great significance to the monitoring of surface environment, and the risk assessment of surface structures and buildings. Of course, there are some issues not fully explained in this research. For instance, a -90mm settlement and a 40mm uplift were observed to the west of Hongshan mine, where no coal mine is present. The deformations might be attributed to the falling groundwater level through excessive extraction, and the rebound of groundwater level after the government step up the management of water resources.
With the gradual depletion of coal resources, more and more coalmines will be closed. The closure will exert a long-lasting effect on the surface. The future research will discuss the relationship between surface deformation and even more factors, namely, groundwater level, mining conditions, coal seam depth, coal seam thickness, geological environment, geotechnical mechanics, and surface deformation. The future research will also assess the risks that surface deformation poses to surface infrastructures and buildings in the study area.
The ENVISAT ASAR and Sentinel-1A/B datas used in this study were freely provided by Copernicus and ESA, and the one-arc-second SRTM DEM data were freely downloaded from the website:
http://e4ftl01.cr.usgs.gov/MODV6_Dal_D/SRTM/SRTMGL1.003/2000.02.11/.
[1] Dai, H.Y., Guo, J.T., Yi, S.H., Wang, G.Y., Liu, A.J., Seituly, K., Zou, B. (2013). The mechanism of strata and surface movements induced by extra-thick steeply inclined coal seam applied horizontal slice mining. Journal of China Coal Society, 38(7): 1109-1115.
[2] Wagner, H., Schümann, E.H.R. (1991) Surface effects of total coal-seam extraction by underground mining methods. International Journal of Rock Mechanics & Mining Sciences & Geomechanics Abstracts, 91(7): 221-231. https://doi.org/10.1016/0148-9062 (92)92608-F
[3] Sheorey, P.R., Loui, J.P., Singh, K.B., Singh, S.K. (2000). Ground subsidence observations and a modified influence function method for complete subsidence prediction. International Journal of Rock Mechanics and Mining Sciences, 37(5): 801-818. https://doi.org/10.1016/S1365-1609(00)00023-X
[4] Singh, R.P., Yadav, R.N. (1995). Prediction of subsidence due to coal mining in Raniganj coalfield, West Bengal, India. Engineering Geology, 39(1-2): 103-111. https://doi.org/10.1016/0013-7952(94)00062-7
[5] Bekendam, R.F., Pöttgens, J.J. (1995). Ground movements over the coal mines of southern Limburg, The Netherlands, and their relation to rising mine waters. IAHS Publications-Series of Proceedings and Reports-Intern Assoc Hydrological Sciences, 234: 3-12. https://doi.org/10.1016/s0148-9062(97)87575-4
[6] Devleeschouwer, X., Declercq, P.Y., Flamion, B., Brixko, J., Timmermans, A., Vanneste, J. (2008). Uplift revealed by radar interferometry around Liège (Belgium): A relation with rising mining groundwater. In Proceedings of the Post-Mining Symposium, 6-8.
[7] Samsonov, S., d’Oreye, N., Smets, B. (2013). Ground deformation associated with post-mining activity at the French-German border revealed by novel InSAR time series method. International Journal of Applied Earth Observation and Geoinformation, 23(8): 142-154. https://doi.org/10.1016/j.jag.2012.12.008
[8] Vervoort, A., Declercq, P.Y. (2017). Surface movement above old coal longwalls after mine closure. International Journal of Mining Science and Technology, 27(3): 481-490. https://doi.org/10.1016/j.ijmst.2017.03.007
[9] Vervoort, A., Declercq, P.Y. (2018). Upward surface movement above deep coal mines after closure and flooding of underground workings. International Journal of Mining Science and Technology, 28(1): 53-59. https://doi.org/10.1016/j.ijmst.2017.11.008
[10] Vervoort, A. (2016). Surface movement above an underground coal longwall mine after closure. Natural Hazards & Earth System Sciences, 16(9): 2107-2121. https://doi.org/10.5194/nhess-16-2107-2016
[11] Pöttgens, J.J.E. (1985). Bodemhebung durch ansteigendes Grubenwasser [Uplift as a result of rising mine waters]. The Development Science and Art of Minerals Surveying, Proceedings 6th International Congress, International Society for Mine Surveying, Harrogate, United Kingdom, pp. 928-938.
[12] Whitworth, K.R. (2002). The monitoring and modelling of mine water recovery in UK coalfields. Geological Society, Special Publications, 198(1): 61-73. https://doi.org/10.1144/gsl.sp.2002.198.01.04
[13] Cuenca, M.C., Hooper, A.J., Hanssen, R.F. (2013). Surface deformation induced by water influx in the abandoned coal mines in Limburg, The Netherlands observed by satellite radar interferometry. Journal of Applied Geophysics, 88(1): 1-11. https://doi.org/10.1016/j.jappgeo.2012.10.003
[14] Herrera, G., Fernández, J.A., Tomás, R., Cooksley, G., Mulas, J. (2009). Advanced interpretation of subsidence in Murcia (SE Spain) using A-DInSAR data--modelling and validation. Natural Hazards & Earth System Sciences, 9(3): 647-661. https://doi.org/10.5194/nhess-9-647-2009
[15] Liu, X., Zhao, C., Zhang, Q., Yang, C., Zhang, J. (2019). Characterizing and monitoring ground settlement of marine reclamation land of Xiamen new airport, China with Sentinel-1 SAR Datasets. Remote Sensing, 11(5): 585. https://doi.org/10.3390/rs11050585
[16] Massonnet, D., Rossi, M., Carmona, C., Adragna, F., Peltzer, G., Feigl, K., Rabaute, T. (1993). The displacement field of the Landers earthquake mapped by radar interferometry. nature, 364(6433): 138-142. https://doi.org/10.1038/364138a0
[17] Senturk, S., Cakir, Z., Ustundag, B.B. (2016). The potential of Sentinel-IA interferometric SAR data in monitoring of surface subsidence caused by overdrafting groundwater in agricultural areas. 2016 Fifth International Conference on Agro-Geoinformatics (Agro-Geoinformatics), Tianjin, pp. 1-4 https://doi.org/10.1109/agro-geoinformatics.2016.7577632
[18] Fan, H.D., Xiaoxiong Gao, X.X., Yang, J.K., Deng, K. Z., Yu, Y. (2015). Monitoring mining subsidence using a combination of, phase-stacking and offset-tracking methods. Remote Sensing, 7(7): 9166-9183. https://doi.org/10.3390/rs70709166
[19] Zhou, L., Guo, J.M., Hu, J.Y., Li, J.W., Xu, Y.F., Pan, Y.J., Miao, S. (2017). Wuhan surface subsidence analysis in 2015-2016 based on sentinel-1A data by SBAS-InSAR. Remote Sensing, 9(10): 982. https://doi.org/10.3390/rs9100982
[20] Zhang, Q., Li, Y., Zhang, J., Luo, Y. (2019). InSAR technique applied to the monitoring of the Qinghai-Tibet Railway. Natural Hazards and Earth System Sciences, 19(10): 2229-2240. https://doi.org/ 10.5194/nhess-19-2229-2019
[21] Zhu, J.J., Li, Z.W., Hu, J. (2017). Research progress and methods of InSAR for deformation monitoring. Acta Geodaetica et Cartographica Sinica, 46(10): 1717-1733. https://doi.org/10.11947/j.AGCS.2017.20170350
[22] Berardino, P., Fornaro, G., Lanari, R., Sansosti, E. (2002). A new algorithm for surface deformation monitoring based on small baseline differential Sar interferograms. IEEE Transactions on Geoscience and Remote Sensing, 40(11): 2375-2383. https://doi.org/10.1109/tgrs.2002.803792
[23] Lanari, R., Mora, O., Manunta, M., Mallorqui, J.J., Berardino, P., Sansosti, E. (2004). A mall-baseline approach for investigating deformations on full-resolution differential SAR interferograms. IEEE Transactions on Geoscience and Remote Sensing, 42(7): 1377-1386. https://doi.org/10.1109/tgrs.2004.828196
[24] Ferretti, A., Prati, C., Rocca, F. (2000). Nonlinear subsidence rate estimation using permanent scatterers in differential SAR interferometry. IEEE Transactions on Geoscience and Remote Sensing, 38(5): 2202-2212. https://doi.org/10.1109/36.868878
[25] Ferretti, A., Prati, C., Rocca, F. (2001). Permanent scatterers in SAR interferometry. IEEE Transactions on Geoscience and Remote Sensing, 39(1): 8-20. https://doi.org/10.1109/36.898661.
[26] Agram, P.S., Jolivet, R., Riel, B., Lin, Y.N., Simons, M., Hetland, E.A., Doin, M.P., Lassere, C. (2013). New Radar interferometric time series analysis toolbox released. Eos, Transactions American Geophysical Union, 94(7): 69-70. https://doi.org/10.1002/2013eo070001
[27] Catalán, M., Davila, J.M., ZEE Working Group. (2005). A magnetic anomaly study offshore the Canary Archipelago. Geophysics of the Canary Islands, 129-148. https://doi.org/10.1007/1-4020-4352-X_6
[28] Wang, H., Wright, T.J., Yu, Y., Lin, H., Jiang, L., Li, C., Qiu, G. (2012). InSAR reveals coastal subsidence in the Pearl River Delta, China. Geophysical Journal International, 191: 1119-1128. https://doi.org/10.1111/j.1365-246x.2012.05687.x
[29] Richards, F.J. (1959). A flexible growth model for empirical use. Journal of Experimental Botany, 10(2): 290-301. https://doi.org/10.1093/jxb/10.2.290