Elena Campagnoli* | Alessio Desando
OPEN ACCESS
Labyrinth seals are elements commonly used in turbomachinery to reduce the hot flows leakages through the unavoidable gaps separating the blade tips and the facing stator parts. These leakages, as well known, are responsible, under the same fuel consumption, for a lower turbine and compressor efficiency resulting in a reduced engine performance. For this reason, a lot of researches, available in the literature, are devoted to the study and optimization of these elements, usually performed by means of Computational Fluid Dynamics (CFD) numerical models. To verify and improve the CFD simulations accuracy, experimental results, usually obtained by designing ad hoc tests and focused on the sealing region, are necessary. In the present work the experimental tests are carried out by using a Test Article (TA), representing one entire turbine stage and the next stator. The data, provided by experiments, are used to tune a fluid and thermal model reproducing the phenomena taking place in the TA. In particular, those results which describe the flow splitting in the sealing region can be used to measure the effectiveness of a given labyrinth seal configuration. In this way, it is possible to verify the reliability of a CFD model representing the same labyrinth seal.
turbomachinery, labyrinth seals, leakages, thermal and fluid models, test rig
Due to the relatively simple design and low costs, different kinds of seals [1, 2], both traditional and new generation, are used, in compressors and pumps [3] as well as in steam and gas turbines. In gas turbines seal are used to minimize the leakage flows crossing the clearance, i.e. the unavoidable gap between the rotor and the static components facing the blade tips.
These leakages affect at a large extent, not only the overall efficiency of the engine, but also the turbine thermal behavior. For this reason, the effectiveness of the sealing systems must be evaluated not only referring to their fluid dynamic performances, but also examining carefully the thermal behavior that each kind of sealing exhibits and the related heat transfer to the turbine statics components (shroud, casing, etc.).
In the last decades, many studies have been carried out concerning the fluid dynamic performances of the labyrinth seals, which are usually characterized by smooth or honeycomb stators. Despite this, and the fact that the seals are commonly used in gas turbines, as well as in the steam turbines and rotary compressors, the researches have been mainly devoted to the evaluation of the discharge coefficient while relatively few studies have been carried out about the thermal behavior of the labyrinth seals.
The numerical studies, available in the literature, are mainly performed by using the CFD in order to highlight the details of the flow and to evaluate the amount of leakages.
The need for a tuning of the numerical models is usually satisfied by performing ad hoc experiments or by referring to the experimental and numerical data that are provided by other authors.
CFD tests, on both straight-through and stepped labyrinth seals, were performed by Schramm et al. [4], comparing the numerical values of the discharge coefficient, which they evaluated, with experimental data.
Asok et al. [5] carried out CFD analyses on labyrinth seals, to optimize the geometry of the cavity in the case of straight labyrinth seal.
Denecke et al. [6] numerically tested a stepped labyrinth seal, with honeycomb, to predict windage heating, velocity profiles and exit–swirl, obtaining a very good agreement with the available experimental results.
CFD analyses, concerning labyrinth seals in both smooth and honeycomb configuration, are presented also by Yan et al. [7-11]. The outcomes of their numerical analyses were compared with the experimental data available in the papers by Denecke et al. [6, 12].
Chougule et al. [13] focused their CFD numerical tests on a model with a staggered honeycomb land and straight teeth with an inclined notch. The numerical results showed a very good agreement with the data provided by Stocker [14], allowing the authors to conclude that with the analyzed configuration it was possible to achieve a 17% reduction in leakage flow compared to the conventional base configuration.
The numerical model proposed by Vermes [15] has been analyzed by Micio et al. [16], using experimental data obtained by performing tests at different clearance sizes and pressure ratios. On the basis of these comparisons the authors proposed a more accurate numerical model than the one described in the paper by Vermes.
In the present paper the authors introduce a different procedure to verify the accuracy of their CDF simulations. To perform this verification a honeycomb labyrinth seals was chosen both because it is commonly used in turbomachinery and because it is the one available in the experimental test bench. In particular the CFD analysis, presented here, refers to the evaluation of the discharge coefficient of a stepped labyrinth seal with a honeycomb stator, which is performed at different pressure ratios. The reliability of CFD results is verified comparing them with those obtained by running two other numerical models, which represent the thermal and fluid behavior of one stage of a Low Pressure Turbine (LPT).
These last two models, Thermalcase models, numerically reproduce the fluid-thermal response of a Test Article (TA), designed to work in similitude with an actual turbine.
The procedure used consists first of all in tuning the TA models, on the basis of the available experimental data, and then in using the TA fluid models to evaluate the flow split in the honeycomb labyrinth seal region. This flow split is finally compared with that expected using the CFD model.
Overall the purpose of this analysis is a preliminary evaluation of the method used to allow authors, in the near future, to study alternative geometries for the labyrinth seals. These possible alternative patterns, at least at the beginning, could be obtained by fixing the density of the material that constitutes the seal (i.e. the voids to solid ratio), that is of primary importance when rubbing occurs, and changing the shape of the cells (e.g. number and shape of the sides).
2.1 Thermalcase rig and TA
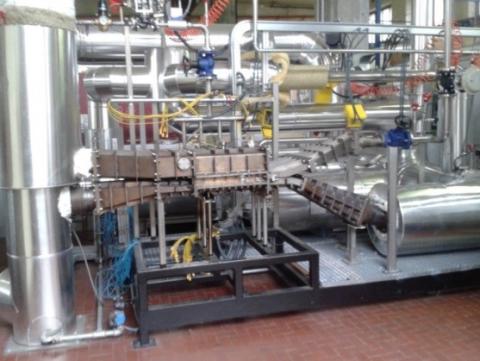
The rig Thermalcase, shown in Figure 1, has been designed and set up at the Energy Department of the Politecnico di Torino [17].
Figure 1. Thermalcase testing facility
The TA, which can work with air at high temperature, represents an angular sector of a modern aeronautical LPT, opportunely scaled to obtain non-dimensional group values (Reynolds, Nusselt, Biot, Fourier and Mach numbers) in the typical ranges of these engine parts [18].
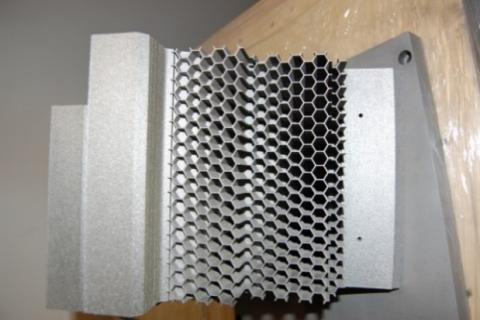
Although the TA is neither axisymmetric nor rotating, its design reproduces the LPT geometry in detail, in particular the region near the tip clearance, i.e. the gap between the fin tip and the honeycomb land stator, shown in Figure 2.
The main purpose of this rig is to perform experimental tests that accurately characterize the heat transfer mechanisms and mass flow leakages that occur among these turbine components.
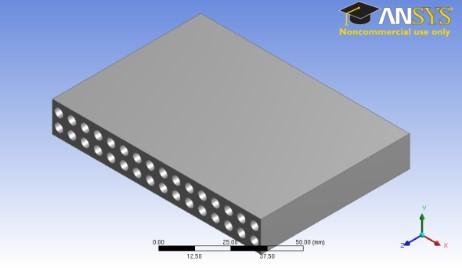
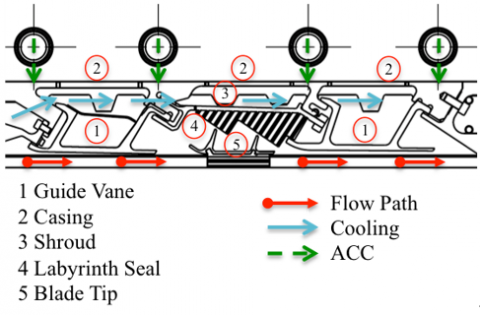
In order to obtain an adequate representation of the pressure drop that occurs when the main hot flow interacts with the turbine blade, a flow restrictor (Figure 3) was placed under the blade tip, as shown in the cross section of the TA (Figure 4). This flow restrictor has been designed to achieve a fixed pressure drop between the inlet and outlet of the restrictor fixed equal to $\beta$=1.1.
Figure 2. TA honeycomb stator land
Figure 3. Flow restrictor: CAD representation
Figure 4 shows the main components and flows of the rig: the main hot flow, called Flow Path (FP), the Cooling (Coo), and the Active Clearance Control (ACC).
Figure 4. TA main mass flow rates and components
The maximum operating conditions for each flow line are reported in Table 1.
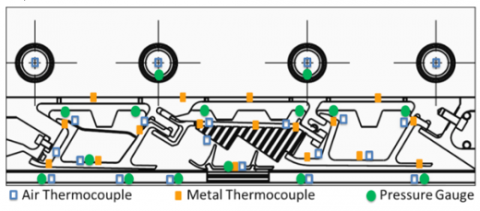
In order to obtain a complete thermal mapping inside the TA, several sensors were installed (Figure 5): air thermocouples (25), metal thermocouples (40) and pressure gauges (17). The number of sensors was chosen with the aim to provide an adequate thermal mapping for the tuning of the numerical model.
Table 1. TA maximum operation conditions
|
Line |
Temperature (K) |
Pressure (bar) |
|
Flow Path |
873 |
2.2 |
|
Cooling |
573 |
2.2 |
|
ACC |
293 |
2 |
Figure 5. TA instrumentation
2.2 Thermalcase numerical model
Two numerical models have been implemented and properly tuned to simulate the fluid-thermal phenomena that take place within the TA. The first, which reproduces the fluid network, is realized with the Flowmaster software, while the second, which performs the thermal analysis, uses the Patran/P-Thermal environment. The two models run in a coupled way with a two-loop iterative structure.
The inner loop couples Flowmaster and Patran/P-Thermal: the first one supplies the mass flow rates and pressures, while the second calculates the temperatures. Once the inner loop has reached the convergence conditions the outer loop is started.
This loop consists of the tuning of the pressures and the temperatures, on the basis of the available experimental data.
2.2.1 Fluid network
The approach used to model the flow field is the 1D fluid network. For the secondary ducts of the turbine this approach is more advantageous than a CFD analysis since it allows to considerably reduce the calculation time, while maintaining a good level of accuracy.
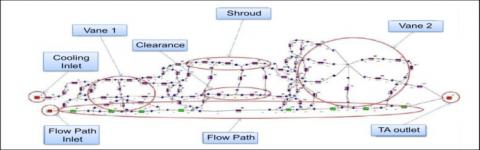
Figure 6. Thermalcase fluid network
In the present work the CFD analysis has been limited to the region of the labyrinth seal with the aim of providing more details about the vortex pattern in this region.
The fluid network, shown in Figure 6, accurately replicates the geometry of the LPT stage and allows estimating all the leakages occurring among the several turbine components.
The model reproduces only the cavities inside the Casing since the ACC flow does not require calculations during this phase and is therefore considered directly in the thermal model.
2.2.2 Thermal model
The model used to simulate the thermal behavior of the TA was realized with the finite element approach. The turbine components have been discretized with a 2D grid, composed of the 4-knots elements QUAD4.
In order to obtain a more realistic model, the properties of the material (density and thermal conductivity) of each component have been properly scaled, considering void-solid ratio of the material in the direction of the depth of the TA.
To integrate the thermal model with the fluid network in the FEM it is necessary to reproduce the latter also. Therefore the fluid network was represented using 1D elements with 2 nodes (advection bars). Each node and bar of the fluid network contains the flow field analysis outputs (pressure, mass flow rate).
These data are used to calculate the heat transport and determine the direction of the air flow. Figure 7 shows the mesh of the 2D model with the fluid network.
The thermal phenomena that take place in the TA involve all the heat transfer mechanisms. As usual, heat transfer by radiation was determined using the view factors of the different surfaces, while convection heat transfer between any fluid node and the solid elements was calculated through the proper convective heat transfer coefficients.
A clarification is instead appropriate for the heat transfer by conduction. While conduction within any solid component has been calculated, as usual, using the thermal conductivity of the material, the heat transfer by conduction between two solid elements that are in contact has not been modeled as pure conduction, but as a mixture of conduction and convection.
In this way, it was also possible to consider the leakages through the gaps between the turbine components.
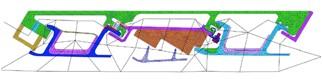
Figure 7. FEM model with fluid network
2.2.3 Model tuning
The tuning of the numerical models, discussed in details in a previous work [19], was carried out by using the data obtained during an experimental campaign. Table 2 shows, for the FP, Cooling and ACC the values of pressure, temperature and flow rate set at the TA inlet.
Table 2. Experimental test matrix
|
Flow |
Flow Path |
Cooling |
ACC |
||||
|
Test # |
TFP [K] |
pFP [bar] |
$\dot{m}_{FP}$ [kg/s] |
TCoo [K] |
pCoo [bar] |
$\dot{m}_{Coo}$ [kg/s] |
TACC [K] |
|
1 |
670 |
1.4 |
0.380 |
463 |
1.55 |
0.038 |
313 |
|
2 |
682 |
1.8 |
0.423 |
463 |
2 |
0.042 |
318 |
|
3 |
796 |
1.8 |
0.438 |
461 |
2 |
0.043 |
329 |
|
4 |
808 |
1.8 |
0.442 |
569 |
2 |
0.044 |
336 |
The procedure used consists of modifying the discharge coefficients (cd) of the fluid network, not to be confused with the CD relative to the labyrinth seal in the CFD simulation, in order to act on the pressure field. This loss coefficient considers the effective area of passage of the flow evaluating the contraction of the fluid stream and the velocity through the passage section. A similar matching procedure is applied to the thermal model, for which the heat transfer coefficients are modified in order to reproduce the thermal field. The iteration is completed by running the inner loop with the coefficients modified until convergence is achieved.
The iterative procedure ends when in each node the discrepancies between the numerical and experimental values of both pressures and temperatures result in the tolerance ranges.
The range of tolerance $\Delta p$ (experimental-numerical) for the pressures is shown in Eq. (1).
$Tol_{\Delta p}=\max \left[0.05 *\left(p_{i n}-p_{\text {out}}\right) ; \text {Inst}_{\text {acc}}\right]$ (1)
where, the accuracy of the pressure sensor is Instacc =0.09 bar-
The tolerance $\Delta T$ (experimental-numerical) for the temperatures is shown in Eq. (2).
$T o l_{\Delta T}=0.05 *\left(T_{i n}-T_{o u t}\right)=\pm 26 K$ (2)
After the tuning, performed using the experimental data reported in Table 2, a good agreement between the numerical and experimental values was obtained. The relative percentage error, calculated using Eq. (3), indicates that the number of pressure sensors outside the tolerance is reduced from 62% to 15%, with a maximum error of less than 1%. On the contrary, all the thermocouples are within the tolerance range, with a maximum error less than 4.5%, recorded in the Casing region.
$e=\frac{x_{n u m}-x_{e x p}}{x_{e x p}} * 100$ (3)
In addition to the previous procedure, a CFD approach was also followed. This method was applied only to the region of the TA labyrinth seal in order to investigate the leakage behavior in this area in more detail. In particular, the split of the mass flow rate between the restrictor and the fin tip region was evaluated, neglecting other minor leakages occurring in the surrounding zones. The software used is Ansys CFX 14.5, a code that improves convergence through a coupled solver with an algebraic multi-grid approach and a combined algorithm of finite volume and element.
Table 3. Setup settings
|
Outlet static pressure |
1.01325 bar |
|
Total inlet temperature |
873 K (Isothermal) |
|
Solution scheme |
Upwind – First Order |
|
Turbulence model |
k – ω |
|
y+ |
Automatic Wall Treatment |
|
Analysis |
Steady-state |
|
Fluid |
Air Ideal Gas (Sutherland) |
|
Turbulence intensity |
5% |
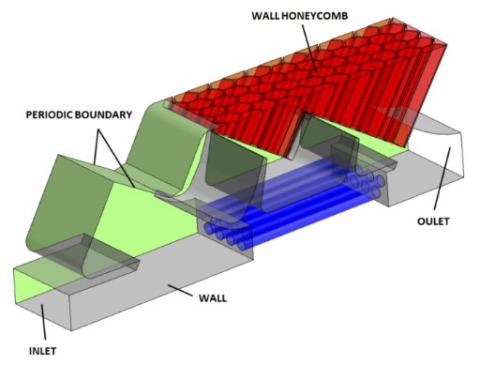
Figure 8. Boundary conditions
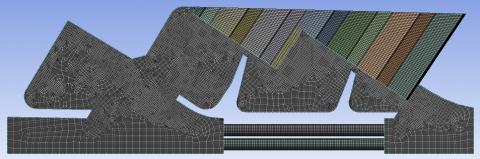
The meshing grid (Figure 9) is a 3D composed by 2D extruded bodies. The elements chosen for the discretization are hexahedrons. Those regions, where high velocity gradients occur (such as clearances), are provided with a thickened grid, in order to improve the obtained solution.
Figure 9. TA numerical model meshing
Note that the honeycomb cells were discretized by using the Ansys CFX mesh feature Mapped Face Sizing, to obtain a more regular grid, as shown in Figure 10. The mesh contains about 6250000 nodes, with an average skewness of 0.06.
Figure 10. TA numerical model meshing: honeycomb detail
A typical parameter that is utilized to evaluate the efficiency of the labyrinth seal in reducing tip leakages is the discharge coefficient, defined as:
$C_{D}=\frac{\dot{m}_{C F D}}{\dot{m}_{i d e a l}}$ (4)
In Eq. (4), the numerical simulations provide the estimated mass flow rate, while the ideal one is calculated using the formula reported in Eq. (5) proposed by Martin [22].
$\dot{m}_{\text {ideal}}=\frac{p_{0} \cdot A}{\sqrt{T_{0}}} \cdot \sqrt{\frac{2 \gamma}{R(\gamma-1)} \cdot\left[\left(\frac{1}{\beta}\right)^{2 / \gamma}-\left(\frac{1}{\beta}\right)^{(\gamma+1) / \gamma}\right]}$ (5)
where, $\beta$ is the ratio between the total inlet pressure, p0, and the static outlet pressure for the seal and T0 the total inlet temperature (see Table 3).
Since the purpose of this work, as previously stated, is to set up a CFD model capable of numerically investigating the leakages in the labyrinth seal region, in what follows only the results obtained for this area will be discussed.
The temperature sensors in this zone are the three metal (M#) thermocouples and the air (T#) thermocouple shown in Figure 11.
Figure 11. Thermocouples in the labyrinth seal
The Thermalcase models have been tuned by applying the procedure, previously described, to the experimental test #3, shown in Table 2.
The numerical and experimental values, after the thermal match, showed a good agreement, since all the temperature values were within the tolerance range (±26 K) even if we consider the accuracy (±0.1 K) of the K-type thermocouples used for the experimental measurements. Table 4 shows the numerical and experimental results for the selected temperature sensors together with the relative error, calculated with Eq. (3).
Table 4. Test 3: Numerical vs experimental temperatures
|
|
Thermocouples (Honeycomb) |
Thermocouples (Fin Tip) |
||
|
|
M9 |
M11 |
M8 |
T10 |
|
$T_{n u m}[K]$ |
702.8 |
674.4 |
772.7 |
758.5 |
|
$T_{e x p}[\mathrm{K}]$ |
728.5 |
693.9 |
782.7 |
751.0 |
|
$e[\%]$ |
-3.5 |
-2.8 |
-1.3 |
+1.0 |
The thermal match performed on test #3 was verified on the other 3 tests reported in Table 2. Table 5 shows the results obtained.
Table 5. Test 1, 2 and 4: numerical vs experimental temperatures
|
|
|
Thermocouples (Honeycomb) |
Thermocouples (Fin Tip) |
||
|
Test 1 |
|
M9 |
M11 |
M8 |
T10 |
|
$T_{n u m}[K]$ |
603.8 |
583.5 |
650.8 |
639.3 |
|
|
$T_{e x p}[\mathrm{K}]$ |
620.8 |
593.6 |
658.6 |
638.0 |
|
|
$e[\%]$ |
-2.7 |
-1.7 |
-1.2 |
+0.2 |
|
|
Test 2 |
|
M9 |
M11 |
M8 |
T10 |
|
$T_{n u m}[K]$ |
615.4 |
594.7 |
664.0 |
652.3 |
|
|
$T_{e x p}[\mathrm{K}]$ |
633.2 |
607.5 |
672.1 |
651.8 |
|
|
$e[\%]$ |
-2.8 |
-2.1 |
-1.2 |
+0.1 |
|
|
Test 4 |
|
M9 |
M11 |
M8 |
T10 |
|
$T_{n u m}[K]$ |
729.0 |
705.2 |
786.2 |
772.8 |
|
|
$T_{e x p}[\mathrm{K}]$ |
751.7 |
725.6 |
797.3 |
774.5 |
|
|
$e[\%]$ |
-3.0 |
-2.8 |
-1.4 |
-0.2 |
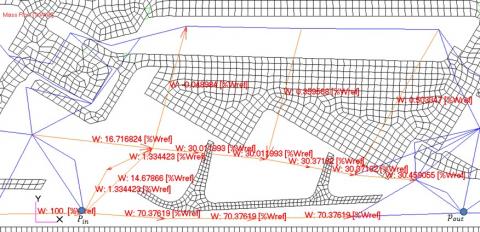
|
Figure 12 shows for test #3 the mass flow split that occurs in the fin tip region, which was used to validate the CFD model, and the two nodes used to calculate the pressure ratio across this region ($\beta=1.1$). The mass flow split is: 70.4% in the restrictor and 30% through the fin tip clearance. The sum of the two contributions is slightly higher than 100% because a very small amount of air, coming from the upper cooled cavity, is added to the portion of FP air that bypasses the fin tip.
The boundary conditions used to run the CFD model are listed in Table 3. The pressure ratio used, $\beta=1.1$, is the one dictated by the design of the restrictor.
Note that the inlet temperature of the FP represents the maximum operating value, slightly higher than the value recorded in Table 2 for the test#3. This difference is not relevant with respect to the split of the flow between the two configurations.
The boundary conditions used to run the CFD model are listed in Table 3 while the inlet temperature for the FP and the pressure ratio are the same as in test #3.
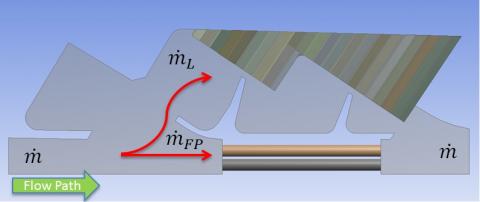
Figure 13. Mass flow split for the CFD model
Figure 13 shows the mass flow split in the CFD model. The values $\dot{m}$ (calculated at the inlet of the CFD domain) and $\dot{m}_{FP}$ (recorded at the inlet of the flow restrictor holes) are respectively the total FP mass flow rate and the FP portion passing through the flow restrictor. The leakage flow rate $\dot{m}_{L}$ is calculated by subtraction when the two other values are known.
The results obtained by running the CFD model with $\beta=1.1$ are in a very good agreement with those provided by the Thermalcase model with 70.6% of the flow passing through the restrictor and 29.4% which bypasses the fin tip.
The flow field in the cross section of the CFD model is shown in Figure 14. The model adequately reproduces all the phenomena typically recorded inside a labyrinth seals, as the carry over in the two fin tip regions and the flow expansion in the seal cavities.
Figure 14. Flow field in the labyrinth seal region, $\beta=1.1$
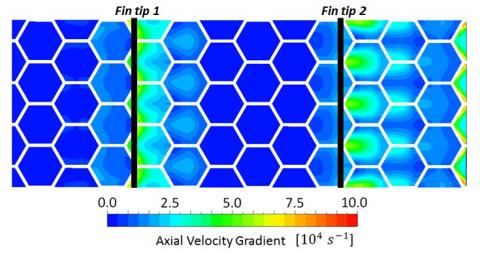
The axial velocity gradient, located at the honeycomb interface, is plotted in Figure 15. This contour shows the acceleration of the air flow in the clearance regions and, thus the dissipative contribution related to the honeycomb cells near the fin tip. As already stated in previous works [4, 21], this contribution plays a key role in the carry over deflection, influencing the vortex pattern inside the seal cavity and the consequent energy dissipation.
Figure 15. Axial velocity gradient, cells interface, $\beta=1.1$
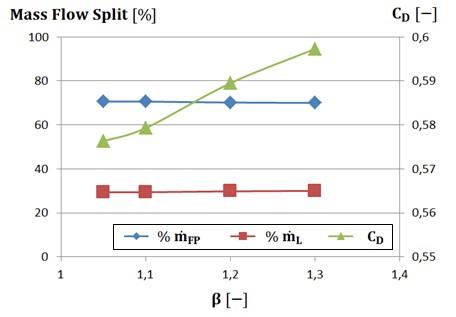
The CFD analysis has been extended to other values of $\beta$, to highlight the effect of this parameter on the mass flow split and on the discharge coefficient. The results obtained are shown in Figure 16.
Figure 16. Mass flow split and discharge coefficient vs pressure ratio, CFD results
In Figure 16 it can be seen how the pressure ratio $\beta$ has a negligible effect on the mass flow split. In fact, the leakage mass flow rate increases slightly from 29.4% when $\beta$=1.05, to 30% with $\beta$=1.3. This variation is in agreement with the fact that the discharge coefficient shows a small increase with β, which means that the labyrinth seal is less dissipative at higher pressure ratios. This trend is also in agreement with other literature studies.
The present work illustrates the procedure used to verify the accuracy of a CFD model to be used in the near future to evaluate alternative labyrinth seals geometries to the honeycomb pattern. This procedure uses the experimental data obtained with the Thermalcase testing facility. This rig, designed at the Politecnico di Torino, is adequately scaled to reproduce an LPT stage. It is equipped with both air and metal thermocouples and pressure gauges, which allow for accurate fluid and thermal mapping.
The first part of the procedure refers to a 1D fluid network and a 2D thermal model, respectively developed with the Flowmaster and Patran/ P-Thermal software. These two integrated models have been implemented in order to represent the Test Article and show an iterative loop structure. The models were tuned using experimental measurements provided by the thermocouples and pressure gauges installed inside the TA.
After the tuning procedure, the models have exhibited a good agreement with the experimental data, satisfying the tolerance criteria set for the pressure and temperature values.
Following this analysis, which provided a complete overview of the phenomena occurring within the TA, more detailed investigations were focused on the leakage flow in the labyrinth seal region, since, in recent years, this aspect has become significant in optimizing turbine efficiency.
The tool used to perform this study is a CFD numerical model, developed with Ansys CFX. Initially it was necessary to validate this model by referring to the experimental data. The validation was accomplished by comparing the mass flow splits (FP and leakage flows) evaluated using the CFD model with the same values provided by the tuned fluid network. The two models were in a very good agreement.
Subsequently, the CFD model was used to analyze the flow field within the labyrinth seal and to evaluate the discharge coefficient at different pressure ratios. The results obtained have shown that this numerical model is able to accurately reproduce both the carry over, through the labyrinth seal fin tips, and the dissipative phenomena occurring inside the seal cavities.
On the basis of the obtained results, it is possible to state that the proposed procedure allows the experimental data, recorded with the Thermalcase rig, to be modeled with a good accuracy level.
In a future perspective, this CFD model could be used to investigate new turbine configurations or to apply the CFD modeling to other turbine components, for which a more detailed analysis could improve the design.
An immediate application of this study is the analysis of labyrinth seal patterns alternative to the honeycomb cells.
|
A ACC |
Clearance area, m2 Active Clearance Control |
|
|
CD cd |
Sealing discharge coefficient 1D fluid network discharge coefficient |
|
|
CFD |
Computational Fluid Dynamics |
|
|
Coo |
Cooling |
|
|
e |
Relative percentage error, % |
|
|
FEM |
Finite Element Method |
|
|
FP |
Flow path |
|
|
Instacc |
Instrument accuracy |
|
|
LPT |
Low Pressure Turbine |
|
|
M# |
Metal thermocouple |
|
|
$\dot{m}$ |
Mass flow rate, kg.s-1 |
|
|
max |
Maximum |
|
|
p p0 |
Pressure, bar Sealing total inlet pressure, Pa |
|
|
pin |
Test article inlet pressure, bar |
|
|
pout |
Test article outlet pressure, bar |
|
|
R T# TA |
Ideal gas constant, J/kgK Temperature, K Test Article |
|
|
Tol T0 Tin Tout x |
Tolerance Total inlet temperature, K Turbine inlet temperature, K Turbine outlet temperature, K Generic variable |
|
|
Greek symbols |
||
|
$\beta$ $\gamma$ |
Sealing pressure ratio Ideal gas specific heats ratio |
|
|
$\Delta p$ |
Pressure difference, bar |
|
|
$\Delta T$ |
Temperature difference, K |
|
|
Subscripts |
||
|
ACC acc |
Active Clearance Control Accuracy |
|
|
coo |
Cooling |
|
|
exp FP L num |
Experimental Flow Path Leakage Numerical |
|
[1] Chupp, R.E., Hendricks, R.C., Lattime, S.B., Steinetz, B.M. (2006). Sealing in turbomachinery. J. Propul. Power, 22(2): 313-349. http://dx.doi.org/10.2514/1.17778
[2] Flitney, R.K. (2007). Seals and Sealing Handbook. Elsevier Science.
[3] Gao, L. (2019). Steady simulation of T-groove and spiral groove dry gas seals. International Journal of Heat and Technology, 37(3): 839-845. http://dx.doi.org/10.18280/ijht.370321
[4] Schramm, V., Willenborg, K., Kim, S., Wittig, S. (2002). Influence of a honeycomb facing on the flow through a stepped labyrinth seal. ASME J. Eng. for Gas Turbines Power, 124(1): 140-146. http://dx.doi.org/10.1115/1.1403460
[5] Asok, S.P., Sankaranarayanasamy, K., Sundararajan, T., Rajesh, K., Ganeshan, G.S. (2007). Neural network and CFD-based optimization of square cavity and curved cavity static labyrinth seals. Tribology International 40(7): 1204-216. http://dx.doi.org/10.1016/j.triboint.2007.01.003
[6] Denecke, J., Dullenkopf, K., Wittig, S. (2004). Influence of preswirl and rotation on labyrinth seal leakage. ISROMAC, International Symposium on Transport Phenomena and Dynamics of Rotating Machinery, 10: 1-11.
[7] Yan, X., Li, J., Song, L., Feng, Z. (2009). Investigations on the discharge and total temperature increase characteristics of the labyrinth seals with honeycomb and smooth lands. Journal of Turbomachinery, 131(4): 041009. http://dx.doi.org/10.1115/1.3068320
[8] Li, J., Kong, S., Yan, X., Obi, S., Feng, Z. (2010). Numerical investigations on leakage performance of the rotating labyrinth honeycomb seal. J. of Engineering for Gas Turbines and Power, 132(6): 062501. http://dx.doi.org/10.1115/1.4000091
[9] Yan, X., Li, J., Feng, Z. (2010). Effects of inlet preswirl and cell diameter and depth on honeycomb seal characteristics. ASME J. Eng. for Gas Turbines Power, 132(12): 122506. http://dx.doi.org/10.1115/1.4001296
[10] Yan, X., Li, J., Feng, Z. (2011). Effects of sealing clearance and stepped geometries on discharge and heat transfer characteristics of stepped labyrinths seals. Proc. IMechE Part A: J. Power and Energy, 225(4): 521-538. http://dx.doi.org/10.1177/0957650911399329
[11] He, K., Li, J., Yan, X., Feng, Z. (2012). Investigations of the conjugate heat transfer and windage effect in stepped labyrinth seals. J. of Heat and Mass Transfer, 55: 4536-4547. http://dx.doi.org/10.1016/j.ijheatmasstransfer.2012.03.045
[12] Denecke, J., Dullenkopf, K., Wittig, S., Bauer, H.J. (2005). Experimental investigations of the total temperature increase and swirl development in rotating labyrinth seals. Turbo Expo: Power for Land, Sea, and Air, 3: 1161-1171. http://dx.doi.org/10.1115/GT2005-68677
[13] Chougule, H.H., Ramerth, D., Ramachandran, D. (2008). Low leakage designs for rotor teeth and honeycomb lands in labyrinth seals. Turbo Expo: Power for Land, Sea, and Air, 4: 1613-1620. http://dx.doi.org/10.1115/GT2008-51024
[14] Stocker, H.L., Cox, M., Holle, G.F. (1977). Aerodynamic performance of conventional and advanced design labyrinth seals with solid-smooth, abradables, and honeycomb lands. NASA/CR135307, 1-146.
[15] Vermes, G. (1961). A fluid mechanics approach to the labyrinth seal leakage problem. J. Eng. for Power, 83(2): 161-169. http://dx. doi.org/10.1115/1.3673158
[16] Micio, M., Facchini, B., Innocenti, L., Simonetti, F. (2011). Experimental investigation on leakage loss and heat transfer in a straight through labyrinth seal. Proc. ASME Turbo Expo, 5: 967-980. http://dx.doi.org/10.1115/GT2011-46402
[17] Campagnoli, E., Monterossi, M.P. (2018). Design of a new test rig facility to study the turbine thermal behaviour. Int. J. of Mechanics and Control, 19(1): 143-151.
[18] Barbera, A.M.A. (2011). Thermal control and optimization of the turbine clearance. PhD Thesis, Energy Dept., Politecnico di Torino.
[19] Fasanella, S.A. (2013). Analisi e taratura di un modello numerici per la simulazione di componenti aeronautici raffreddati. Master Degree Thesis, Politecnico di Torino.
[20] Andersson, B., Andersson, R., Hankansson, L., Mortensen, M., Sudiyo, R., van Wachem, B. (2012). Computational Fluid Dynamics for Engineers. Cambridge University Press, Cambridge, UK, Chap. 4.
[21] Desando, A., Rapisarda, A., Campagnoli, E., Taurino, R. (2015). Numerical analysis of honeycomb labyrinth seals: Cell geometry and fin tip thickness impact on the discharge coefficient. Proc. ASME Turbo Expo, 5C. http://dx. doi.org/10.1115/GT2015-42106
[22] Martin, H.M. (1908). Labyrinth packings. Engineering, 85: 35-38.