Md. Abdullah Salman* | Faisal Ahmed![]() | Mst Laboni
| Mst Laboni![]() | Mahmudul Hasan Rakib
| Mahmudul Hasan Rakib![]() | Md. Emdadul Haque
| Md. Emdadul Haque
© 2023 IIETA. This article is published by IIETA and is licensed under the CC BY 4.0 license (http://creativecommons.org/licenses/by/4.0/).
OPEN ACCESS
This study signifies to evaluate the vulnerability and capability of the Char Hizla upazila, under Barishal district, which belongs to the most underrated disastrous region in Bangladesh. Five major factors depending questionnaire survey was established to gather information over literature review and minor changes depended on nearby settings. A sum of twenty-five vulnerability and capability markers were used to decide their indexes. The outcomes show that the total vulnerability overweighs the total capacity in the studied region to disaster and these indexes (p<0.05) vary significantly. Undeniably, the region was more helpless reliant on health issues (IV=1) followed by effect on ecosystem (IV=0.81); shelter & settlement (IV=0.69); and socioeconomic (IV=0.67) respectively, while more capable for WASH (IC=0.6) related indicators. Moreover, some positive mitigation actions like sanitation facilities; knowledge about water purification & safety washing materials; irrigation systems; knowledge about climate change & disaster management; and average annual income & secondary occupation, etc. were observed. This study denotes the crucial facts on sector-wise disaster vulnerability & capability and their related effects and existing scenarios of adaptation resilience conditions towards these calamities. Policy makers from Government & NGOs can acquire valuable evidence for developing more disasters adaptation and mitigation measures. Depth investigation bearing in mind more markers and altruistic sectors may be helpful to imitate the information gaps.
assessment, capability, Char Hizla, geohazards, vulnerability
1.1 Climate issues of Bangladesh
Human-influenced change of climate is currently unquestionable. An increasing number of climatological research works from around the world have verified indicators and effects on environmental changes [1]. Environmental changes and its related effects are experienced through changes in precipitation, temperature, air pressure, humidity, wind speeds and sea-levels; and changes in the brutality and the rate of recurrence of environmental extremes [2-6]. Developing countries are greatly vulnerable to environmental change due to their sensitivity and exposure to environmental extremes coupled with their inadequate capability to deal with the significances of environmental changes [7].
Due to its geographical position, socioeconomic status and livelihood situation, developing country like Bangladesh has considered as the top most natural calamity faced countries in the earth [8-9]. Bangladesh is positioned at a South Asia bounded by India, Myanmar and the Bay of Bengal. It has recognized as one of the largest delta in the world, experienced by the densely network river systems like Ganges-Brahmaputra-Meghna catchment area, which is around 1.6 million km2. The country has already been faced with several natural disastrous events like storm surge, sea-level rise, floods, river erosion, salinity, extreme rainfall and so on. Moreover, several researches evidenced a rising rate of the frequency of these calamities in coastal-estuary Bangladesh. Rawlani and Sovacool [10] was also observed that the coastal and estuary parts are higher susceptible to these calamities than any other areas of the country. As a developing country, Bangladesh relies mostly on farming and fishing but this financial part is harmful to environmental changes and erraticism. The capability of families to adjust to the unfair of environmental changes, which can distress families’ assets and flexibility, is unreliable because of unfortunate socioeconomic situations [8]. For example, Super cyclone Bhola experienced in 1970 which damaged more than 86 million USD of economic loss [10], 0.3 million people death [8]. Similarly, another super cyclone caused 0.138 million death toll in 1991. In addition, recent cyclone like Sidr damaged around 1.7 billion USD and more than 2.3 million households were severely affected in 2007 [11]. At the same time, monsoon flood had earlier damaged huge agricultural losses and demolition of physical resources, estimating around 1.1 billion USD [11]. The aftershock of these extreme disastrous events, hence, the assessment of vulnerability, capability and adaptation policies are made key to aid the indigenous peoples to survive with the risky climatic situations and related environmental issues [12-16]. Besides, structural approaches like establishment of flood and cyclone shelters, embankments, so on and non-structural such as various training & awareness program for hazard controlling, improvement of forecasting technologies, construction of management acts & plans etc. have already been executed by both government and nongovernmental organizations [17-19]. As, Bangladesh has presently been recognized by the international institutions like United Nation for hazards risk assessment and supervision, UNICEF for water & health related strategies as well IPCC for climate change and sustainable development issues, it is worthy of evaluating the current situation of the vulnerability and capability methodologies of disaster in the coastal regions of Bangladesh.
1.2 Aspects of vulnerability and capability
Assessment of vulnerability & capability is not a recent conception in the science of disaster risk reduction and management; Salman [15], Burton et al. [20-22], Bohle et al. [23], Sorensen and White [24] had worked on these issues; this conception has also newly concentrated on by Warrick and Ahmad [25]; Nicholls et al. [26]; IPCC [3]; Carter et al. [27]; Younus and Kabir [28]; Harvey et al. [29]. Vulnerability is a multidimensional idea connected with various conceptualizations [30]. This conception has been uninterruptedly spreading containing exposure, coping capability, susceptibility and adaptation into its characterization [31]. A definition was formulated by the International Strategy for Disaster Reduction [32], which states Vulnerability as ‘the status defined by social, physical (shelter, WASH related), financial and environmental (health & ecosystem) indicators manners which upsurge the weakness of people to the effects of disasters’. Identifying the role of capability in risk reducing also specifies a greeting that families are not helpless sufferers [33-34]. Vulnerability is the strongest speech of the community structure of risk indicators in term of disaster management and risk reduction [35]. The social interactions with changing-physical earth form risk of disaster by altering physical measures into threats over community practices that upsurge the vulnerability and exposure of communities, their livings, infrastructures, production, services and supports [36-38]. Refining capability is often recognized as the aim of project plans and policies, based on concept that solidification capability will ultimately lead to lessen risk and to lessen the impact of environmental change [39]. Capability is usually used in humanitarian discourse to specify the degree to which a scheme can endure the impact of a life-threatening event. It suggests that communities can deal with some level of weakening, and recognizes that at a definite point the capability may be surpassed. Several researches have assessed the vulnerability, capability and adaptation strategies of the coastal areas of Bangladesh [10, 15, 24, 40-42]. These analyses and ranking of the numerous coastal regions in Bangladesh mostly vulnerable to river erosion, cyclone, floods, salinity and sea-level rise have been undertaken by making the vulnerability and capability indexes [10, 15, 24, 40-42]. These assessments of vulnerability and capability over various time frames and the changes in vulnerability of communities have been done for the coastal areas of Bangladesh by concentrating on factors of demography, infrastructure, occupational, agricultural growth, industrial production, geographical, extreme events and climate variability related factors.
1.3 Objectives
The literatures recommend that Bangladesh experiences worse vulnerability and poor capability due to climate change and its related variability [15, 22-21, 43-49]. The rolling point of this vulnerability and poor capabilities can turn disastrous, as already the country experiences several events and frequent natural hazards like various type of floods, river bank erosion, cyclones and storm surges, droughts due to withdrawing water from up streams, landslides, rising water on the edge of coastal land due to sea-level rise, salinity intrusion into agricultural lands and so on. The coastal communities of Bangladesh are highly vulnerable due to environmental changes; henceforth, the wide-ranging renovated building capacity steps such as creating community based adaptation groups need to be employed instantly in order to develop people’s adaptive flexibility to climate change through making productive policies and strategies at the ground level by the Government as well NGOs. Recently, IPCC [50] reported that the warning of global warming of a possible rise 1.5℃. To sum up for Policy makers [49] concentrated on the renovated adaptation along with the probable mood of vulnerabilities to climate change, mainly at the range of 1.5℃ from pre-industrial level viewpoint, which the World would face in upcoming periods. Hence, regionally, a vulnerability and capability evaluation of Bangladesh is an important issue of recent improvement of contemporary scientific understanding [46-48].
The study mainly emphases on the assessment of vulnerability and capability along with socioeconomic status, shelter and settlement, water, sanitation & hygienic related indicators, food security & livelihood, health and eco-system related indicators through multiple regression analysis. These correlations and with the level of significance would specify the vulnerable & risky regions and some solutions in order to improve capability & adaptation resilience at the ground levels in Bangladesh. The significance of this study is that the identified vulnerability & capability indicators would obviously aid to reduce risk and to produce effective and community resource based plans & policies.
2.1 Study area
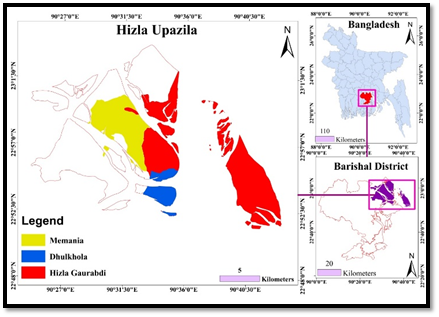
The whole southern part of Bangladesh has been victimized by a different natural disaster from decades. Being lower position and crisscrossed by river Hizla Upazila of Barishal district is in a real vulnerable situation. The area is located 22.91448⁰N to 90.50976⁰E with a population of 146077 having an area of 515.36 sq. km (Figure 1 and Table 1). The Upazila contains 7 unions such as; Guabaria, Kuchaipotty, Dhulkhola, Bara Jalia, Memania, Harinathpur, and Hizla Gaurabdi (Figure 1 and Table 1). Among them, Memania, Dhulkhola and Hizla Gaurabdi being surrounded by the mighty Meghna and being segregated from modern lifestyle have made themselves more vulnerable to disasters like cyclones, floods and river erosion (Figure 1). For research purpose, these 3 unions were selected because of their higher dependency on vulnerable occupation like fishing and farming. They are still struggling to have a basic requirement like smooth electricity supply, reliable health assistance, and sustainable educational environment and are living with a worse communication system. For all these sufferings not only, the local authority is responsible but the disasters visits every year here, again and again, are the real culprits to the inhabitants of the area.
Figure 1. The study region Hizla upazila is situated at north-eastern part of Barishal district. The study region associates with three unions such as Memania, Dhulkhola & Hizla Gaurabdi. Semi-structure questionnaire survey responses were collected from household to household
Table 1. A summary of Hizla upazila of Barishal
|
Class |
Sub-Class |
Features |
|
Area |
- |
516.36km2 |
|
Populace |
Overall population |
1,87,329 |
|
|
Literacy rate |
64% (male-36% and female-28%) |
|
|
Males |
93,041 |
|
|
Females |
94,288 |
|
|
Family |
22973 |
|
Administrative Unit |
Pouroshova Union |
- 7 |
|
Physical |
Roads |
Total length is 327Km (Soil 256 Km & tangible 71Km) |
|
|
Sluice Gates |
- |
|
|
Culvers |
110 |
|
Assets |
Farming Land |
27,700 |
|
|
Main Crops |
Paddy, Potato, Soybean, Vegetables & Pulse |
|
|
Main Fruits |
Coconut, Guava, Papaya, Nut & Watermelon |
|
|
Forest area |
- |
|
|
River |
4 |
|
|
Shallow tubewell |
1874 |
|
|
Deep tubewell |
980 |
|
|
Pond |
1560 |
|
Revenue sources |
|
Agriculture-73% Non-agricultural laborer-2.5%, Industry-0.45%, Commerce-15%, Service-5.12% and Others-5.65%. |
2.2 Sampling
The stratified sampling procedure was conducted during the sampling as full cross-section of the population can be obtained by the stratified sampling [51]. Following equations were used to find out the sample size.
Overall selected populace, N=12525; Level of confidence=95%; Error margin, e=10%; Chi square level of significance 95%, Z=1.96; Deviation of Standard, p=0.5 (male & female base); and assessed failures proportion, q=(1-p)=(1-0.5)=0.5.
The overall sum of the household was 12525 in the targeted 3 unions. The Eq. (1) and Eq. (2) estimate the necessary Size of Sample is 95. To conclude, the study measured 200 families from the selected three unions as a sample size.
$n_o=\frac{Z^2 \times p \times q}{e^2}$ (1)
$n=\frac{n_{\circ}}{1+\left(\frac{n_{\circ}-1}{N}\right)}$ (2)
2.3 Survey design
The purpose of the research was to track the aggression of disaster on the socioeconomic, physical and institutional life of the inhabitants. Finding the self-protecting capability was also a major objective of the research. Openness supports the likelihood of a risk, the general public’s weakness to a shocking result is free of exposure and starts with political, financial & social-design and philosophies that shape the dispersion of political, human, physical and social wealth in a general public [52]. This concept was highly influencing while questionnaire was formed. The questionnaire was focused on some indicators like socioeconomic status, food security & livelihood conditions, water sanitation perception, health assistance, shelter management disaster resiliency etc. As the ecosystem is a major indicator of disaster aggression, the questionnaire was kept a special provision for wildlife status. The indicators were chosen in such a way where they have potential to provide data regarding the vulnerability, surviving, adaptive capacity and pliability of a structure to an effect of a yet poorly characterized occasion connected with a disaster. The questions were placed in a manner so that they can estimate the probable losses and mitigation approaches by analyzing the affected elements. Local representatives, NGO (ASHA), Faculty of Geology and Mining department (University of Barishal) contributed to form the baseline of the questionnaire. Farmers and fishermen were consulted to set those questions which are treated as the indicators of their appearance during disasters. Geographic and demographic information were remarkably obtained from the statistical bureau of Bangladesh.
Most significantly, the questionnaire was made in artless and explicit way so that the participants and volunteers could easily understand (see Tables 2 and 3). The survey was designed in a manner so that the participation of the most affected can be reasonably assured. For this purpose, volunteers segregated themselves between groups. Local transports like easy bikes, bikes, auto-rickshaws were used to reach the respondent's households. In some areas which are devoid of paved road, volunteers collected data moving from house to house on foot. The survey required data only that is practical to collect in the field with the questionnaire. So, the questions were designed with respective weights. Environmental prominences are not assessed widely as the research focuses on the vulnerability of people and the capability of them to defend the disasters. Before stating the survey, the feedback form was previously tested with 10-20 families each union and then required changes were done earlier to collect responses. Responses were gathered in the time of June 2019 to April 2020. Samples were collected randomly aiming so that outcomes become more vigorous. A brief summary of the participants is displayed in Tables 4 and 5. About 68% of participants’ were lacked of any formal schooling and only 2% were found having a higher schooling. Farmer and Fisherman are the dominant occupation of the study area, whereas service holder and businessman are found in a minor scale. Sum up, the sample displays a demonstrative and sundry population.
Table 2. Vulnerability marker, classes, associated weights, explanation, and references used in this study
|
Socioeconomic Status of the Respondents |
|||
|
Marker |
Classes |
Weights |
Comments |
|
Cultivable land grabbed by river erosion |
Yes No |
1.00 0.00 |
Cultivable land grabbled by river erosion indicate higher vulnerability. |
|
Loan taking frequency |
Regularly Often Occasionally Not at all |
1.00 0.67 0.33 0.00 |
More frequently taking loan increases vulnerability. |
|
Effect of disasters to the education system |
Strongly Moderately Low |
1.00 0.67 0.33 |
Hamper in education system increases vulnerability |
|
Water, Sanitation, & Hygiene Related Indicators |
|||
|
Marker |
Classes |
Weights |
Comments |
|
Source of Drinking Water |
Pond Canal River Shallow tube-well Deep tube-well |
1.00 0.80 0.60 0.40 0.20 |
Families taking contact to safe water signify l lesser weakness. |
|
Source of drinking water distance from home |
>700m 501-700m 301-500m 101-300m <100m |
1.00 0.80 0.60 0.40 0.20 |
Smaller distance has minor weakness to collect water |
|
Platform height of tubewell |
1 to 2 ft 2 to 3 ft >4 ft |
1.00 0.67 0.33 |
Lower the platform height, higher the vulnerability risk. |
|
Types of sanitation facilities |
No toilet Hanging/open Offset/Ring slab (Not water sealed)
Well toilet (Not sealed) Septic/Ring/Pit/Well toilet |
1.00 0.80 0.60
0.40 0.20 |
Poor sanitary system yields higher vulnerability. |
|
Type of cleansing material used to wash hand |
Others Ash Soda Soap |
1.00 0.75 0.50 0.25 |
Practicing proper cleaning materials indicate lower vulnerability. |
|
Food Security and Livelihood Indicators |
|||
|
Marker |
Classes |
Weights |
Comments |
|
Fetching food scarcity during disaster period |
High (>2 weeks) Moderate (1-2 weeks) Low (<1 week) No food Scarcity |
1.00 0.67 0.33 0.00 |
Scarcity of food in the time of disaster signifies higher risk. |
|
Extents of crop damage due to past disaster |
Fully damage Almost damage Partially damage Not significantly damage No Damage/No land |
1.00 0.75 0.50 0.25 0.00 |
Greater destroys of the crops because of the previous disasters indicate greater vulnerability. |
|
Extents of crop seed damage due to past disaster |
High Moderate Low No damage/No land |
1.00 0.67 0.33 0.00 |
Greater destroys of the crop seed because of the previous disasters indicate greater susceptibility. |
|
Dependency of family income on domestic animal |
Strongly Moderately Low No dependency |
1.00 0.67 0.33 0.00 |
Strong dependency during disaster indicate higher vulnerability. |
|
Distance of cash cropland from river |
<100m 100-500m 501-1000m >1km No land |
1.00 0.75 0.50 0.25 0.00 |
Cropland which are vicinity to the river indicates higher vulnerability. |
|
Dilation in food supply due to disaster |
Yes No |
1.00 0.00 |
Dilation increases vulnerability. |
|
Cropland remain water-logged during rainy season |
Most of the land Half of it A little of it None of it/No land |
1.00 0.67 0.33 0.00 |
Crops which are not water friendly could be damaged due to water logging which indicates vulnerability |
|
Shelter and Settlement Related Indicators |
|||
|
Marker |
Classes |
Weights |
Comments |
|
Height of homestead plinth |
<1 ft 1 to 2 ft 3 to 4 ft 5 ft >5 ft |
1.00 0.80 0.60 0.40 0.20 |
Greater the height of homestead plinth, lesser the risk. |
|
Large trees near house |
Yes No |
1.00 0.00 |
Effect of fall of large trees on jhupri and katcha house can be lethal. |
|
Shelter distance from home |
Far away Medium Adjacent |
1.00 0.67 0.33 |
Far distance between home & shelter, signifies higher risk. |
|
Embankment Facilities |
No Yes |
1.00 0.00 |
|
|
Main power supply |
Kerosene Solar only Electricity Electricity and solar |
1.00 0.75 0.50 0.25 |
Inconvenient power supply increases vulnerability. |
|
Facilities of training for Shelter & Settlement issues in term of disaster |
No Yes |
1.00 0.00 |
Training programs increase the capability against disaster. |
|
The training program is well enough |
No/no training Yes |
1.00 0.00 |
Well-equipped training programs increase the capability. |
|
Support during restricted fishing season |
Don’t get any Very low Low Well enough Not eligible |
1.00 0.75 0.50 0.25 0.00 |
The more support fishermen get the less vulnerable they are. |
|
Nearest distance of Hospital/community clinic |
≥3Km 1 to 2Km <1Km |
1.00 0.67 0.33 |
Far distance between home and hospital/clinic, indicate higher vulnerability. |
|
Effect of Disaster on Local Eco-System |
|||
|
Marker |
Classes |
Weights |
Comments |
|
Effect of disasters on local wildlife |
Strongly Moderately Low |
1.00 0.67 0.33 |
Effects on wildlife indicates vulnerability. |
Table 3. Capability marker, classes, associated weights, explanation, and references used in this study
|
Socioeconomic Status of the Respondents |
|||
|
Marker |
Classes |
Weights |
Comments |
|
Educational background |
No formal Education Primary (Class 1 to 5) Secondary (Class 6 to 10) Higher Secondary (Class 11 to 12) Tertiary (Above 12 Class) |
0.20 0.40 0.60 0.80 1.00 |
Higher education increases capability |
|
Occupation |
Farmer Fisher man Day labor Service holder Businessman |
0.20 0.40 0.60 0.80 1.00 |
Sustainable occupation increases capability |
|
Secondary Occupation |
Don’t Have Have |
0.00 1.00 |
Secondary occupation increases capability |
|
Annual income |
≤36,000 37,000-60,000 61,000-1,20,000 1,21,000-1,80,000 ≥1,81,000 |
0.20 0.40 0.60 0.80 1.00 |
More income increases capability |
|
Knowledge of climate change |
Moderate Well enough Sufficient |
0.33 0.67 1.00 |
Sufficient knowledge increases capability |
|
Level of knowledge about disaster management |
Nothing Little Somewhat Almost everything A great deal |
0.20 0.40 0.60 0.80 1.00 |
More knowledge about disaster management increases capability |
|
Water, Sanitation, & Hygiene Related Indicators |
|||
|
Marker |
Classes |
Weights |
Comments |
|
Alternative source of water |
Do not have Pond Canal Shallow tube-well River |
0.20 0.40 0.60 0.80 1.00 |
Safe alternative source during disaster increases capability |
|
Availability of suitable quantity of water for domestic doings |
No Maybe Yes |
0.00 0.50 1.00 |
Availability of water for household activities increases capability |
|
Water purification |
No knowledge Primitive knowledge Chemicals |
0.00 0.50 1.00 |
Knowledge in water purification increases capability |
|
Food Security and Livelihood Indicators |
|||
|
Marker |
Classes |
Weights |
Comments |
|
Food stock before the disaster |
No food stocks Sufficient food stocks |
0.00 1.00 |
Ability of stock food before disaster reflects capability |
|
Condition of boat |
Don’t have Poor Not so well Well |
0.00 0.33 0.67 1.00 |
Good condition of boat reflects capability |
|
Irrigation system |
No Yes |
0.00 1.00 |
Existence of irrigation system increases capability |
|
Main secondary agriculture products |
Herbs types vegetable Fruit Fish Poultry No dependency |
0.20 0.40 0.60 0.80 1.00 |
Having secondary agricultural product of lower vulnerability reflects higher capability |
|
Float gardening method in rainy season |
No Yes |
0.00 1.00 |
Practicing float gardening in rainy season increases capability |
|
Shelter and Settlement Related Indicators |
|||
|
Marker |
Classes |
Weights |
Comments |
|
Household condition |
Jhupri Katcha Semi-pukka Pukka |
0.25 0.50 0.75 1.00 |
Sustainable house increases capability |
|
Status of road connectivity with nearest Hospital/Cyclone Shelter/Bazar |
Others Katcha Semi-pukka Pukka |
0.25 0.50 0.75 1.00 |
Good condition connectivity road increases capability |
|
Extra facilities for children & women in the shelter |
No Yes |
0.00 1.00 |
Extra facilities increases capability |
|
Water supply facilities in the shelter |
Insufficient Moderate Sufficient |
0.33 0.67 1.00 |
Sufficient water supply facility reflects capability |
|
Management of the shelter |
Low Moderate Good Very good |
0.25 0.50 0.75 1.00 |
Good management of shelter reflects capability |
|
Receiving time of cyclone warning (in hour) |
<7h 7-24h >24h |
0.33 0.67 1.00 |
Upgrade Warning reflects capability as people get more time to be equipped |
|
Preparation for disasters |
Don’t want to do Not able to do I plan to do Have done |
0.25 0.50 0.75 1.00 |
Preparation before disaster increase capability |
|
Health-Related Indicators |
|||
|
Marker |
Classes |
Weights |
Comments |
|
Medical facilities |
Insufficient Sufficient |
0.00 1.00 |
Sufficient medical facilities reflects capability |
|
Special provision for a special group of people (e.g. pregnant women, aged people, disabled people, etc.) in the shelter |
No Yes |
0.00 1.00 |
Special provision increases capability |
|
Awareness program related to health issue |
Low Medium High |
0.33 0.67 1.00 |
High level of awareness program increases capability |
|
Assistance of health from the external sources during the disaster |
Very low Low Moderate Well enough Sufficient |
0.20 0.40 0.60 0.80 1.00 |
Sufficient health assistance increases capability |
Table 4. Summary statistics of important vulnerability markers gained from the household survey (N=200)
|
Marker |
Classes |
Char Hijla Upazilla’s Response (%) (N=200) |
|
Cultivable land grabbed by river erosion |
Yes No |
64 36 |
|
Loan taking frequency |
Regularly Often Occasionally Not at all |
30 28 28 14 |
|
Effect of disasters to the education system |
Strongly Moderately Low |
42 54 04 |
|
Platform height of the tubewell |
1 to 2 ft 3 to 4 ft >4 ft. |
94 06 00 |
|
Types of sanitation facilities |
No toilet Hanging/open Offset/Ring slab (Not water sealed) Well toilet (Not sealed) Septic/Ring/Pit/Well toilet |
02 14 34 22 28 |
|
Type of cleansing material used to wash hand |
Others Ash Soda Soap |
06 06 34 54 |
|
Fetching food scarcity during disaster period |
High (>2 weeks) Moderate (1-2 weeks) Low (<1 week) No food Scarcity |
48 34 10 08 |
|
Extents of crop damage due to past disaster |
Fully damage Almost damage Partially damage Not significantly damage No Damage/No land |
34 26 16 04 20 |
|
Extents of crop seed damage due to past disaster |
High Moderate Low No damage/No land |
54 26 02 18 |
|
Distance of cash cropland from river |
<100m 100-500m 501-1000m >1km No land |
26 22 10 22 20 |
|
Dilation in food supply due to disaster |
Yes No |
98 02 |
|
Cropland remain water-logged during rainy season |
Most of the land Half of it A little of it None of it/ No land |
52 14 00 34 |
|
Height of homestead plinth |
<1 ft 1 to 2 ft 3 to 4 ft 5 ft >5 ft |
06 44 50 00 00 |
|
Shelter distance from home |
Far away Medium Adjacent |
58 34 08 |
|
Embankment facilities |
No Yes |
100 00 |
|
Main power supply |
Kerosene Solar only Electricity Electricity and solar |
08 12 16 64 |
|
Facilities of training for Shelter & Settlement issues in term of disaster |
No Yes |
100 00 |
|
The training program is well enough |
No/no training Yes |
100 00 |
|
Nearest distance of Hospital/community clinic |
≥3Km 1 to 2Km <1Km |
100 00 00 |
|
Effect of disasters on local wildlife |
Strongly Moderately Low |
46 50 04 |
Table 5. Summary statistics of important capacity markers gained from the household survey (N = 200)
|
Marker |
Classes |
Char Hijla Upazilla’s Response (%) (N=200) |
|
Educational background |
No formal Education Primary (Class 1-5) Secondary (Class 6-10) Higher Secondary (Class 11-12) Tertiary (>12 Class) |
68 20 10 00 02 |
|
Occupation |
Farmer Fisher man Day labor Service holder Businessman |
32 44 10 08 06 |
|
Secondary Occupation |
Don’t Have Have |
66 34 |
|
Annual income |
≤36,000 37,000-60,000 61,000-1,20,000 1,21,000-1,80,000 ≥1,81,000 |
34 34 20 08 04 |
|
Knowledge of climate change |
Moderate Well enough Sufficient |
96 02 02 |
|
Level of knowledge about disaster management |
Nothing Little Somewhat Almost everything A great deal |
00 72 26 02 00 |
|
Water purification |
No knowledge Primitive knowledge Chemicals |
24 54 22 |
|
Food stock before the disaster |
No food stocks Sufficient food stocks |
82 18 |
|
Condition of boat |
Don’t have Poor Not so well Well |
66 10 14 10 |
|
Irrigation system |
No Yes |
100 00 |
|
Float gardening method in rainy season |
No Yes |
100 00 |
|
Household condition |
Jhupri Katcha Semi-pukka Pukka |
10 84 02 04 |
|
Status of road connectivity with nearest Hospital/Cyclone Shelter/Bazar |
Others Katcha Semi-pukka Pukka |
00 90 08 02 |
|
Extra facilities for children & women in the shelter |
No Yes |
100 00 |
|
Facilities of water supply in the shelter |
Insufficient Moderate Sufficient |
60 24 16 |
|
Management of the shelter |
Low Moderate Good Very good |
76 18 06 00 |
|
Medical facilities |
Insufficient Sufficient |
100 00 |
|
Special provision for a special group of people (e.g. pregnant women, aged people, disabled people, etc.) in the shelter |
No Yes |
100 00 |
|
Awareness program related to health issue |
Low Medium High |
88 12 00 |
|
Assistance of health from the external sources during the disaster |
Very low Low Moderate Well enough Sufficient |
62 36 02 00 00 |
2.4 Index calculation
Each vulnerability and capability indicator relied on an investigation. A sum of twenty-five markers was elected for vulnerability (see Table 2) & twenty-five markers were elected for capability (see Table 3). For indexes assessments, numerous methodology relied on previous works was used [15, 53-61]. The markers were parted into several classes as per the attributes and nature of the markers. These classes express to the answers of the questionnaire of the study information and imply the level of variety in each marker. In each class, weights were selected relies upon the quantity of the classes and their capacity and vulnerability response. Markers with just two degrees of class for example Yes/No were assigned with their weight assessment of 1 & 0. For three classes, the weights were (1, 0.67 & 0.33) or (1, 0.5 & 0.25), in light of the rank of the weight. For four categories, the weight was 1, 0.75, 0.50 & 0.25. Similarly, for five level classes, the score was 1, 0.8, 0.6, 0.4 & 0.2 respectively. For vulnerability framework, the most elevated vulnerable class was doled out with a weight assessment of 1; whereas the smallest vulnerable class was allotted with an assessment of 0 (Table 2). For capacity, the most noteworthy capable class was doled out with an assessment of 1; whereas the smallest capable class was relegated with an estimation of 0 (Table 3). Consequently, the composite index for every part links somewhere in the range of 0 & 1.
Index Vulnerability (IV) for individual indicators has been calculated using the Eq. (3).
$I V=\frac{R_1+R_2+R_3+\ldots \ldots \ldots+R_n}{n}=\sum_{i=1}^n \frac{R_n}{n}$ (3)
where, IV=Index Vulnerability; R1(first response value) to Rn (final response value)=Response values from the individual respondent for the indicator; and n=Total number of responses for that indicator.
Composite Vulnerability Index for the factors ‘Socioeconomic Status’, ‘Water, sanitation, & hygiene’, Food security & livelihood status’, Shelter & settlement’, ‘Health’, and ‘Effect on the Ecosystem’ are computed by the Eq. (4).
$C V I=\frac{I V_1+I V_2+I V_3+\ldots \ldots \ldots+I V_n}{n}=\sum_{i=1}^n \frac{I V_i}{n}$ (4)
where, CVI=Composite Vulnerability Index for a single factor; IV1 to IVn=Index vulnerability under the factor; and n=total indicators under that factor.
The CVI assessed for each sector by succeeding the principle of calculating composite indexes, which are well-defined as:
$Socioeconomic Status Index (SoI)=\frac{\sum_{i=1}^n \text { SoIV }_i}{n}$ (5a)
$Water, Sanitation, and Hygiene Index (WaI)=\frac{\sum_{i=1}^n \text { WaIV }_i}{n}$ (5b)
$Food Security and Livelihood Index (FoI)=\frac{\sum_{i=1}^n F_{o I V}}{n}$ (5c)
$Shelter and Settlement Index (ShI)=\frac{\sum_{i=1}^n S_h I V_i}{n}$ (5d)
$Health Index (HeI)=\frac{\sum_{i=1}^n \mathrm{HeIV}_i}{n}$ (5e)
$Ecosystem Index (E c I)=\frac{\sum_{i=1}^n E c I V_i}{n}$ (5f)
Next computing these sector-wise indices of vulnerability, the total composite vulnerability indices (TVI) was evaluated utilizing the Eq. (6).
$Total Index (TVI)=\frac{S o I+W o I+F o I+S h I+H e I+E c I}{6}$ (6)
Similarly, Index of Capability (IC), Composite Index of Capability (CIC) for the capacity factor, and Total Index of Capability (TIC) were calculated. Table 2 and Table 3 presentations the indicators, classes, weights, clarification, and the references which incorporate the noticed studies for estimating the Vulnerability & the Capacity Indexes.
2.5 Data analysis
Collecting all kind of data, data of qualitative were transformed into quantitative by allocating arithmetic scores for assessing vulnerability and capacity indexes (see Table 3 and Table 4). The SPSS statistics 26 was operated for executing ANOVA for analysis the level of significance of the evaluated vulnerability and capacity indexes under several situations. For identifying vulnerability and capacity indexes that are different significantly from each other, the mean value and standard error was utilized and considered.
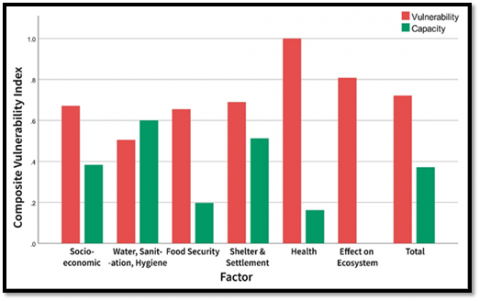
3.1 Vulnerability assessment
In this study outcomes identify that in compare to all of the markers, the area was health, effect of disaster on local eco-systemically and the shelter & settlement markers more vulnerable with a mean (±standard error) vulnerability index of 1, 0.81±0.01 & 0.69±0.01 respectively (Table 6 and Figure 2) while the mean (±standard error) of vulnerability index for socio-economical, food security & livelihood and WASH (Water, Sanitation and Hygiene) related markers were 0.67±0.023, 0.65±0.033 & 0.51±0.012 respectively (Table 6 and Figure 2). This huge Health vulnerability can be attributed to almost full respondents of the distance of community clinics are more than 3km (see Table 4). It is incredibly harsh that the nearest clinic is about 25km away from our study area. Similarly, almost 96% of households were faced strong to moderate effect on local eco-system (Table 4). Though the people of this area are significantly knowledgeable about the importance of wildlife, around 56% of them argued that their local wildlife is somehow endangered. Talking about shelter, nearly 50% of the people live in houses having a plinth height of fewer than 2 meters and about 58% of the people’s home are far away from shelters were made the area more vulnerable (Table 4). Lacking of ‘embankment facilities’ and lacking of ‘facilities of training for Shelter & Settlement issues in term of disaster’ were also made the area towards more vulnerably side (see Table 4). Respondents argued that neither the local government nor the NGOs provide any training programs to modernize their rescue skills. In contrast, ‘main power supply’ and ‘support during restricted fishing season’ markers were dropped the value of vulnerability.
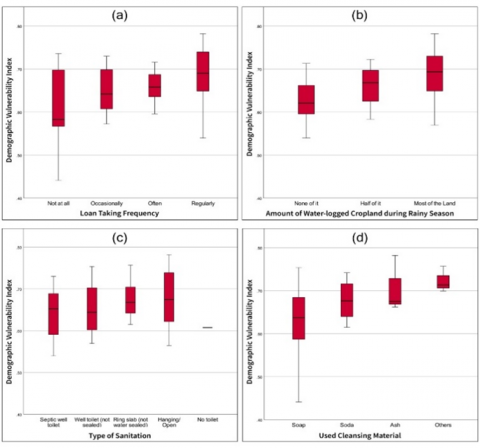
Besides, the socio-economic indicators like ‘cultivable land grabbed by river erosion’ and ‘effect of disasters to the education system’ observed in higher vulnerability index. Differently, loan taking frequency marker observed in moderate the index value in compare to others markers (Table 4 and Figure 3 (a)). Likewise, in terms of food security & livelihood indicators, the area markers such as ‘fetching food scarcity’ (48% for high), ‘extents of crop seed damage due to past disaster’ (54% for high), ‘dilation in food supply due to disaster’ (98% for yes) and ‘cropland remain water-logged during rainy season’ (52% for most of the land) facilitated in higher vulnerability rate (Table 4 and Figure 3 (b)).
Lastly, in terms of Water, Sanitation, & Hygiene related markers (WASH); almost 94% peoples were used platform height of tubewell (1-2 ft) (Table 4) which was made the area more harmful. In contrast, the area markers like ‘source of drinking water’, ‘distance of drinking water source from homes’, ‘types of sanitation facilities’ and ‘type of cleansing material used to wash hand’ facilitated in lower vulnerability index (Figure 3 (c), Figure 3 (d)). For example: around 90% of the respondents can manage their drinking water from a deep tube well and they also rely on contaminated sources for other daily activities like bathing, cleaning utensils. In the case of sanitation, we got only 28% of participants who can afford well toilets and almost 22% who can afford well toilets (not sealed) (Table 4 and Figure 3 (c)).
Sum up, most of the households were in bad condition in terms of ‘dilation in food supply due to disaster’, ‘embankment facilities’, ‘facilities of training for Shelter & Settlement issues in term of disaster’ and ‘distance of the closest community hospital or clinic’. However, the study response data exposes that the area was more vulnerable to various disastrous events in terms of health, eco-system and shelter related indicators. Nevertheless, the overall vulnerability index of the area is 0.72±0.015 which indicates that the overall area is highly vulnerable to various disastrous events (Table 6 and Figure 2).
Table 6. Index of Vulnerability (IV) and Capability (IC) (mean±standard error) values for Char Hizla upazila, Barishal. Table displays that the study region was more vulnerable than capability to the disasters
|
Indicator |
Vulnerability Index |
Capability Index |
|
Socioeconomic status |
0.67±0.023 |
0.38±0.026 |
|
Water, Sanitation & Hygienic related |
0.51±0.012 |
0.60±0.020 |
|
Food Security & Livelihood |
0.65±0.033 |
0.20±0.031 |
|
Shelter & Settlement related |
0.69±0.010 |
0.51±0.011 |
|
Health related |
1±0.00 |
0.16±0.021 |
|
Effect of disaster on local eco-system |
0.81±0.010 |
----- |
|
|
|
|
|
Total |
0.72±0.015 |
0.37±0.018 |
Figure 2. Indicator-wise and overall composite vulnerability & capacity index of the study region. The overall results signify that the overall vulnerability overweight the overall capacity to the disastrous events
Figure 3. (a-d) Demographic Vulnerability markers reaction across (a) Loan taking frequency (b) Amount of water-logged cropland during rainy season (c) Type of Sanitation (d) Used cleansing materials (p<0.05 vary significantly)
3.2 Capacity assessment
In this disaster-influenced study area was discovered to be less equipped dealing with calamites (Table 6 and Figure 2). Table 6 displays the response rates of information of the critical capacity indicators. As far as the Water, Sanitation, and Hygiene (WASH) Related Indicators, the area was more capable with capacity index esteem 0.60±0.02 (±standard error) (Table 6 and Figure 2). Markers of WASH related indicators, for example, almost 90% households using deep tube well as source water and nearly 66% families using canal, river or shallow tube well as alternative source water (Table 5). Additionally, the markers like ‘availability of sufficient quantity of water for domestic doings (42% for Yes) and about 76% families knowing primitive knowledge of water purification (see Table 5). These evidences have made the area more equipped for taking care of calamities.
With regards to shelter & settlement related indicators, the area was moderate capable with capability index estimation of 0.51±0.011 (Table 6 and Figure 2). Shockingly, almost 94% of household’s condition was katcha & jhupri (made of tree leaves, jute sacks and sticks), whereas around 90% household roads were katcha which are connected to the Bazar/Hospital/Cyclone shelter (Table 5). Insufficient water supply facility as well as lacking of extra care for women in the shelter made the area less capable. Additionally, poor management in the shelter and having no any disaster preparation made the area towards less capably side.
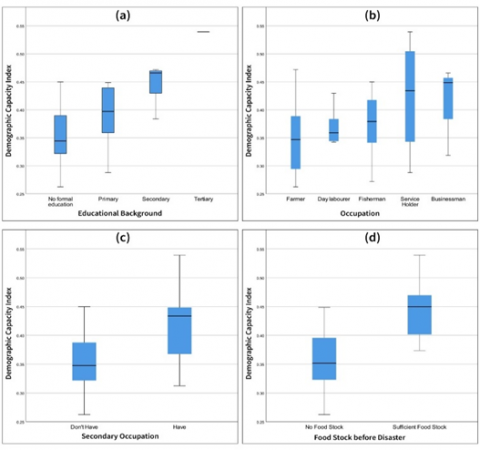
Socioeconomically the area did not seem to be reasonably capable with a value of 0.38±0.026 (Table 6 and Figure 2) as nearly 68% of the populations did not have any kind of formal education (Table 5 and Figure 4 (a)). Similarly, more than 75% of people occupy vulnerable occupations like farming & fishing and besides among all 66% of the population have no secondary occupation (Table 5 and Figure 4 (b), Figure 4 (c)). Additionally, only 32% of the households had a family income of more than 60,000 BDT (Table 5). The participants had not such academic knowledge and almost 94% of them said that they cannot track the year-to-year change of their surrounding climate. It was horrible that only 2% of participants contained better knowledge about disaster management (Table 5).
Figure 4. (a-d) Demographic Capacity markers reaction across (a) Educational background (b) Occupation (c) Secondary occupation (d) Food stock before disaster (p<0.05 vary significantly)
With regards to food security & livelihood related indicators (with a minimum value of capability index is 0.20±0.031), about 82% of participants could not stock any kind of foods (Table 5 and Figure 4 (d)). In addition, no well-constructed irrigation system had been planted in the region. So, about 42% of people were taken by soybean (Glycine max) as their secondary agricultural product (vegetable) though half of the population had no involvement in farming secondary agricultural product. Float gardening is yet unexplored by the respondents.
Health related indicators have negligible amount of capability index score. Almost all the respondent assured that the medical facility is insufficient. For instance, 98% of participants said that the health assistance programs were conducted in very lower frequencies (Table 5).
Summarize the overall capability index of 0.37±0.018 signifies that the studied area was more vulnerable than capable in taking care of various natural disasters (see Table 6 and Figure 2).
Overall, the study outcomes reveal that the areas vulnerability do outweigh the capability. Similarly, the areas had a significant number of vulnerable indicators such as health, followed by local ecosystem, shelter & settlements and socioeconomic issues respectively. On the other hand, the areas had some good number of capability markers such as WASH and shelter & settlements. To some extension information of the authors, no investigations exist in the study region, which evaluated disasters’ vulnerability & capability methodologies from the perceptions of five major indicators like socioeconomic status, WASH, food security & livelihood, shelter & settlement and health concerns. The research evaluated the mean vulnerability & capability and indicator-wise particular vulnerability & capability. In a nutshell, the outcomes exposed that the studied region is more vulnerable than capable. This research assessed that the health and shelter & settlement indicators are extremely vulnerable because of their poor foundations, brittle health structure and lack of skills in the coastal region of Bangladesh. Similarly, Salman [15], Hossain [8] and Sattar and Cheung [59] observed that the coastal people of Bangladesh had poor health infrastructures as well as had poor quality of settlement status. Likewise, Chan et al. [60] also reported that Bangladesh’s health sector is extremely vulnerable to natural calamities. Tuihedur Rahman et al. [42]; Alam et al. [13]; Kulatunga et al. [61] also observed that improvement of socio & environmental issues for adaptation policies making, improvement of new crop varieties, planting time changing, new migration strategies, cyclone shelters improvement and embankments are essential to diminish risk of disaster in the coastal areas of Bangladesh, which is constant with the outcomes of the existing research. Such matters have been detected in the recent time Amphan Cyclone and the COVIT 19 happenings in Bangladesh. Charitable events from the Government & NGOs can reduce to some extent of the vulnerability and necessitates much responsiveness for applying further mitigation actions in these grounds. For example, almost all of the participants (see in Table 4) accept as true that due to lack of any awareness training programs about disaster and embankment facilities cause vulnerable during the hazardous events, so training programs as well as embankment facilities should be sponsored. In addition, about 82% respondents (see in Table 5) said that because of lacking food stock before the disastrous events in advance reasons scarcity of food after the situation, so then food stock practice at ground levels should be encouraged. The outcomes from this study can be utilized for upcoming day’s mitigation strategies to satisfy the coastal communities’ desires. More significantly, an inclusive image of the vulnerability and capability indicators conditions in the study area has been exposed which will aid to further development of these indicators. This research has some downsides as well, which are essentially connected to the opportunity of the study. For example, there are too many philanthropic concerns exist, but this research concentrated on concerns connected to socioeconomic status; WASH; shelter & settlement; health; and food security & livelihood. Moreover, this investigation comprised only of twenty-five markers for both the vulnerability and capability to retain the questionnaire in size, while some other markers were not taken into account. So, this is due to political instability, funds, resources, awareness and time limitations. In addition, the outcomes of this study fully depend on the respondents’ replies. Requiring in-depth study also conform the gaps and limitations of knowledge. Furthermore, this study recommends to employ different methodologies like geospatial analysis, to add more markers for questionnaire survey, to integrate different branches of experts and local communities for future studies.
Sum up, this study signifies the crucial data of natural calamity vulnerability & capability and their related effects and existing scenarios of adaptation resilience conditions towards this calamity.
This study makes an attempt to assess the vulnerability & capability of the Bangladesh’s most underrated disastrous area, Char Hizla upazila under Barishal division, to severely many disastrous events happened from time to time. There is a lack of the vulnerability & capacity assessment of the areas to these surprising hazards in the literature, which this study desire to complete. Such studies may undertake an intense work in making the development of the areas for the Policy Makers of the Government & NGOs. The vulnerability & capability of Char Hizla was assessed regarding socioeconomic status, water, sanitation & hygienic (WASH), food security & livelihood condition, shelter & settlement, health and effect on eco-system indicators. A sum of twenty-five vulnerability and capability markers were set up reliant on various literature and local condition to make a household questionnaire review evaluation. A total of 200 households review evaluation were collected in the three unions of Char Hizla, where various risk reduction policies (to develop infrastructures, emergency responses, warning and awareness facilities etc.), adaptation strategies (cultivation policies, livelihood status, to increase NGOs facilities etc.) and further studies (to conduct research in universities funded by Governments and NGOs) will be motivated in upcoming days in order to reduce in on these extreme shocking effect on the region’s vulnerability and to increase the capability to the extreme hazards. The results signify that Char Hizla upazila was by and large more vulnerable than the capability to the extreme hazards. In the context of health and the effect of disaster on local ecosystem, the region was not well equipped for any kind of disaster impact and therefore threatened more harm and the local communities felt dangerous during these extreme events than that of the previous events.
The authors are also thankful to all faculties of the Department of Geology and Mining, University of Barishal, Bangladesh for their supports. This paper has been helped immensely from the fruitful remarks of two anonymous reviewers. This project had not received any funds from any organizations or institutes.
[1] Luetz, J.M. (2013). Climate migration. Routledge Handbook of International Environmental Law, 474-487. https://doi.org/10.4324/9781003137825-38
[2] Salman, M.A., Ahmed, F. (2020). Climatology in barishal, Bangladesh: A historical analysis of temperature, rainfall, wind speed and relative humidity data. Malays. J. Geosciences (MJG), 4(1): 43-53. http://doi.org/10.26480/mjg.01.2020.43.53
[3] Intergovernmental Panel on Climate Change. (2014). Climate change 2014 part A: Global and sectoral aspects. Climate change 2014: Impacts, adaptation, and vulnerability. part A: Global and sectoral aspects. Contribution of Working Group II to the Fifth Assessment Report of the Intergovernmental Panel on Climate Change.
[4] Salman, M.A., Nomaan, M.S.S., Saha, A. (2023). An updated earthquake catalog for Bangladesh: An attempt at a seismic risk evaluation. Geology, Geophysics and Environment, 49(1). http://dx.doi.org/10.7494/geol.2023.49.1.37
[5] Salman, A., Haque, A., Rahman, M., Rabby, M.J., Hossen, S., Halder, P., Evan, R.I. (2023). NDVI-based analysis of green space decline and air quality in Dhaka: Implications for sustainable development goals. Environmental & Earth Sciences Research Journal, 10(2): 73-83.
[6] Tahsin, M., Salman, M.A., Akhter, S.H. (2018). Earthquake catalogue of Bangladesh. International Journal of Science, Environment and Technology, 7(3): 939-949.
[7] Pouliotte, J., Smit, B., Westerhoff, L. (2009). Adaptation and development: Livelihoods and climate change in Subarnabad, Bangladesh. Climate and Development, 1(1): 31-46. https://doi.org/10.3763/cdev.2009.000
[8] Hossain, M.N. (2015). Analysis of human vulnerability to cyclones and storm surges based on influencing physical and socioeconomic factors: Evidences from coastal Bangladesh. International Journal of Disaster Risk Reduction, 13: 66-75. https://doi.org/10.1016/j.ijdrr.2015.04.003
[9] Salman, M.A., Hasan, S.R., Ahmed, S., Tahsin, M., Khan, N. (2018). Shoreline change rate along the Southern Coast of Bangladesh due to climate change using Remote Sensing & ArcGIS Technology. International Journal of Emerging Technology and Advanced Engineering, 8(3).
[10] Rawlani, A.K., Sovacool, B.K. (2011). Building responsiveness to climate change through community based adaptation in Bangladesh. Mitigation and Adaptation Strategies for Global Change, 16: 845-863. https://doi.org/10.1007/s11027-011-9298-6
[11] Wood, S.A., Jina, A.S., Jain, M., Kristjanson, P., DeFries, R.S. (2014). Smallholder farmer cropping decisions related to climate variability across multiple regions. Global Environmental Change, 25: 163-172. https://doi.org/10.1016/j.gloenvcha.2013.12.011
[12] Izumi, T., Shaw, R. (2014). A new approach of disaster management in Bangladesh: Private sector involvement. Risk, Hazards & Crisis in Public Policy, 5(4): 425-445. https://doi.org/10.1002/rhc3.12069
[13] Alam, G.M., Alam, K., Mushtaq, S. (2017). Climate change perceptions and local adaptation strategies of hazard-prone rural households in Bangladesh. Climate Risk Management, 17: 52-63. https://doi.org/10.1016/j.crm.2017.06.006
[14] Government of Bangladesh. (2008). Cyclone sidr in Bangladesh: Damage, loss and needs assessment for disaster recovery and reconstruction. Power: 177.
[15] Salman, M.A. (2023). Assessment of vulnerability and capacity to the cyclone ‘Amphan’ impacts of the southwestern coastal part of Bangladesh: An empirical contextual investigation. Natural Hazards, 115(2): 1715-1742. https://doi.org/10.1007/s11069-022-05615-1
[16] Gandure, S., Walker, S., Botha, J.J. (2013). Farmers' perceptions of adaptation to climate change and water stress in a South African rural community. Environmental Development, 5: 39-53. https://doi.org/10.1016/j.envdev.2012.11.004
[17] Alam, G.M. (2016). An assessment of the livelihood vulnerability of the riverbank erosion hazard and its impact on food security for rural households in Bangladesh. Doctoral Dissertation, University of Southern Queensland.
[18] Niles, M.T., Brown, M., Dynes, R. (2016). Farmer’s intended and actual adoption of climate change mitigation and adaptation strategies. Climatic Change, 135(2): 277-295. https://doi.org/10.1007/s10584-015-1558-0
[19] Mallick, B. (2014). Cyclone shelters and their locational suitability: An empirical analysis from coastal Bangladesh. Disasters, 38(3): 654-671. https://doi.org/10.1111/disa.12062
[20] Burton, I., Diringer, E., Smith, J. (2006). Adaptation to climate change: International policy options. Arlington: Pew Center on Global Climate Change.
[21] Burton, I., Bizikova, L., Dickinson, T., Howard, Y. (2015). Integrating adaptation into policy: Upscaling evidence from local to global. In Integrating Climate Change Actions into Local Development. Routledge, 7: 371-376. https://doi.org/10.1080/14693062.2007.9685662
[22] Burton, I. (1993). The Environment As Hazard. Guilford Press.
[23] Bohle, H.G., Downing, T.E., Watts, M.J. (1994). Climate change and social vulnerability: Toward a sociology and geography of food insecurity. Global Environmental Change, 4(1): 37-48. https://doi.org/10.1016/0959-3780(94)90020-5
[24] Sorensen, J.H., White, G.F. (1980). Natural hazards. In Environment and Culture. Boston, MA: Springer US, 279-318. https://doi.org/10.1007/978-1-4899-0451-5_9
[25] Warrick, R.A., Ahmad, Q.K. (Eds.). (2012). The Implications of Climate and Sea-Level Change for Bangladesh. Springer Science & Business Media.
[26] Nicholls, R.J., Hutton, C.W., Adger, W.N., Hanson, S.E., Rahman, M.M., Salehin, M. (2018). Ecosystem services for well-being in deltas: Integrated assessment for policy analysis. Springer Nature. https://doi.org/10.1007/978-3-319-71093-8
[27] Carter, T., Parry, M., Harasawa, H., Nishioka, S. (1994). IPCC technical guidelines for assessing climate change impacts and adaptations. In Part of the IPCC Special Report to the First Session of the Conference of the Parties to the UN Framework Convention on Climate Change, Intergovernmental Panel on Climate Change. Department of Geography, University College London, UK and Center for Global Environmental Research, National Institute for Environmental Studies, Tsukuba, Japan.
[28] Younus, M.A.F., Kabir, M.A. (2018). Climate change vulnerability assessment and adaptation of Bangladesh: Mechanisms, notions and solutions. Sustainability, 10(11): 4286. https://doi.org/10.3390/su10114286
[29] Harvey, N., Dew, R.E., Hender, S. (2017). Rapid land use change by coastal wind farm development: Australian policies, politics and planning. Land Use Policy, 61: 368-378. https://doi.org/10.1016/j.landusepol.2016.11.031
[30] Gallardo, M. (2018). Identifying vulnerability to poverty: A critical survey. Journal of Economic Surveys, 32(4): 1074-1105. https://doi.org/10.1111/joes.12216
[31] Birkmann, J. (2007). Risk and vulnerability indicators at different scales: Applicability, usefulness and policy implications. Environmental Hazards, 7(1): 20-31. https://doi.org/10.1016/j.envhaz.2007.04.002
[32] International Strategy for Disaster Reduction. (2004). Living with risk: A global review of disaster reduction initiatives. UN Publications. Vol. 1.
[33] Bohle, H.G. (2001). Vulnerability and Criticality: Perspectives from Social Geography, 2(01): 3-5.
[34] Gaillard, J.C. (2010). Vulnerability, capacity and resilience: Perspectives for climate and development policy. Journal of International Development: The Journal of the Development Studies Association, 22(2): 218-232. https://doi.org/10.1002/jid.1675
[35] Aysan, Y.F. (2015). Keynote paper. Vulnerability Assessment.
[36] Wilches-Chaux, G. (1989). Disasters, Ecologism and Professional Education. SENA, Popayan, Colombia.
[37] Cannon, T. (1994). Vulnerability analysis and the explanation of ‘natural’disasters. Disasters, Development and Environment, 1: 13-30.
[38] Chambers, R. (2006). Vulnerability, coping and policy (editorial introduction). Institute of Development Studies, 37(4): 33-40. https://doi.org/10.1111/j.1759-5436.2006.tb00284.x
[39] Sharma, U., Patwardhan, A., Parthasarathy, D. (2009). Assessing adaptive capacity to tropical cyclones in the East coast of India: A pilot study of public response to cyclone warning information. Climatic Change, 94(1-2): 189-209. https://doi.org/10.1007/s10584-009-9552-z
[40] Awal, M., Rashid, M., Islam, A.F.M.T., Imam, M., Sarkar, M. (2016). Measuring climate change vulnerability and its adaptive capacity: Policies and planning for Bangladesh. British Journal of Environment and Climate Change, 6(4): 279-298. https://doi.org/10.9734/BJECC/2016/27382
[41] Kabir, M.I., Rahman, M.B., Smith, W., Lusha, M.A.F., Azim, S., Milton, A.H. (2016). Knowledge and perception about climate change and human health: Findings from a baseline survey among vulnerable communities in Bangladesh. BMC Public Health, 16: 1-10. https://doi.org/10.1186/s12889-016-2930-3
[42] Tuihedur Rahman, H.M., Hickey, G.M., Ford, J.D., Egan, M.A. (2018). Climate change research in Bangladesh: Research gaps and implications for adaptation-related decision-making. Regional Environmental Change, 18: 1535-1553. https://doi.org/10.1007/s10113-017-1271-9
[43] Rahman, S.A., Islam, M.M., Salman, M.A., Rafiq, M.R. (2022). Evaluating bank erosion and identifying possible anthropogenic causative factors of Kirtankhola River in Barishal, Bangladesh: An integrated GIS and Remote Sensing approaches. International Journal of Engineering and Geosciences, 7(2): 179-190. https://doi.org/10.26833/ijeg.947493
[44] Shaw, R., Mallick, F., Islam, A. (Eds.). (2013). Climate change adaptation actions in Bangladesh. New York: Springer. https://doi.org/10.1007/978-4-431-54249-0
[45] Momtaz, S., Shameem, M. (2015). Experiencing climate change in Bangladesh: Vulnerability and adaptation in coastal regions. Academic Press. https://doi.org/10.1016/C2014-0-04360-2
[46] Brammer, H. (2017). Bangladesh’s diverse and complex physical geography: Implications for agricultural development. International Journal of Environmental Studies, 74(1): 1-27. https://doi.org/10.1080/00207233.2016.1236647
[47] Younus, M.A.F. (2017). Adapting to climate change in the coastal regions of Bangladesh: Proposal for the formation of community-based adaptation committees. Environmental Hazards, 16(1): 21-49. https://doi.org/10.1080/17477891.2016.1211984
[48] Younus, M.A.F. (2017). An assessment of vulnerability and adaptation to cyclones through impact assessment guidelines: A bottom-up case study from Bangladesh coast. Natural Hazards, 89: 1437-1459. https://doi.org/10.1007/s11069-017-3027-8
[49] Chen, J., Mueller, V. (2018). Coastal climate change, soil salinity and human migration in Bangladesh. Nature Climate Change, 8(11): 981-985. https://doi.org/10.1038/s41558-018-0313-8
[50] Change, P.C. (2018). Global warming of 1.5° C. World Meteorological Organization: Geneva, Switzerland.
[51] Cochran, W.G. (1977). Sampling Techniques. John Wiley & Sons.
[52] Abney, F.G., Hill, L.B. (1966). Natural disasters as a political variable: The effect of a hurricane on an urban election. American Political Science Review, 60(4): 974-981. https://doi.org/10.2307/1953770
[53] Jamshed, A., Rana, I.A., Mirza, U.M., Birkmann, J. (2019). Assessing relationship between vulnerability and capacity: An empirical study on rural flooding in Pakistan. International Journal of Disaster Risk Reduction, 36: 101109. https://doi.org/10.1016/j.ijdrr.2019.101109
[54] Subhani, R., Ahmad, M.M. (2019). Socio-economic impacts of cyclone aila on migrant and non-migrant households in the southwestern coastal areas of Bangladesh. Geosciences, 9(11): 482. https://doi.org/10.3390/geosciences9110482
[55] Welle, T., Birkmann, J. (2015). The world risk index-an approach to assess risk and vulnerability on a global scale. Journal of Extreme Events, 2(01): 1550003. https://doi.org/10.1142/S2345737615500037
[56] Rana, I.A., Routray, J.K. (2016). Actual vis-à-vis perceived risk of flood prone urban communities in Pakistan. International Journal of Disaster Risk Reduction, 19: 366-378. https://doi.org/10.1016/j.ijdrr.2016.08.028
[57] Rana, I.A., Routray, J.K. (2018). Multidimensional model for vulnerability assessment of urban flooding: An empirical study in Pakistan. International Journal of Disaster Risk Science, 9: 359-375. https://doi.org/10.1007/s13753-018-0179-4
[58] Rana, I.A., Routray, J.K. (2018). Integrated methodology for flood risk assessment and application in urban communities of Pakistan. Natural Hazards, 91: 239-266. https://doi.org/10.1007/s11069-017-3124-8
[59] Sattar, M.A., Cheung, K.K. (2019). Tropical cyclone risk perception and risk reduction analysis for coastal Bangladesh: Household and expert perspectives. International Journal of Disaster Risk Reduction, 41: 101283. https://doi.org/10.1016/j.ijdrr.2019.101283
[60] Chan, E.Y.Y., Huang, Z., Lam, H.C.Y., Wong, C.K.P., Zou, Q. (2019). Health vulnerability index for disaster risk reduction: Application in belt and road initiative (BRI) region. International Journal of Environmental Research and Public Health, 16(3): 380. https://doi.org/10.3390/ijerph16030380
[61] Kulatunga, U., Wedawatta, G., Amaratunga, D., Haigh, R. (2014). Evaluation of vulnerability factors for cyclones: The case of Patuakhali, Bangladesh. International Journal of Disaster Risk Reduction, 9: 204-211. https://doi.org/10.1016/j.ijdrr.2014.05.011