Krishna Anand* | Sundara Raman
© 2021 IIETA. This article is published by IIETA and is licensed under the CC BY 4.0 license (http://creativecommons.org/licenses/by/4.0/).
OPEN ACCESS
Spiraling continued increase in Emission of Green House Gases [GHG] play a significant role in impacting the environment and also human beings at large. Although recent studies have concentrated to an extent on developing schemes for reduction of Carbon dioxide emission and have identified methodologies in implementing the same, sufficient amount of studies have not been done on other greenhouse gases which also have adverse global impact as Carbon dioxide. Applications where methane and, nitrous oxide are emitted in abundance have continued to flourish. This work focuses on select methodologies in reducing all types of Greenhouse gases giving a larger amount of importance to ones which are more severe and the ones that cause depletion of ozone layer. Research findings have shown that majority of greenhouse gas emissions occur as a result of industry advances. Hence, as time is running out, there is an urgent need in identifying ways to mitigate these GHG emissions, thereby contributing to cleaner and healthier environment.
carbon metrics, circular economy, greenhouse gas emissions, greenhouse model, green information system, regulatory portal, webinar
As one enters into the limelight of the twenty first century, it can be seen that technology has grown by leaps and bounds. Applications which used to take a significant amount of time have found to be completed in much shorter time. With advent of new technologies and high-speed machines, a vast variety of jobs have been completed with the click of a button. Man’s expectations continue to soar. However, the consequences on the environmental impact have been grossly ignored owing which problems have multiplied manifold. The adverse impact on environment followed by impact on his / her health has reached a stage where it cannot be taken lightly anymore. The natural resources have been severely depleted. The rise in population has further aggravated the problem.
The only solution in sight is Green Technology. This in turn focuses on minimizing the impact of industrial advancements and processes owing to excessive use of technology. Recycling has come as a blessing in disguise. Implementation of energy efficient systems coupled with proper resource utilization can bring a drastic amount of relief to the environment and human beings at large. To validate proper utilization and minimize pollution, ratings like Energy Star and EPEAT (Electronic Product Environment Assessment Tool) have been proposed. A Green Computing team also works in purchasing products relevant to green computing. Chlorofluorocarbons and Hydrochloroflurocarbons contribute to depletion of ozone layer. Methane is one major contributor of greenhouse gases, closely followed by nitrous oxides through agricultural and industrial practices.
1.1 Literature survey
The huge amounts of emission of greenhouse gases have been a serious problem over several decades. However, the awareness has been minimal until recent years where increased emissions have led to catastrophic effects. Over the past ten years, efforts from Government and private agencies have increased manifold in this direction. As transportation plays a significant role in greenhouse emissions, work carried out in this direction has been given special importance. In the year 2008, Mcdonald et al. [1] designed a simulation model for sugarcane transport based on behavioral logistics. A year later, Li et al. [2] made further improvements to this model by considering set of data for transport based on the view from local authorities. Leonhard and Murray [3] had published a book in the year 2009 on effects of reduction in emissions when transport is minimized and work is carried at home. Unhelkar had published a book exclusively focusing on the Green IT strategies to be adopted in every field of work taking into consideration the environmental aspects [4]. Martin and Sshaheen [5] considered the Northern American region alone and analyzed in detail the amount of reduction in greenhouse gases when cars are shared instead of individual usage. Krishna Anand et al. [6] had designed a fuzzy expert system for improving the performance of boilers. Later in the year 2012, Psaraki et al. [7] had assessed on the balance needed between effects of improvement in technology monetarily and reduction of Carbon dioxide emissions. Between 2012 and 2014, Anand et al. designed and incorporated suitable soft computing methods using Neural Networks and Fuzzy Logic to maximize productivity of a chemical recovery boiler [8, 9]. Later, along with Priya and Sagambari, the exact impact of climate change has been assessed and suitable improvements have been suggested for mitigating the emissions [10]. A special amount of importance has been given by Ragunath et al. in the year 2015 where they gave exclusive amount of importance to greenhouse gases other than Carbon dioxide [11]. In the same year, Mahmod et al. [12] studied the effects of information technology on Carbon dioxide emissions in the transport field and in turn tabulated suitable results. Abhinav and Anand [13] designed a Fuzzy expert system for effective bus transportation. Orozco and Llano [14] developed an application in the year 2016 that gives suggestions on the right kind of speed in which the vehicle must be driven focusing on reduced Carbon dioxide emissions. Anders et al. [15] proposed a method for identification, measurement and analysis of electric power and equivalent carbon dioxide savings in the supply chain of an Information and Communication Technology Equipment Manufacturer. In the year 2017, Loeb et al. [16] performed modeling and analysis for an application dealing with waste heat recovery. Gillingham and Stock [17] analyzed the monetary aspects by dealing with the amount to be spent for reducing greenhouse gas emissions. Sundara Raman [18] presented the best energy practices that need to adopted for cleaner and sustainable energy efficient production in a National workshop in 2018. He also formulated a set of norms and mitigation schemes for stack emissions in a webinar program on pulp and paper organized by CII [19]. In early 2019, Budihal and Anand [20] designed a Neural Network for maximizing sugarcane yield taking a particular region into consideration. In the later part of the year, Lan [21] also considered an agricultural application and analyzed the sensitivity of consumer’s greenness sensitivity, green cost coefficient and stochastic output ratio. During the same year, Anand et al. [22] had brought into limelight emissions of greenhouse gases during the design of a neural network for an automated lime kiln plant.
2.1 Choice of greenhouse gases
Greenhouse gases pervade all across the globe. Seven greenhouse gases have been taken into consideration. Among these, Carbon dioxide, Methane and Nitrous Oxide have been found to be naturally occurring while Hydro fluorocarbons, Perflurocarbons and Sulphur Hexafluoride are manmade. Apart from that, negligible amount of Nitrogen Trifluoride [arising out of etching of solar panels] also gets emitted. However, this has not been taken into consideration in this work.
The first step before undertaking this work in emission reduction deals with finding relationships between the impact caused by each of the greenhouse gases. To arrive at a standard, the Carbon dioxide equivalent for each gas is taken and this matches with the global emission standards. For example, one ton of methane [CH4] emission is equivalent to 21 tons of carbon dioxide [CO2]. Other greenhouse gases like Nitrous Oxide [N2O], Sulphur hexafluoride [SF6] and Hydroflurocarbons have a much higher impact. Industrial processes have shown that methane, Nitrous oxide and Hydrofluorocarbons are the major greenhouse gases emitted apart from Carbon dioxide. Hence, special importance is given to mitigation of these gases emitted into the atmosphere.
Global Warming Potential [GWP] of each of the seven gases is elicited in Table 1.
2.2 Area of focus
This work focuses on reducing the emissions in paper and sugar plants. Fortunately, gases like Hydroflurocarbons, Perflurocarbons and Sulphur Hexafluoride are not emitted by the plant which has been confirmed during measurements. A substantial amount of Carbon dioxide, Methane and Nitrous Oxide had been released during the industrial process. Release of Methane is significant during usage of Bagasse washing related to pulping while Carbon dioxide release occurs primarily in coal fired boilers and to an extent during calcination reaction in Lime kilns.
Table 1. GWP of greenhouse gases
|
GHG |
Chemical Symbol |
GWP |
|
Carbon dioxide |
CO2 |
1 |
|
Methane |
CH4 |
21 |
|
Nitrous oxide |
N2O |
310 |
|
Hydrofluorocarbons |
HFC-152a |
140 |
|
HFC-134a |
1300 |
|
|
HFC-125 |
2800 |
|
|
HFC-23 |
11700 |
|
|
Perfluorocarbons |
CF4 |
6500 |
|
C2F6 |
9200 |
|
|
Sulphur hexafluoride |
SF6 |
23900 |
|
Nitogen Fluoride |
NF3 |
17300 |
3.1 Design of a Green Information System
A software system has been designed taking into consideration the environmentally responsible business strategies has been designed. It has functions for measuring, monitoring, and performance checking of the various emissions generated by devices employed in the business activities. A Green Information System (GIS) has been designed taking into consideration environment related data in real time. The entire focus of this system in this work is to depict amount of greenhouse gases in Carbon dioxide equivalent values. It has been developed following the measurement during three main phases namely Procure, Use / Operate and Dispose.
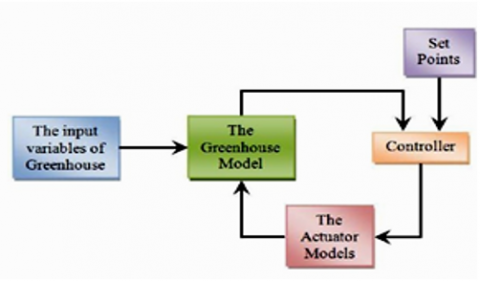
Figure 1. A greenhouse model
A Greenhouse Model has been depicted in Figure 1. Green Enterprise transformation has been carried out through a Chief Green Officer. Green Information System is able to substantiate the green effort of the organization through appropriate metrics and provide a positive feedback to the organization. In this connection, two portals Green Organization Portal (GOP) and Regulatory Standards Portal (RSP) need to be interfaced. This is depicted in Figure 2.
Figure 2. Green information system
3.2 Green organization portal
In this portal, the Organization’s Pollutant performance has been recorded. Various forms of carbon emissions and their equivalent have been taken into consideration. Besides, hazardous materials produced as a result of organizations’ activities have also been listed. To begin with, power generated and purchased from grid have been taken into cognizance. In case of Grid Import, the emission factor (EF) has to be taken into consideration for finding the equivalent GHG emission value. A captive Cogeneration Power plant in Seshasayee Paper and Boards Limited, has been taken up for listing an approach of computing and then effecting reduction in the quantum of generation of greenhouse gases through various mitigating schemes. Emission factor for the Southern Grid had been fixed as 0.82.
GHGEP = GI x EF x 100 (1)
Since emission factor for power export from the plants is 1.25, total power exported can be computed according to the equation:
GHGPE = PE x 1.25 x 100 (2)
The effective Greenhouse gas emissions for the same can be computed as:
GHGP=GHGEP-GHGPE (3)
As coal is the major factor of influence in a boiler, the amount of equivalent Carbon emissions has to be estimated. For this, Carbon content [Cc] in coal and molecular weight of Carbon (MC) and Carbon dioxide (MCO2) are to be taken into consideration. The equivalent emissions have been computed using the formula:
GHGC= CEt x Cc x MCO2 / MC (4)
where, MCO2 = 44 and MC = 12.
A similar computation is being carried out taking furnace oil [FO] into consideration.
GHGFO= CEkl x CFO x MCO2 / MC (5)
where is CFO is Carbon Content in FO.
The next major greenhouse gas taken into consideration is Methane. As seen in section 2.2, one ton of methane emission is equivalent to 21 tons of CO2 emission. Hence a direct multiplication factor of 21 to tons of methane emission will be the carbon dioxide equivalent.
GHGME = ME x 21 (6)
where ME denotes the emission quantity of Methane.
The next factor to be taken into consideration is calcination of make-up limestone in rotary lime kiln. In order to compute the equivalent greenhouse gas emissions for the same, purity and dryness of limestone have to be taken into consideration. The computation is carried out using the formula
GHGLS = Lte x Lp x Ld x MCO2 / MCaO (7)
where, Lte, Lp and Ld depict the quantity, purity and dryness of limestone respectively. MCaO depicts the molecular weight of Calcium Oxide=40.
The total Greenhouse gas emissions can be computed as:
GHGt = GHGP + GHGC + GHGFO + GHGME + GHGLS (8)
All emission related data have been collected in real time and appropriate calculations have been made. Carbon Emission Intensity [EI] is defined as the ratio of total GHG emissions within the plant premises to the finished product.
In the case of Paper and pulp integrated mill,
EI = GHGt / FPP
where, FPP refers to Finished Paper and Pulp produced. This facet is elicited in Sections 5.4 and 6.
3.3 Regulatory standards portal
Care has been taken to ensure that it matches with the portal’s requirement maintained by the government agency applicable for the region. In order to take into account the reduction in overall greenhouse gas emissions, Government has encouraged large units to go in for Science based target [SBT]; each unit shall set its own annual target reduction (a few per cent in specific emissions pet tonne of product produced by the plant). As India being a signatory in Intended Nationally Determined Contribution [INDC] pledging a reduction as high as 30% to 33% by the year 2030 compared to Baseline year of 2005, all the big and polluting industries and plants are expected to develop their own schemes for mitigating GHG emissions on a large scale.
Various pollutant types [Non GHG] notified by Central Government Regulatory Authority [ Ministry of Environment, Forest and Climate Change] with maximum limits set are show-cased through Table 2. Heavy penalty by way of closure of the unit is likely to be imposed whenever the limits are crossed for a sustained period. Relaxation is given in case of Rotary Lime Kilns in Paper plant as compared to Industrial Boilers in Manufacturing plant/Thermal Power stations (Table 2).
3.4 Green IT database
Apart from controlling emissions, special efforts must also be taken to ensure that hazardous materials are not emitted or they are kept to a minimum. As emission of hazardous materials lead to disastrous consequences, a green IT database has been designed to identify polluting equipment, materials, and other assets of the organization. Besides, a relationship is established between assets and corresponding pollutants. Care is taken to ensure that there is no significant increase in GHG emissions over a period of time. This database also has the ability to configure and create various dashboards and pollutant performance reports from data available for pollutants. The hazardous Pollutants identified in the Paper mills include Dioxins and Furans, HCl and heavy metals like Mercury. The presence of these materials depends on the type of fuel being used in boilers.
Table 2. MOEF and CC regulatory act – stack pollutant emission permissible limits
|
Maximum permissible stack emissions |
|||||
|
Stack Pollutant |
Power Plant installed before 2004 |
Power Plant installed before 1st Jan 2017 |
Power Plant installed after 1st Jan 2017 |
Lime Kiln of Paper plant |
Unit |
|
SPM |
100 |
50 |
30 |
- |
mg/Nm3 |
|
SO2 |
600 |
600 |
100 |
400 |
mg/Nm3 |
|
NO2 |
600 |
300 |
100 |
500 |
mg/Nm3 |
|
Hg |
0.03 |
0.03 |
0.03 |
- |
mg/Nm3 |
First of all, a proper Carbon metrics is chosen that measures the total amount of equivalent carbon (Carbon footprint) emitted by the process. Total emissions include both in-house as also that arising outside the mill premises [beyond the Gate-but relating to the raw material coming into and product produce being dispatched]. Enough attention is to be taken to ensure that Scope 1 and Scope 2 [within the plant premises] and Scope 3 [outside the plant boundary] emissions have all been included.
A block diagram indicating the set of steps to be carried out with respect to carbon emissions has been shown in Figure 3. After the measurement is carried out, care must be taken to ensure that the rate of emissions do not keep increasing with passage of time. For ensuring the same, the total amount of emissions have been monitored. Then, a framework has been established for reducing the amount of emissions. Efforts have been taken for mitigating the amount of emissions.
Figure 3. Control process pertaining to Carbon footprint
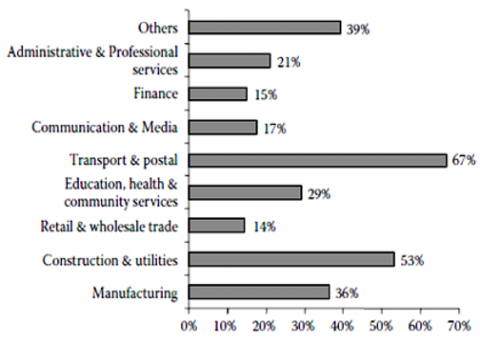
Process reengineering has been carried out. Efforts to ensure compliance with government regulations have also been taken. In order to achieve a high rate of reduction, a detailed study has been carried out for identifying areas where emissions have been maximum. A wide range of industry sectors where emissions occur to various degrees have been identified. The results of the same have been shown in Figure 4. It can be clearly seen that any effort in reducing the amount of transportation would reduce the overall GHG to a very large extent.
As illustrated in the chart shown (Figure 4), it has been clearly shown that efforts in minimizing usage of transport, choosing the right type of transport and in avoiding unnecessary construction of building would go a long way in minimizing the overall emissions. Hence, a larger amount of importance to mitigate the emissions in these areas is illustrated in Section 5.
Scope 1 and Scope 2 relate to emissions mostly within the plant, whereas Scope 3 Emissions encompass all related emissions happening beyond the plant premises. Due importance has to be given to Scope 3 emissions. Waste generated during operations, transportation activities and fuel and energy related activities not included in Scope 1 also have to be taken care of.
Figure 4. Emission monitoring by different sectors
5.1 Webinar
There is a dire need for reducing Carbon Dioxide emissions across the globe. As can be seen from Section 4, transport is one of the major factors involving a huge amount of emissions. Business Travel involves a huge amount of Carbon Emissions. More executives travel and that too over a long distance for attending Business meetings. This involves higher diesel consumption as Air or Car travel is widely chosen. This would relate to increased CO2 emission release to atmosphere. Besides monetary aspects, a large amount of time is also wasted for travel, stay and return. Webinar provides a solution to this problem as can be seen from the illustration.
For topics selected with invited Speakers or specialists or Experts, Date and time slot would be announced globally in advance. Participants shall register for the event. Participation for the event shall be from their place of stay itself with the speaker delivering the presentation from his/her place with central coordination. Being Video/audio meet, participants can participate live. Clarifications/queries shall be attended to then and there. Questions may arise here regarding a higher use of technology. But researches have shown that amount of reduction in equivalent CO2 emissions have far exceeded usage of technology.
It has now become an established practice for specialists to make their presentations through webinar. This in turn shall avoid the participants from travelling all the way from their business location to the place of the meeting/presentation. This would also save valuable time in commuting to and from by the concerned participants to attend the presentations in person. Webinar related to Best Industrial practices related to specific manufacturing industry has been convened by reputed organizations. For a standard case where there are twenty-five local participants and two abroad participants, the amount of savings came roughly to the tune of 27 tons of equivalent CO2 emissions.
It could be clearly seen from Table 3 that emissions are higher when car or air travel is used as opposed to other modes of transport.
Table 3. Relationship between amount of emissions and choice of transport
|
Mode of transport |
CO2 Kg / pass. Km |
Mode of transport |
CO2 Kg / pass. Km |
|
Train |
0.008 |
Bus |
0.015 |
|
Motorcycle |
0.050 |
Car – diesel |
0.132 |
|
Car-Petrol |
0.161 |
Air – short |
0.150 |
|
Air – medium |
0.119 |
Air – long |
0.110 |
|
Air – long [high speed] |
> 0.12 |
|
|
Figure 5. Emission reduction through Logistics Optimization
Figure 5 shows a sample case of emission reduction. Here, imported coal is being transported from Tuticorin port through trucks to the plant. The trucks instead of returning partly empty carrying other goods including personal carry finished pulp from the plant to the other mill located in Tirunelveli Through this novel operation, the Carbon emissions are reduced by around 180 to 200 tons of equivalent CO2 emissions annually.
5.2 Circular economy
Wastes add to Carbon footprint to a large extent. The environment will be saved to a large extent as and when wastes are converted back to resources. Linear economy deals with reduction in waste whereas circular economy deals with conversion of wastes to resources as can be highlighted in Figure 6.
Figure 6. Incorporation of circular economy
5.3 Life cycle assessment
In the earlier sections, methods have been formulated for reducing the environmental impact considering the subset of a system. However, enough attention has not been given on the adverse impact of another subsystem owing to the improvements in part of a system. For instance, savings in transport due to webinars lead to an increase in CO2 emissions in technology usage. However, since this value is far lesser, webinars are on the increase in modern day world. However, for other improvements in Carbon footage, its impact on other systems needs to be considered. Hence, life cycle assessment is deemed necessary. This assessment involves evaluation of inputs, outputs and also potential environmental impacts of any system considering its entire lifetime.
The lifecycle begins with procurement of raw materials followed by manufacturing process. This in turn can lead to a product. More often than not, the product needs to be transported to a specific destination before its usage. The final wastes are disposed. This disposal is reduced by means of recycling. Hence it is necessary to consider the reduction / increase in emission at each stage starting from procurement of raw materials upto its usage. A reduction of emission at one stage may lead to an increase in another. Hence the overall reduction is deemed necessary. For this purpose, a metric namely TCCO (Total Carbon Cost of Emissions) has been computed. A sample lifecycle of a sugar plant integrating circular economy has been shown in Figure 7.
First, sugarcane is grown in fields using sunlight and effluent water from the mill as resource. The harvested sugarcane is transported to the nearby sugar mill. Then milling of sugarcane is carried out to extract the sugarcane juice with waste bagasse. Instead of throwing away the bagasse and adding to e-waste, it in turn is sent to Cogeneration plant wherein high pressure steam is generated in the boiler. This steam is sent to steam turbine for generating electrical power. This power is referred to as Green energy as it is produced from biomass (bagasse) as fuel. Besides, low pressure steam is being generated for use in sugar processing. Waste effluent is sent for irrigation and the cycle continues. The chief underlying concept behind is one of conversion of waste to high value resource. This reference is an ideal case study clearly highlighting Circular economy integrated with life-cycle of the highest order.
Another major improvement involves mechanisms in recovering heat from flue gases escaping through the chimney to the atmosphere. Through usage of suitable heat exchangers, heat can be recovered from these gases emitted as wastage.
Figure 7. Lifecycle of a sugar plant integrating circular economy
5.4 Green values
Four types of Green Values have been computed namely the Green Utility Value, Green Exchange Value, Green Essential Value and Green Longevity Value have been taken into consideration. As can be seen, there is a huge urgent demand in reducing pollution not only in India but across the globe. Based on the initiatives taken, a 25% reduction in equivalent CO2 emissions have been achieved as a result of green initiatives. The level of reduction decides the utility value. As the need is on a global basis, the green exchange value is found to be high. As the environment deals with common inhabitants leading day to day lives, any improvement results in a green social value. One of the modern improvements adopted across the globe deal with organic farming. The designed green information system provides the organization with the ability to sustain itself for a long time thereby providing a green longevity value.
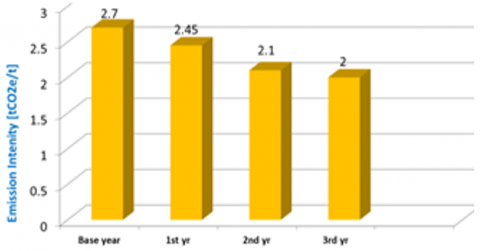
Plant studies have been carried out for identifying the rate of change in generation/reduction of emissions over a distinct period of time-period. This has been illustrated in Figure 8. It has been observed that there is a 25% reduction in emission of equivalent Carbon over a three-year period [22].
Figure 8. Emission Intensity reduction
The designed system is able to continuously identify and upgrade business process based on the amount of emissions. The system has taken into consideration not only scope 1 but also scope 2 and scope 3 emissions thereby not only providing an improvement for the plant taken into consideration but also for overall global needs. The chief advantage obtained in this system is that it takes into consideration emission related data in real time. Apart from Carbon dioxide, the emission of other greenhouse gases and effects of negligible hazardous pollutants have also been taken into consideration in this work.
The organization has been able to improve its performance by reducing emissions by means of innovative techniques like webinar and circular economy thereby providing the feature of Green Sustainability. Apart from reducing the Carbon footprint, the plant is also able to see a significant improvement in savings and thereby the overall profit. Besides, an increase in usage of renewable energy sources has led to a huge reduction in greenhouse gas emissions.
It has been observed that the plant has made huge leaps and bounds in adopting a green approach in manufacture of paper and pulp. However, the major problem is sustaining the same for a long period of time. With passage of time, there is a tendency for Greenwashing. Care should be taken to ensure that Greenwashing is avoided under any circumstance.
As data on solar panel relating to etching is not available on hand, Nitrogen Trifluoride has not been taken into consideration. Monitoring the exact amount of emissions from time to time is a cumbersome process. Besides, the measuring instrument may also add to some emissions which need to be taken into consideration. Apart from that, complete and comprehensive footprint of plant encompassing scope 3 emissions need to be taken into account. Additional rules and regulations could be formulated at a global level to address the inadequacies.
[1] Mcdonald, B.C., Dube, E., Bezuidenhout, C.N. (2008). Transwarm: A sugarcane transport simulation model based on behavioral logistics. Proceedings S African Sugar Technological Association, 81: 434- 443.
[2] Li, Y., Waterson, B.J., McDonald, M. (2009). Collection and use of environmental data for transport management: A view from local authorities. IET Intelligent Transport Systems, 3(1): 95-101. https://doi.org/10.1049/iet-its:20070057
[3] Leonhard, W., Murray, C. (2009). Green Home Computing for Dummies, Wiley Publishing Inc.
[4] Unhelkar, B. (2011). Green IT Strategies and Applications Using Environmental Intelligence, CRC Press, Taylor and Francis Group. https://doi.org/10.1201/b10981
[5] Martin, E.W., Shaheen, S.A. (2011). Greenhouse gas emission impacts of car sharing in North America. IEEE Transactions on Intelligent Transportation Systems, 12(4): 1074-1086. https://doi.org/10.1109/tits.2011.2158539
[6] Krishna Anand, S., Sundara Raman, T.G., Subramanian, S. (2011). Implementation of a Type 2 fuzzy rule based expert system using C-Means Clustering with Particle Swarm Optimization for improving performance in Boilers. International Journal of Advanced Engineering Technology, 2(3): 124-129.
[7] Psaraki, V., Pagoni, I., Schafer, A. (2012). Techno-economic assessment of the potential of intelligent transport systems to reduce CO2 emissions. IET Intelligent Transport Systems, 6(4): 355-363. https://doi.org/10.1049/iet-its.2012.0056
[8] Krishna Anand, S., Sundara Raman, T.G., Subramanian, S. (2012). Designing a Type 2 Fuzzy Neural Network for performance optimization in a high pressure chemical recovery boiler. Journal of Analysis and Computation, Serial Publications, 8(2): 59-69.
[9] Krishna Anand, S., Sundara Raman, T.G., Subramanian, S. (2014). Implementing a neurofuzzy expert system for optimizing the performance of a chemical recovery boiler. International Journal of Artificial Intelligence and Soft Computing (IJAISC), 4(2/3). https://doi.org/10.1504/ijaisc.2014.062822
[10] Krishna Anand, S., Priya, V., Sagambari, S., Devi, G. (2015). Assessing impact of climate change through design of a fuzzy expert system. ARPN Journal of Engineering and Applied Sciences, 10(1): 193-201.
[11] Ragnauth, S.A., Creason, J., Alsalam, J., Ohrel, S., Petrusa, J.E., Beach, R.H. (2015). Global mitigation of non-CO2 greenhouse gases: Marginal abatement costs curves and abatement potential through 2030. Journal of Integrative Environmental Sciences, 12(1): 155-168. https://doi.org/10.1080/1943815x.2015.1110182
[12] Mahmod, M., Jonkers, E., Klunder, G.A., Benz, T., Winde, A. (2015). Amitran methodology framework for evaluating the impact of information and communication Technology based measures on CO2 emissions in the transport field. IET Intelligent Transport Systems, 9(4): 418-428. https://doi.org/10.1049/iet-its.2014.0058
[13] Abhinav, S.V., Anand, S.K. (2015). Effective management of bus transportation through design of a fuzzy expert system. ARPN Journal of Engineering and Applied Sciences, 10(6).
[14] Orozco, O.A., Llano, G. (2016). Optimal speed advisory: A vehicular networks application focused on decreasing CO2 emissions. IEEE Latin America Transactions, 14(6): 2693-2699. https://doi.org/10.1109/tla.2016.7555240
[15] Andrae, A.S.G., Hu, L., Liu, L., Spear, J., Rubel, K. (2017). Delivering tangible carbon emission and cost reduction through the ICT supply chain. International Journal of Green Technology, 3: 1-10. https://doi.org/10.30634/2414-2077.2017.03.1
[16] Loeb, R., Sorin, M., Le Lostec, B. (2017). Hybrid compression-absorption chiller driven by low temperature waste heat: Modelling and analysis. International Journal of Green Technology, 3: 11-22. https://doi.org/10.30634/2414-2077.2017.03.2
[17] Gillingham, K., Stock, J.H. (2018). The cost of reducing greenhouse gas emissions. Journal of Economic Perspectives, 32(4): 53-72. https://doi.org/10.1257/jep.32.4.53
[18] Sundara Raman, T.G. (2018). Emerging best energy practices in Seshasayee paper related to cross-sector application. 2nd National Workshop for promoting Energy Efficient and Cleaner Production for sustainable Industrial Growth - BEE/IIP/KEP, New Delhi.
[19] Sundara Raman, T.G. (2019). Stack Emissions -Source, Statutory norms, Formation and Mitigation schemes. CII webinar Programme on Pulp and Paper Sector.
[20] Budihal, R.S., Anand, S.K. (2019). Constructing an appropriate Neural Network for maximizing Sugarcane yield in a particular region. Australian Journal of Wireless Technologies, Mobility and Security, 1(1): 48-55. https://doi.org/10.21276/ausjournal.2019.1.1.4
[21] Lan, C.F. (2019). A coordination contract for green agricultural product supply chain with stochastic output. Journal Européen des Systèmes Automatisés, 52(4): 347-354. https://doi.org/10.18280/jesa.520403
[22] Anand, K., Mamatha, E., Reddy, C.S., Prabha, M. (2019). Design of neural network based expert system for automated lime kiln system. Journal Européen des Systèmes Automatisés, 52(4): 369-376. https://doi.org/10.18280/jesa.520406