Subrota Kumar Saha | Md. Yousuf Gazi* | Mahir Tajwar | Suzal Kumar
© 2021 IIETA. This article is published by IIETA and is licensed under the CC BY 4.0 license (http://creativecommons.org/licenses/by/4.0/).
OPEN ACCESS
Coal mining areas in Bangladesh are exposing to extreme environmental problems due to the mobilization of heavy metals in the surrounding region. To assess the persisting risk, several soil samples were collected from the nearby coal mine areas. The amount of pollution of heavy metal has been calculated to determine the extent of the contamination. Soil contamination assessment was carried out using pollution evaluation indices such as heavy metal pollution index (HPI), the degree of contamination (Cd), and the contamination factor (CF). The concentration of S, As, Ba and, F exceeded the maximum concentration level in some soil samples. The HPI and the Cd yield similar results. The CF shows strong similarities with the Cd and gives a better evaluation of pollution levels. HPI indicates that about 71.42% of samples exceed the high level. Cd and CF show that about 71.42% sample is highly contaminated by trace element and 14.28% sample is highly contaminated by S, Cl, and F. Based on radioactive element analysis about 14.28% samples show medium contamination level. The findings of this research help us to assess the level of soil contamination and the extent of environmental and health concerns in the region of the Barapukuria coal mine.
soil contamination, geochemistry, trace elements, Barapukuria, coal mine, Bangladesh
Acid mine drainage (AMD), which is globally a serious environmental issue, often occurs in various coal mining sites of the world. Coal mine discharge can cause ecological problems once in contact with the topsoil of the surrounding area of the mine since it is acidic and contains a high level of metals and metalloids. Acid drainage from coal mining has a serious impact on the environment. It mainly occurred from sulfide-bearing minerals, such as pyrite or pyrrhotite when these minerals are exposed to oxygen or water produce sulfuric acid [1]. When acid drainage discharge into the stream or other any water body creates an adverse impact on aquatic life [2]. Studies have been done to concentrate on the effects of the geochemical characteristics of toxic metallic discharges from coal mines in soil and atmosphere [3-5]. Contaminated sediments can act as a source of toxic discharges responsible for environmental changes [6-9]. The presence of heavy metal concentration usually decreases the production of agricultural land. From the dissolution and leaching of country-rock due to low level of pH, aquatic life and surrounding region are highly affected [10].
In various regions of Bangladesh, the amount of discharge from the mine on the soil is above the safe limit based on several studies [11-14]. The quality and safety of human food may be affected due to the high discharge of heavy metals from the coal mine to the surrounding soil [15, 16]. Several kinds of research have been done to indicate heavy metal pollution in plants, trees, soil, and subsoil, and plants in different regions being related to mining works [17-22]. Multiple pieces of research represent pollution related to the detection of heavy metal in the surrounding agricultural soils and absorption by plants in Bangladesh [23, 24].
Barapukuria coal mine, discovered in 1985 by GSB in Dinajpur district, is the largest coalfield of Bangladesh. Coal layers were encountered at a shallow depth of about 118 to 500m in this field. All the previous investigations were mainly centered on the type, quality, mining method, reserve, and study of feasibility in the coalfield. But trace metals from coal and its bounding rocks leach into the mine stream area and discharge around the nearby agricultural land. Various environmental problems occur due to the contamination of the heavy metal in soil [25]. Based on the reports of Petrobangla (Bangladesh Petroleum Corporation), one of the most hazardous practices in the world is the coal mine activity in the Barapukuria and it poses a grave threat to the ecological environment [24]. Destruction of local water resources, air pollution in the air, erosion in soil, declining biodiversity, and land subsidence can be caused by the collapse of coal mines strata [23, 26].
Barapukuria coal mine has the ability to contaminate the soil quality in the area surrounding the mine with its discharge. In this research, low-level analytical methods have been used on clean samples to measure the number of trace concentrations of heavy metal constituents. The main goals were to evaluate the potential for concentration risk assessment and to assess the connection between the coal deposits and the chemistry of the soil. This study has therefore been carried out to identify and interpret the extent of metal contamination in surrounding soil and its spatial abundance in the vicinity of the Barapukuria coal mine of Bangladesh.
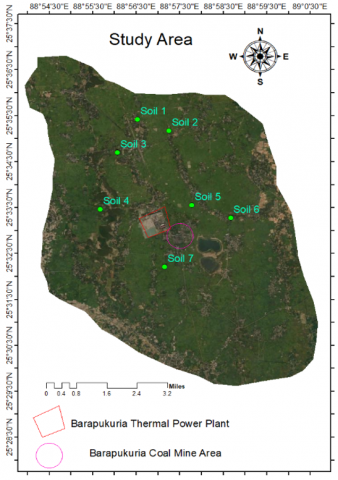
The Barapukuria coal mining area, which lies between latitudes 25031´ to 25°35´N and longitudes 88°57´E to 88°59´E, is located close to the Barapukuria village of Hamidpur union council under Parbotipur Thana of the Dinajpur district (Figure 1). The project area lies between latitudes 25031´ to 25°35´N and longitudes 88°57´E to 88°59´E, included in the survey of Bangladesh topographic sheet No.78C/4. Borehole data of this area shows that sedimentary rocks of Permian to Pleistocene age overlies on the Archean Basement complex. Based on tectonics, the Barapukuria basin is situated in the Rangpur saddle of the Indian platform which acts as the connecting block between the Shillong massif in the east and Rajmahal hill and the Indian Shield in the west. The synclinal structure of the Barapukuria is asymmetrical with a length of 64km spreading along the N-S direction. The general axis of strike N10W respectively is and cut by faults. The main drainage system of the study area includes Atrai, Little Jamuna, Karatoa, Bandali. All the rivers originate from the Himalayas in the north and flow towards the south and southeast. A few small rivers have cut across the Pleistocene Barind Tract towards the south, while the others flow along the eastern and western margins of the upland [27].
Figure 1. Sampling locations of the study area
The Barapukuria underground coal mine is operated by Barapukuria Coal Mining Co. Ltd. (BCMCL). It is an independent Gondwana coal-bearing basin that is independent and is controlled by half-fault Graben. The strata can be separated into four units depending on drilling information namely the Basement complex, Gondwana group, Dupi Tila Formation, and Barind Clay [28, 29].
The coalmining region consists of 11 coal-bearing seams in seven groups. It has a total thickness of 74.14 meters where the mean thickness of Seam-6 ranges from 29.4 to 36.41m. It is the main mineable bed which has an area of around 1 to 1.5 km. It is about 4.9km in the direction of the northeast and belongs to the regular and extra-thick coal seam of the coalfield.
From the mine region, seven soil samples were collected of which four samples were gathered from a distant area from the mine whereas the rest of the three samples were collected from an area close to the mine. The seven samples, which were named S-1, S-2, S-3, S-4, S-5, S-6, and S-7, had been collected with a grab sampler and kept in a sample bag (polyethylene bag). At each sampling site, surface sediment was collected at a depth of 15-20cm and approximately 1kg of each of the samples was collected. Each of the locations from where samples were taken, were detected using GPS (Garmin GPS 72H). All samples were stored in the laboratory in a dry condition and moderate temperature. Two kinds of samples were collected to determine the horizontal distribution of heavy metals and variation in the concentration of trace metals with distance.
The elements detected by following the proper measures using Rigaku ZSX Primus equipped with an end window 4kW Rh-anode X-ray tube elements were identified using X-ray fluorescence (XRF) in the Institute of Mining, Mineralogy, and Metallurgy, Bangladesh Council of Scientific and Industrial Research (BCSIR), Joypurhat. For calibration, the Standard Samples Japanese Stream Sediments (JSD) had been used. The heavy elements from the soil had been detected using crystal LiF1 at a 40kV voltage with 60mA current. The elements Ca and K were identified in 40kV and 60mA current with crystal LiF1. Mg, Na and F were identified in 30kV and 100mA current with crystal RX25. Cl, S, and P were determined in 30kV and 100mA current with crystal GE. Si and Al were detected in 30kV and 100mA current with crystal PET.
Three principal Pollution evaluation methods were followed in this research: Heavy metal pollution index (HPI) proposed by [30], Contamination index (Cd) developed by [31], and Contamination factor (CF) put forward by [32].
The Heavy metal pollution index (HPI) represents the whole quality of water concerning heavy metals. The rating system is an arbitrary value between zero to one, the selection of which relies on the significance of individual quality considerations in a comparative way or it can be assessed by making values inversely proportional to the recommended standard for the corresponding parameter [33, 34]. Prasad and Bose (2001) [30] considered unit weightage (Wi) has been considered as a value inversely proportional to measure the HPI.
The HPI model is given by Mohan et al. (1996) [34]:
$\mathrm{HPI}=\frac{\sum_{i=1}^{n} W_{i} Q_{i}}{\sum_{i=1}^{n} W_{i}}$
where, Qi is the sub-index of the ith parameter; Wi is the unit weight of the ith parameter; n is the number of parameters considered.
The sub-index Qi of the parameter is measured by:
$\mathrm{Q}_{\mathrm{i}}=\sum_{i=1}^{n} \frac{\left\{M_{i}-I_{i}\right\}}{\left(S_{i}-I_{i}\right)} \times 100$
where, Mi is the monitored value of the heavy metal of ith parameter; Ii is the ideal value of the ith parameter; Si is the standard value of the ith parameter.
Thus, the Cd summarizes the combined effects of several quality parameters considered harmful to agricultural soil. The contamination index is measured from the equation below:
$\mathrm{C}_{\mathrm{d}}=\sum_{i=1}^{n} C_{f i}$
where,
Cfi = $\frac{C_{A i}}{C_{N i}}$-1,
Cfi= contamination factor for the i-th component.
CAi=analytical value for the i-th component,
CNi=upper permissible concentration of the i-th component (N denotes the 'normative value').
The elements and ionic species have not been considered with analytical values below the upper permissible concentration value. Since the concentration of heavy metals below this limit does not pose any hazardous problem to the quality of the soil. Based on a scale ranging from 1 to 3, the resultant Cd value detects areas of varying contamination levels which are grouped into three categories.
Cd <1 --- Low
Cd =1-3 --- Medium
Cd>3 --- High
The upper permissible concentration value (CNi) was taken as the maximum admissible concentration (MAC). The proposed CF is the ratio obtained by dividing the concentration of each metal in the soil by the baseline or background value:
CF=∑ C_(heavy metal or other elements)/C_background
(Cheavy metal or other elements/ Cbackground)
Cheavy metal or other metal and Cbackground are the monitored value and maximum admissible concentration (MAC) of the parameters. The contamination levels may be classified on a scale ranging from 1to 6 [32].
CF<1---Low
CF=1 to 3---Medium
CF>3 to 5---Strong
CF>5---Very strong
For the samples, correlation analysis was carried out to access the association between the total heavy metals and major soil variables as well as the levels of heavy metals and the proportion of the total concentration. To verify the orders of removal of trace metals-the removal ratio of the trace metals was calculated and presented graphically. The removing ratio of the trace metals was calculated as follows:
Removing ratio (Rk)=(Concentration of metal in nth soil sample)/(concentration of a metal in sample-1).
Chemical parameters of the studied area have been classified into four groups which are: Trace or heavy metals, Radioactive elements, oxides, and other elements that in excess amounts are harmful to the soil. The overall amount of discharge in the soils of mine and the surrounding area were measured to detect the extent of the contamination. The concentrations of S in Soil-1, As in Soil-1, 3, 4, 5, 6, and 7, Ba in Soil-1, 2, 4, and 7, and F in Soil-1, 2, 3, 4, 5, and 7 exceed the maximum concentration level. The concentration of Cu, Th, Sn, and Sn in Soil-1 is nearest to the ideal value and the concentration of S in Soil-2, 3, and 5 is nearest to the ideal value and the concentration of F in Soil-6 is nearest to the ideal valve (Tables 1, 2, 3).
4.1 Contamination factor (CF)
The calculated contamination factor (CF) has been applied for a better understanding of soil pollution. The CF value for trace element was from 5.3 to 2.6 with a mean value of 3.61 that indicates the contamination level is strong and the CF value for radioactive element ranged from 1.46 to 0.51 with a mean value of 0.78 that indicates the contamination level is low and the CF value for other elements (S, Cl, F) ranged from 15.44 to 1.49 with mean value 3.95 that indicate the contamination level is strong. Based on trace element analysis about 14.28% sample shows a very strong contamination level, about 57.12% sample shows a strong contamination level, and 28.56% sample shows a medium contamination level. Based on Radioactive element analysis about 14.28% shows a medium-strong contamination level and about 85.68% sample shows a low contamination level. Based on other elements (S, Cl, and F) analysis about 14.28% sample shows a very strong contamination level, and 85.68% sample shows a medium contamination level. The value of the contamination factor also shows that the contamination level decrease with increasing distance. The contamination level is higher for trace elements and S, Cl, F than radioactive elements (Tables 4, 5).
Table 1. Summary of trace, radioactive, and other harmful elements of the soil sample
|
Trace element (mg/kg) |
|||||||
|
|
S1 |
S2 |
S3 |
S4 |
S5 |
S6 |
S7 |
|
Ba |
451 |
289 |
258 |
303 |
427 |
244 |
321 |
|
Cu |
85 |
14 |
9 |
10 |
8 |
9 |
13 |
|
Rb |
149 |
107 |
105 |
120 |
170 |
103 |
121 |
|
Sr |
308 |
63 |
57 |
59 |
68 |
58 |
64 |
|
V |
130 |
72 |
65 |
92 |
102 |
69 |
82 |
|
As |
31 |
25 |
28 |
32 |
41 |
32 |
33 |
|
Ni |
146 |
19 |
22 |
17 |
26 |
53 |
71 |
|
Zn |
98 |
72 |
96 |
102 |
86 |
81 |
72 |
|
Co |
16 |
7 |
10 |
7 |
11 |
7 |
8 |
|
Pb |
26 |
2 |
- |
1 |
1 |
- |
- |
|
Zr |
120 |
119 |
120 |
119 |
116 |
119 |
119 |
|
Cd |
4 |
2 |
2 |
1 |
1 |
2 |
2 |
|
Ga |
28 |
19 |
19 |
18 |
18 |
19 |
19 |
|
Se |
9 |
2 |
2 |
1 |
1 |
1 |
2 |
|
Sn |
224 |
157 |
158 |
113 |
93 |
136 |
145 |
|
Radioactive elements (mg/kg) |
|||||||
|
Th |
27 |
8 |
9 |
8 |
7 |
8 |
9 |
|
Hf |
4 |
3 |
3 |
3 |
3 |
3 |
3 |
|
U |
3 |
2 |
2 |
2 |
1 |
2 |
2 |
|
Harmful element (mg/kg) |
|||||||
|
S |
12218 |
645 |
357 |
379 |
726 |
540 |
561 |
|
Cl |
114 |
26 |
25 |
25 |
34 |
37 |
31 |
|
F |
1698 |
1237 |
1344 |
1344 |
732 |
662 |
1294 |
Table 2. Comparison among monitor value, maximum concentration level, and ideal value
|
Trace element (mg/kg) |
S1 |
S2 |
S3 |
S4 |
S5 |
S6 |
S7 |
Max. conc. Level (mg/kg) |
Ideal value (mg/kg) |
|
Ba |
451 |
289 |
258 |
303 |
427 |
244 |
321 |
385 |
280 |
|
Cu |
85 |
14 |
9 |
10 |
8 |
9 |
13 |
125 |
100 |
|
Rb |
149 |
107 |
105 |
120 |
170 |
103 |
121 |
825 |
650 |
|
Sr |
308 |
63 |
57 |
59 |
68 |
58 |
64 |
415 |
370 |
|
V |
130 |
72 |
65 |
92 |
102 |
69 |
82 |
385 |
220 |
|
AS |
31 |
25 |
28 |
32 |
41 |
32 |
33 |
27 |
15 |
|
Ni |
146 |
19 |
22 |
17 |
26 |
53 |
71 |
770 |
550 |
|
Zn |
98 |
72 |
96 |
102 |
86 |
81 |
72 |
545 |
450 |
|
Co |
16 |
7 |
10 |
7 |
11 |
7 |
8 |
200 |
120 |
|
Pb |
26 |
2 |
- |
1 |
1 |
- |
- |
650 |
500 |
|
Zr |
120 |
119 |
120 |
119 |
116 |
119 |
119 |
665 |
500 |
|
Cd |
4 |
2 |
2 |
1 |
1 |
2 |
2 |
810 |
650 |
|
Ga |
28 |
19 |
19 |
18 |
18 |
19 |
19 |
700 |
550 |
|
Se |
9 |
2 |
2 |
1 |
1 |
1 |
2 |
10000 |
9500 |
|
Sn |
224 |
157 |
158 |
113 |
93 |
136 |
145 |
625 |
450 |
|
S |
12218 |
645 |
357 |
379 |
726 |
540 |
561 |
975 |
750 |
|
Cl |
114 |
26 |
25 |
25 |
34 |
37 |
31 |
275 |
250 |
|
F |
1698 |
1237 |
1344 |
1344 |
732 |
662 |
1294 |
675 |
600 |
|
Th |
27 |
8 |
9 |
8 |
7 |
8 |
9 |
30 |
25 |
|
Hf |
4 |
3 |
3 |
3 |
3 |
3 |
3 |
15 |
10 |
|
U |
3 |
2 |
2 |
2 |
1 |
2 |
2 |
10 |
5 |
(Source: U.S National Environmental Quality Act 2004)
(*Bold number indicates that value which exceeds both Ideal value and maximum Concentration level; ** Italic number indicates that value which exceeds Ideal value and nearest to Ideal Value).
Table 3. Contamination Factor for trace element
|
Sample ID |
C heavy metal/C background |
CF |
||||||||||||||
|
Ba |
Cu |
Rb |
Sr |
V |
As |
Ni |
Zn |
Co |
Pb |
Zr |
Cd |
Ga |
Se |
Sn |
||
|
Soil-1 |
1.18 |
0.68 |
0.18 |
0.74 |
0.34 |
1.14 |
0.19 |
0.18 |
0.08 |
0.04 |
0.18 |
0.004 |
0.04 |
0.0009 |
0.36 |
5.3 |
|
Soil-2 |
0.76 |
0.11 |
0.13 |
0.25 |
0.17 |
0.92 |
0.02 |
0.35 |
0.03 |
0.003 |
0.11 |
0.24 |
0.036 |
0.0002 |
0.25 |
3.37 |
|
Soil-3 |
0.67 |
0.07 |
0.12 |
0.13 |
0.15 |
1.03 |
0.02 |
0.36 |
0.05 |
- |
0.15 |
0.24 |
0.034 |
0.0002 |
0.25 |
3.27 |
|
Soil-4 |
0.59 |
0.08 |
0.14 |
0.14 |
0.22 |
1.18 |
0.02 |
0.39 |
0.038 |
0.001 |
0.11 |
0.0012 |
0.034 |
0.0001 |
0.18 |
3.12 |
|
Soil-5 |
1.12 |
0.064 |
0.20 |
0.16 |
0.24 |
1.51 |
0.03 |
0.41 |
0.06 |
- |
0.12 |
0.0012 |
0.034 |
0.0001 |
0.15 |
4.09 |
|
Soil-6 |
0.44 |
0.072 |
0.12 |
0.13 |
0.16 |
1.08 |
0.07 |
0.29 |
0.038 |
- |
0.11 |
0.24 |
0.032 |
0.0001 |
0.11 |
2.8 |
|
Soil-7 |
0.43 |
0.10 |
0.14 |
0.15 |
0.09 |
1.12. |
0.09 |
0.009 |
0.05 |
- |
0.117 |
0.24 |
0.032 |
0.0002 |
0.23 |
2.7 |
Table 4. Contamination Factor for Radioactive element
|
Sample ID |
Cradio active metal/Cback ground |
CF |
||
|
Th |
Hf |
U |
||
|
Soil-1 |
0.9 |
0.26 |
0.3 |
1.46 |
|
Soil-2 |
0.26 |
0.24 |
0.22 |
0.72 |
|
Soil-3 |
0.3 |
0.20 |
0.20 |
0.7 |
|
Soil-4 |
0.25 |
0.23 |
0.21 |
0.69 |
|
Soil-5 |
0.26 |
0.25 |
0.13 |
0.74 |
|
Soil-6 |
0.24 |
0.21 |
0.23 |
0.68 |
|
Soil- 7 |
0.21 |
0.18 |
0.12 |
0.51 |
Table 5. Contamination Factor for other (S, Cl, F) elements
|
Sample ID |
Celement/Cback ground |
CF |
||
|
S |
Cl |
F |
||
|
Soil-1 |
12.53 |
0.41 |
2.50 |
15.44 |
|
Soil-2 |
0.66 |
0.091 |
1.83 |
2.58 |
|
Soil-3 |
0.366 |
0.090 |
1.99 |
2.44 |
|
Soil-4 |
0.388 |
0.090 |
1.66 |
2.13 |
|
Soil-5 |
0.744 |
0.123 |
1.08 |
1.94 |
|
Soil-6 |
0.553 |
0.134 |
0.98 |
1.66 |
|
Soil-7 |
0.37 |
0.112 |
1.01 |
1.49 |
4.2 Contamination degree (Cd)
The extent of contamination (Cd) had been applied as a method of reference for assessing the extent of the contamination. Cd may be classified into three categories based on a scale ranging from 1 to 3 [31, 35] as follows: Low (Cd<1); Medium (Cd=1-3); High (Cd>3). The Cd value for trace element ranged from 9.8 to 2.63 with a mean value of 4.32 and the Cd value for radioactive element ranged from 1.56 to 0.51 with a mean value of 0.88 and the Cd value for other elements (S, Cl, and F) ranged from 13.62 to 1.15 with a mean value 3.63. Based on trace element analysis about 71.42% sample shows a high degree of contamination and 28.57% sample shows a medium degree of contamination. Based on Radioactive element analysis about 14.28% shows a medium degree of contamination and about 85.68% sample shows a low degree of contamination. Based on other elements (S, Cl, and F) analysis about 14.28% sample shows a high degree of contamination, and 85.68% sample shows a medium degree of contamination (Tables 6, 7, 8).
4.3 Heavy metal pollution index (HPI)
The HPI values of trace elements ranged from 146.37 to 70.07 with a mean value of 111.14 that indicates a high level of contamination. Based on trace element analysis about 71.42% of samples show high contamination and about 28.57% of samples show high medium contamination. Soil-1 shows the highest value of HPI which is close to mine drainage and Soil-7 shows the lowest value of HPI which is farther than other samples. As Cd and CF, the values of HPI also decreases with increasing distance. Soil-1, Soil-2, Soil-3, Soil-4, and Soil-5 shows high contamination; Soil-6 and Soil-7 show medium contamination. The heavy metal pollution index has computed using the ideal value of the parameter and the standard value of the parameter and the Wi was taken as the inverse of the maximum concentration level. The values of HPI in the present study have classified values in terms of pollution levels as low, medium, and high (Tables 9, 10).
Table 6. The Contamination index for trace elements.
|
Sample ID |
Cfi |
Cd |
||||||||||||||
|
Ba |
Cu |
Rb |
Sr |
V |
As |
Ni |
Zn |
Co |
Pb |
Zr |
Cd |
Ga |
Se |
Sn |
||
|
Soil-1 |
0.18 |
0.32 |
0.82 |
0.26 |
0.69 |
0.14 |
0.81 |
0.82 |
0.912 |
0.96 |
0.82 |
0.99 |
0.46 |
0.99 |
0.64 |
9.8 |
|
Soil-2 |
0.24 |
0.48 |
0.57 |
0.35 |
0.42 |
0.05 |
0.37 |
0.24 |
0.36 |
0.39 |
0.34 |
0.25 |
0.24 |
0.23 |
0.36 |
4.86 |
|
Soil-3 |
0.33 |
0.32 |
0.47 |
0.36 |
0.34 |
0.03 |
0.27 |
0.24 |
0.2 |
- |
0.01 |
0.25 |
0.24 |
0.23 |
0.24 |
3.53 |
|
Soil-4 |
0.21 |
0.22 |
0.35 |
0.25 |
0.28 |
0.18 |
0.11 |
0.21 |
0.12 |
0.39 |
0.34 |
0.11 |
0.34 |
0.18 |
0.1 |
3.39 |
|
Soil-5 |
0.42 |
0.33 |
0.20 |
0.23 |
0.20 |
0.51 |
0.26 |
0.38 |
0.33 |
- |
0.28 |
0.11 |
0.34 |
0.18 |
0.15 |
3.92 |
|
Soil-6 |
0.16 |
0.22 |
0.17 |
0.16 |
0.23 |
0.18 |
0.23 |
0.21 |
0.16 |
- |
0.34 |
0.25 |
0.24 |
0.18 |
0.15 |
2.88 |
|
Soil-7 |
0.15 |
0.11 |
0.15 |
0.14 |
0.203 |
0.18 |
0.20 |
0.14 |
0.16 |
- |
0.34 |
0.25 |
0.24 |
0.23 |
0.12 |
2.61 |
Table 7. The degree of Contamination for Radioactive element
|
Sample ID |
Cfi |
Cd
|
||
|
Th |
Hf |
U |
||
|
Soil-1 |
0.1 |
0.74 |
0.72 |
1.56 |
|
Soil-2 |
0.34 |
0.28 |
0.30 |
0.92 |
|
Soil-3 |
0.40 |
0.18 |
0.28 |
0.86 |
|
Soil-4 |
0.34 |
0.15 |
0.23 |
0.72 |
|
Soil-5 |
0.44 |
0.28 |
0.25 |
0.97 |
|
Soil-6 |
0.27 |
0.18 |
0.20 |
0.65 |
|
Soil-7 |
0.17 |
0.15 |
0.19 |
0.51 |
Table 8. The degree of Contamination for other (S, Cl, and F) elements
|
Sample ID |
Cfi |
Cd |
||
|
S |
Cl |
F |
||
|
Soil-1 |
11.53 |
0.59 |
1.50 |
13.62 |
|
Soil-2 |
0.83 |
0.90 |
0.93 |
2.66 |
|
Soil-3 |
0.63 |
0.75 |
0.87 |
2.25 |
|
Soil-4 |
0.61 |
0.72 |
0.66 |
1.99 |
|
Soil-5 |
0.85 |
0.87 |
0.86 |
2.58 |
|
Soil-6 |
0.44 |
0.62 |
0.15 |
1.21 |
|
Soil-7 |
0.43 |
0.61 |
0.11 |
1.15 |
Table 9. The value of Qi for various trace elements.
|
Sample ID |
Qi |
|
|
|
|
|
|
|
|||||||
|
Ba |
Cu |
Rb |
Sr |
V |
As |
Ni |
Zn |
Co |
Pb |
Zr |
Cd |
Ga |
Se |
Sn |
|
|
Soil-1 |
160 |
60 |
280.99 |
137.5 |
56.52 |
133.24 |
24031 |
366.12 |
64 |
313.33 |
246.66 |
398.37 |
342.85 |
1800 |
125 |
|
Soil-2 |
80 |
93.75 |
305.7 |
595.83 |
86.95 |
91.89 |
217.05 |
393.44 |
140 |
326.66 |
120 |
105.69 |
71.42 |
750 |
118.7 |
|
Soil-3 |
72 |
81.25 |
289.25 |
558.33 |
86.95 |
81.35 |
106.50 |
377.04 |
130 |
- |
126.66 |
105.69 |
71.42 |
750 |
143.75 |
|
Soil-4 |
60 |
68.75 |
256.19 |
462.5 |
65.21 |
78.10 |
88.75 |
355.19 |
126 |
266.66 |
120 |
235.77 |
178.57 |
400 |
112.5 |
|
Soil-5 |
80 |
75 |
272.72 |
520.83 |
56.52 |
79.72 |
112.42 |
366.12 |
120 |
380 |
253.33 |
235.77 |
178.57 |
400 |
156.25 |
|
Soil-6 |
40 |
41.25 |
99.17 |
341.66 |
39.13 |
47.29 |
93.02 |
191.25 |
130 |
- |
120 |
105.69 |
71.42 |
400 |
68.75 |
|
Soil-7 |
56 |
46.25 |
157.02 |
354.16 |
43.4 |
48.37 |
47.33 |
136.61 |
88.0 |
- |
120 |
105.69 |
71.42 |
750 |
87.5 |
Table 10. HPI values for trace elements.
|
Sample ID |
WiQi |
$\frac{\sum_{i=1}^{n} W_{i} Q_{i}}{\sum_{i=1}^{n} W_{i}}$ |
HPI |
||||||||||||||
|
Ba |
Cu |
Rb |
Sr |
V |
As |
Ni |
Zn |
Co |
Pb |
Zr |
Cd |
Ga |
Se |
Sn |
|||
|
Soil-1 |
0.40 |
0.48 |
0.34 |
0.33 |
0.13 |
4.93 |
0.31 |
0.67 |
0.32 |
0.47 |
0.37 |
0.49 |
0.48 |
0.18 |
0.20 |
10.1 |
146.37 |
|
Soil-2 |
0.22 |
0.75 |
0.37 |
1.43 |
0.20 |
3.4 |
0.28 |
0.72 |
0.70 |
0.49 |
0.19 |
0.13 |
0.10 |
0.075 |
0.19 |
9.23 |
133.84 |
|
Soil-3 |
0.18 |
0.65 |
0.35 |
1.34 |
0.22 |
3.01 |
0.18 |
0.69 |
0.65 |
- |
0.19 |
0.13 |
0.10 |
0.075 |
0.23 |
7.99 |
115.86 |
|
Soil-4 |
0.15 |
0.55 |
0.31 |
1.11 |
0.15 |
2.89 |
0.15 |
0.65 |
0.63 |
0.40 |
0.18 |
0.29 |
0.25 |
0.04 |
0.18 |
7.93 |
114.92 |
|
Soil-5 |
0.20 |
0.60 |
0.33 |
1.25 |
0.13 |
2.95 |
0.19 |
0.67 |
0.60 |
0.57 |
0.38 |
0.29 |
0.25 |
0.04 |
0.25 |
8.7 |
126.08 |
|
Soil-6 |
0.1 |
0.33 |
0.12 |
0.82 |
0.09 |
1.75 |
0.12 |
0.35 |
0.65 |
- |
0.18 |
0.13 |
0.10 |
0.04 |
0.11 |
4.89 |
70.86 |
|
Soil-7 |
0.14 |
0.37 |
0.19 |
0.85 |
0.1 |
1.79 |
0.08 |
0.25 |
0.44 |
- |
0.18 |
0.13 |
0.10 |
0.075 |
0.14 |
4.83 |
70.07 |
4.4 Classification of the soil based on the pollution indices
In the case of trace element analysis, samples collected from Soil 6 and 7 show a medium level of contamination whereas Soil-1, 2, 3, 4, and 5 represent high Heave Metal Pollution Index. It is evident from samples of Soil 6 and 7 that the Cd is at an average level but it’s quite high for samples from Soil-1, 2, 3, 4, and 5. Based on the values of the Contamination factor, Soil-6 and 7 show a medium degree of contamination, Soil-2, 3, 4,5 show a strong degree of contamination, and Soil sample 1 shows the highest level of contamination.
For Radioactive element analysis, Soil 2, 3, 4, 5, 6, and 7 show a low level of contamination whereas Soil 1 represents medium value for Contamination degree. It is evident from samples of Soil 2 to 7 that pollution extent is quite low based on contamination factor but it’s at a medium level for the sample from Soil 1.
Based on the values of other (S, Cl, and F) element analyses, Soil samples 2, 3, 4, 5, 6, and 7 show an average level of pollution but Soil 1 delineates a high extent of pollution (Cd). The contamination factor value is in the range of very strong for Soil 1 and shows the medium degree of pollution for Soil 2, 3, 4, 5, 6, and 7 (Table 11).
According to the aforementioned data, the contamination level in Soil sample 1 is quite high in comparison to the other soil samples for it being closest to the mine area and the location of metallic discharges. Whereas, the level of toxic metal pollution in the Soil sample 6 and especially 7 is quite low comparatively because of the samples being collected from a distant place from the mine location (Tables 12, Table 13).
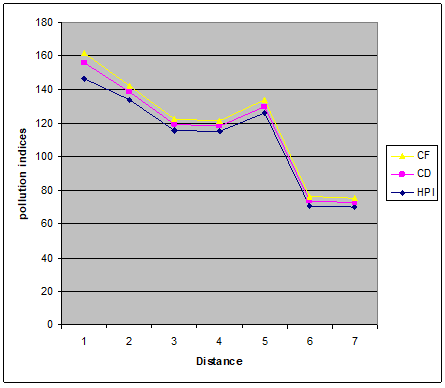
4.5 Graphical presentation of pollution indices
HPI, CF, and Cd suggest that a certain portion of the region is highly polluted and part of the region is medium polluted by trace elements. There are clear similarities among the HPI, Cd, and CF values of the soil samples. The HPI, Cd, and CF show alike trends in numerous sampling areas. Major correlations can be noticed among the reading of the CF, Cd, and HPI for all the samples. Based on the HPI method about 28.58% of the samples fall below the mean value of HPI that indicates better quality of the soil. Soil-1, Soil-2, Soil-3, Soil-4, and Soil-5 are highly contaminated than Soil-6 and Soil-7 by trace element and the contamination level by radioactive element for Soil-1 is higher than Soil-2, 3, 4, 5, 6, and 7 by the other elements (S, Cl, F) is also same. The CF and reclassification schemes of HPI and Cd for trace element shows comparable results and the CF method has used for assessing the quality of the soil (Figures 2, 3, 4, 5, 6, 7).
Table 11. Classification of soil based on the trace element analysis.
|
Index method |
Category |
Degree of pollution |
Samples |
|
HPI
|
<50 |
Low |
------- |
|
50-100 |
Medium |
Soil-6 Soil-7 |
|
|
>100 |
High |
Soil-1, Soil-2, Soil-3, Soil-4, Soil-5. |
|
|
Cd |
<1 |
Low |
------- |
|
1 to3 |
Medium |
Soil-6 Soil-7. |
|
|
>3 |
High |
Soil-1, Soil-2, Soil-3, Soil-4, Soil-5. |
|
|
CF |
<1 |
Low |
------- |
|
1 to3 |
Medium |
Soil-6 Soil-7 |
|
|
3 to 5 |
Strong |
Soil-2, Soil-3, Soil-4, Soil-5 |
|
|
5 to 6 |
Very strong |
Soil-1 |
Table 12. Classification of soil based on the Radioactive element analysis
|
Index method |
Category |
Degree of pollution |
Samples |
|
Cd |
<1 |
Low |
Soil-2 Soil-3 Soil-4 Soil-5 Soil-6 Soil-7 |
|
1 to3 |
Medium |
Soil-1 |
|
|
>3 |
High |
------- |
|
|
CF |
<1 |
Low |
Soil-2 Soil-3 Soil-4 Soil-5 Soil-6 Soil-7 |
|
1 to3 |
Medium |
Soil-1 |
|
|
3 to 5 |
Strong |
-------- |
|
|
5 to6 |
Very strong |
-------- |
Table 13. Classification of soil based on the other (S, Cl, and F) element analysis
|
Index method |
Category |
Degree of pollution |
Samples |
|
Cd |
<1 |
Low |
--------- |
|
1 to3 |
Medium |
Soil-2 Soil-3 Soil-4 Soil-5 Soil-6 Soil-7 |
|
|
>3 |
High |
Soil-1 |
|
|
CF |
<1 |
Low |
-------- |
|
1 to3 |
Medium |
Soil-2 Soil-3 Soil-4 Soil-5 Soil-6 Soil-7 |
|
|
3 to 5 |
Strong |
-------- |
|
|
5 to6 |
Very strong |
Soil-1 |
Figure 2. Spatial distribution of pollution evaluation indices of the soil samples based on Trace element analysis
Figure 3. Spatial distribution of pollution evaluation indices of the soil samples based on Radioactive element
Figure 4. Spatial distribution of pollution evaluation indices of the soil samples based on other (S, Cl, and Fl)
Figure 5. Graphical presentation of decreasing trend for trace element
Figure 6. Graphical presentation of decreasing trend for Radioactive element
Figure 7. Graphical presentation of the decreasing trend for S, Cl, and F
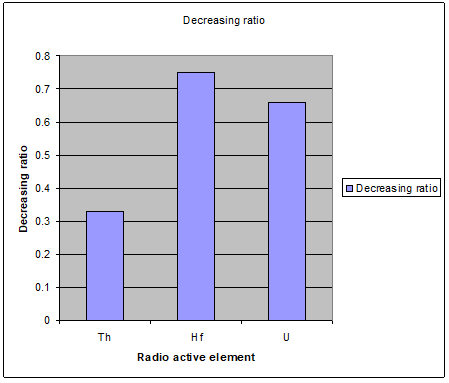
4.6 The decreasing ratio of various elements
Table 14. The decreasing ratio of trace element
|
Trace elements |
Decreasing ratio |
|
Ba |
0.71 |
|
Cu |
0.15 |
|
Rb |
0.81 |
|
Sr |
0.20 |
|
V |
0.63 |
|
Ni |
0.48 |
|
Zn |
0.73 |
|
Co |
0.5 |
|
Pb |
0.038 |
|
Zr |
0.99 |
|
Ga |
0.67 |
|
Se |
0.22 |
|
Cd |
0.5 |
Table 15. The decreasing ratio of Radioactive elements.
|
Radioactive elements |
Decreasing ratio |
|
Th |
0.33 |
|
Hf |
0.75 |
|
U |
0.66 |
Table 16. The decreasing ratio of other elements
|
Other elements |
Decreasing ratio |
|
S |
0.045 |
|
Cl |
0.27 |
|
F |
0.76 |
4.7 Effects of elements on soil
Soil is a vital constituent of the urban and rural ecosystem; moreover, proper management of the land area is the key to ensure the standard of soil. One of the key problems of environmental pollution due to the contamination caused by heavy metals which has raised extensive unease in various parts of the world [36, 37].
Surrounding the coal mining area, from point sources (for example, coal washing wastewater discharge) and the other one being non-point sources (like, acid mine drainage), streams receive a substantial amount of discharge due to the coal mining activities which result in severe ecological issues [38]. Toxic metal accumulation, which occurs as a result of coal mining, causes ubiquity, toxicity, difficult degradation around the stream environment which are close to the mining area and it uncovers the local inhabitants to various health-related concerns [39].
Mining activities, which are related to various fatal diseases, are a chief anthropogenic source of heavy metal contamination [40]. Numerous maladies and diseases like endemic arsenicosis, fluorosis, selenosis, and lung cancer can occur as a result of combustion due to mining activities [41-45]. Soil microbial activities can be hindered and inhibited by mineral excavation, tailings disposals, discharge of wastewater, smelting, refining, transportation, and mineral excavation [46, 47].
Coal mine discharges can accumulate in the crop field and can deposit in high concentrations which can have unfortunate health impacts on humans if the plants and vegetables of those areas are consumed. The accretion of toxic metals in plants and trees relies on the availability and mobility of metals in soil [48]. The exchangeable, soluble, and chelated metal species deposited in the soil are labile amounts exposed to crops, trees, and plants [49].
One grave environmental concern in developing countries, including Bangladesh is the heavy metal contamination in agricultural soil and vegetables which occurs from the irrigation of polluted water (Tables 14, 15, 16). Metals are naturally found in soil at trace level [50], toxic metals are carried by the effluents and discharges from various industries and mining areas to the soils and streams which compromises the secured usage of agricultural soil [51]. Long-term usage of contaminated water for agriculture and irrigation purposes may cause to deposit of toxic metals such as Mn, Pb, Cd, Cr, Ni, Zn, and Cu in surface soil above a specific background level [52].
The amount of Cu, Th, Sn, and Sn in Soil-1 is nearest to the Ideal value, and the concentration of S in Soil-2, 3, and 5 is nearest to the Ideal value and the concentration of F in Soil-6 is nearest to the ideal valve. Soil contamination assessment was carried out using pollution evaluation indices for example the contamination degree (Cd), index of the heavy metal pollution (HPI), and the contamination factor (CF).
Similar results have been found from the outcomes of the heavy metal pollution index (HPI) and the extent of contamination (Cd). Strong similarities have been detected between the contamination factor (CF) and degree of contamination (Cd) which provides us with a better evaluation of the extent of affluence.
The HPI values of trace elements ranged from 146.37 to 70.07 with a mean value of 111.14 that indicates a high level of contamination. Based on trace element analysis about 71.42% of samples show high contamination and about 28.57% of samples show high medium contamination Soil-1 shows the highest value of HPI which is close to mine drainage and Soil-7 shows the lowest value of HPI which is farther than other samples. The values of HPI also decrease with increasing distance. Soil-1, 2, 3, 4, and 5 show high contamination whereas Soil-6, 7 shows a medium level of contamination.
The CF value for trace element range from 5.3 to 2.6 with an average value of 3.61 that indicates the contamination level to be strong and the CF value for radioactive element ranged from 1.46 to 0.51 with a mean value 0.78 that shows low contamination level and the CF value for other elements (S, Cl, F) ranged from 15.44 to 1.49 with a mean value 3.95 that indicates strong contamination level.
HPI indicates that about 71.42% of samples exceed the high level. Cd and CF show that about 71.42% sample is highly contaminated by trace element and 14.28% sample is highly contaminated by S, Cl, and F. Based on radioactive element analysis about 14.28% samples show medium contamination level. The outcomes open the door for further analysis of the contamination extent in the surrounding area of the Barapukuria Coal mine region and indicate that the pollution status of the area is of major health and environmental concern.
The authors are grateful to the unanimous reviewers for their valuable comments. The authors are also thankful to the Department of Geology, University of Dhaka.
[1] Zhao, F.H., Cong, Z.Y., Sun, H.F., Ren, D.Y. (2007). The geochemistry of rare earth elements (REE) in acid mine drainage from the Sitai coal mine, Shanxi Province, North China. Int. J. Coal Geol., 70(1-3): 184-192. https://doi.org/10.1016/j.coal.2006.01.009
[2] Cherry, D.S., Currie, R.J., Souek, D.J., Latimer, H.A., Trent, G.C. (2011). An integrative assessment of a watershed impacted by abandoned mined land discharges. Environ. Pollut., 111(3): 377-388. https://doi.org/10.1016/S0269-7491(00)00093-2
[3] Halim, M.A., Majumder, R.K., Zaman, M.N. (2015). Paddy soil heavy metal contamination and uptake in rice plants from the adjacent area of Barapukuria coal mine, northwest Bangladesh. Arab J Geosci., 8: 3391-3401. https://doi.org/10.1007/s12517-014-1480-1
[4] Reza, S.K., Baruah, U., Singh, S.K., Das, T.H. (2015). Geostatistical and multivariate analysis of soil heavy metal contamination near coal mining area, Northeastern India. Environmental earth sciences, 73(9): 5425-5433. https://doi.org/10.1007/s12665-014-3797-1
[5] Sun, L.M., Wu, Q.L., Liao, K., Yu, P.H., Cui, Q.H., Rui, Q., Wang, D.Y. (2016). Contribution of heavy metals to toxicity of coal combustion related fine particulate matter (PM2.5) in Caenorhabditis elegans with wild-type or susceptible genetic background. Chemosphere, 144: 2392-2400. https://doi.org/10.1016/j.chemosphere.2015.11.028
[6] Jackson, L.J. (1998). Paradigms of metal accumulation in rooted aquatic vascular plants. Sci Total Environ, 219(2-3): 223-231. https://doi.org/10.1016/S0048-9697(98)00231-9
[7] Hill, N.A., Simpson, S.L., Johnston, E.L. (2013). Beyond the bed: Effects of metal contamination on recruitment to bedded sediments and overlying substrata. Environ Pollut., 173: 182-191. https://doi.org/10.1016/j.envpol.2012.09.029
[8] Ali, M.M., Ali, M.L., Islam, M.S., Rahman, M.Z. (2016). Preliminary assessment of heavy metals in water and sediment of Karnaphuli River, Bangladesh. Environ Nanotechnol Monit Manag., 5: 27-35 https://doi.org/10.1016/j.enmm.2016.01.002
[9] Wu, Q.H., Zhou, H.C., Tam, N.F.Y., Tian, Y., Tan, Y., Zhou, S., Li, Q., Chen, Y.H., Leung, J.Y.S. (2016). Contamination, toxicity and speciation of heavy metals in an industrialized urban river: Implications for the dispersal of heavy metals. Mar Pollut Bull., 104(1-2): 153-161. https://doi.org/10.1016/j.marpolbul.2016.01.043
[10] Tabaksblat, L.S. (2002). Specific features in the formation of the mine water microelement composition during ore mining. Water Resources, 29(3): 333-345. https://doi.org/10.1023/A:1015640615824
[11] Goni, M.A., Ahmad, J.U., Halim, M.A., Mottalib, M.A., Chowdhury, D.A. (2014). Uptake and translocation of metals in different parts of crop plants irrigated with contaminated water from DEPZ area of Bangladesh. Bulletin of Environmental Contamination and Toxicology, 92(6): 726-732. https://doi.org/10.1007/s00128-014-1264-z
[12] Alamgir, M., Islam, M., Hossain, N., Kibria, M.G., Rahman, M.M. (2015). Assessment of heavy metal contamination in urban soils of Chittagong City, Bangladesh. International Journal of Plant & Soil Science, 7(6): 362-372. https://doi.org/10.9734/IJPSS/2015/18424
[13] Ahmad, J.U., Goni, M.A. (2010). Heavy metal contamination in water, soil, and vegetables of the industrial areas in Dhaka, Bangladesh. Environmental Monitoring and Assessment, 166: 347-357. https://doi.org/10.1007/s10661-009-1006-6
[14] Kashem, M.A., Singh, B. (1999). Heavy metal contamination of soil and vegetation in the vicinity of industries in Bangladesh. Water, Air, and Soil pollution, 115: 347-361. https://doi.org/10.1023/A:1005193207319
[15] Muchuweti, M., Birkett, J.W., Chinyanga, E., Zvauya, R., Scrimshaw, M.D., Lester, J. (2006). Heavy metal content of vegetables irrigated with mixture of wastewater and sewage sludge in Zimbabwe: Implications for human health. Agriculture Ecosystem and Environment, 112(1): 41-48. https://doi.org/10.1016/j.agee.2005.04.028
[16] Sharma, R.K., Agrawal, M., Marshall, F. (2006). Heavy metal contamination in vegetables grown in wastewater irrigated areas of Varanasi, India. Bulletin of Environmental Contamination and Toxicology, 77: 312-318. https://doi.org/10.1007/s00128-006-1065-0
[17] Rogan, N., Serafimovski, T., Dolenec, M., Tasev, G., Dolenec, T. (2009). Heavy metal contamination of paddy soils and rice (Oryza sativa L.) from Kočani Field (Macedonia). Environ Geochem Health, 31: 439-451. https://doi.org/10.1007/s10653-008-9197-2
[18] Bruce, S.L., Noller, B.N., Grigg, A.H., Mullen, B.F., Mulligan, D.R., Ritchie, P.J., Currey, N., Ng, J.C. (2003). A field study conducted at Kidston Gold Mine, to evaluate the impact of arsenic and zinc from mine tailing to grazing cattle. Toxicol Lett., 137(1-2): 23-34. https://doi.org/10.1016/S0378-4274(02)00378-8
[19] Fernández-Caliani, J.C., Barba-Brioso, C., González, I., Galán, E. (2009). Heavy metal pollution in soils around the abandoned mine sites of the Iberian pyrite belt (southwest Spain). Water Air Soil Pollut., 200: 211-226. https://doi.org/10.1007/s11270-008-9905-7
[20] Yap, D.W., Adezrian, J., Khairiah, J., Ismail, B.S., Ahmad-Mahir, R. (2009). The uptake of heavy metals by paddy plants (Oryza sativa) in Kota Marudu, Sabah, Malaysia. Am-Eurasian J Agric Environ Sci., 6(1): 16-19.
[21] Halim, M.A., Majumder, R.K., Zaman, M.N., Hossain, S., Rasul, M.G., Sasaki, K. (2013). Mobility and impact of trace metals in Barapukuria coal mining area, northwest Bangladesh. Arab J Geosci., 6: 4593-4605. https://doi.org/10.1007/s12517-012-0769-1
[22] Machender, G., Dhakate, R., Rao, S.T.M., Rao, B.M., Prasanna, L. (2014). Heavy metal contamination in sediments of Balanagar industrial area, Hyderabad, Andra Pradesh, India. Arab J Geosci., 7: 513-525. https://doi.org/10.1007/s12517-012-0759-3
[23] Kibria, G., Hossain, M.M., Mallick, D., Lau, T.C., Wu, R. (2016). Monitoring of metal pollution in waterways across Bangladesh and ecological and public health implications of pollution. Chemosphere, 165: 1-9. https://doi.org/10.1016/j.chemosphere.2016.08.121
[24] Rahman, A.K.M.R., Hossain, S.M., Akramuzzaman, M.M. (2010). Distribution of heavy metals in rice plant cultivated in industrial effluent receiving soil. Environ Asia, 3(2): 15-19. https://doi.org/10.14456/ea.2010.18
[25] Halim, M.A., Majumder, R.K., Zaman, M.N. (2015). Paddy soil heavy metal contamination and uptake in rice plants from the adjacent area of Barapukuria coal mine, northwest Bangladesh. Arab J Geosci., 8: 3391-3401. https://doi.org/10.1007/s12517-014-1480-1
[26] Meng, Y., Li, Z., Lai, F.P. (2015). Experimental study on porosity and permeability of anthracite coal under different stresses. Journal of Petroleum Science and Engineering, 133: 810-817. https://doi.org/10.1016/j.petrol.2015.04.012
[27] Rashid, T. (2014). Holocene Sea-Level Scenarios in Bangladesh. Springer Singapore. https://doi.org/10.1007/978-981-4560-99-3
[28] Howladar, M.F., Deb, P.K., Muzemder A.T.M.S.H., Ahmed, M. (2014). Evaluation of water resources around Barapukuria coal mine industrial area, Dinajpur, Bangladesh. Appl Water Sci., 4: 203-222. https://doi.org/10.1007/s13201-014-0207-5
[29] Alam, M., Alam, M.M., Curray, J.R., Chowdhury, M.L.R., Gani, M.R. (2003). An overview of the sedimentary geology of the Bengal basin in relation to the regional tectonic framework and basin-fifill history. Sediment Geol., 155(3-4): 179-208. https://doi.org/10.1016/S0037-0738(02)00180-X
[30] Prasad, B., Bose, J. (2001). Evaluation of the heavy metal pollution index for surface and spring water near a limestone mining area of the lower Himalayas. Environmental Geology, 41: 183-188. https://doi.org/10.1007/s002540100380
[31] Backman, B., Bodiš, D., Lahermo, P., Rapant, S., Tarvainen, T. (1998). Application of a groundwater contamination index in Finland and Slovakia. Environmental Geology, 36: 55-64. https://doi.org/10.1007/s002540050320
[32] Muller, G. (1969) Index of geoaccumulation in sediments of the Rhine River. Geojournal, 2(3): 108-118.
[33] Horton, R.K. (1965). An index number of systems for rating water quality. J Water Pollut Control Fed., 37(3): 300-305.
[34] Mohan, S.V., Nithila, P., Reddy, S.J. (1996). Estimation of heavy metal in drinking water and development of heavy metal pollution index. J Environ Sci Health, 31(2): 283-289. https://doi.org/10.1080/10934529609376357
[35] Edet, A.E., Offiong, O.E. (2002). Evaluation of water quality pollution indices for heavy metal contamination monitoring. A study case from Akpabuyo-Odukpani area, Lower Cross River Basin (southeastern Nigeria). GeoJournal, 57(4): 295-304. https://doi.org/10.1023/B:GEJO.0000007250.92458.de
[36] Zhu, G.X., Guo, Q.J., Xiao, H.Y., Chen, T.B., Yang, J. (2017). Multivariate statistical and lead isotopic analyses approach to identify heavy metal sources in topsoil from the industrial zone of Beijing Capital Iron and Steel Factory. Environ Sci Pollut Res., 24: 14877-14888. https://doi.org/10.1007/s11356-017-9055-9
[37] Jiménez-Ballesta, R., García-Navarro, F.J., Bravo, S., Amorós, J.A., Pérez-de-los-Reyes, C., Mejías, M. (2016). Environmental assessment of potential toxic trace element contents in the inundated floodplain area of Tablas de Daimiel wetland (Spain). Environ Geochem Health., 39(5): 1159-1177. https://doi.org/10.1007/s10653-016-9884-3
[38] Mishra, V.K., Upadhyaya, A.R., Pandey, S.K., Tripathi, B.D. (2008). Heavy metal pollution induced due to coal mining effluent on surrounding aquatic ecosystem and its management through naturally occurring aquatic macrophytes. Bioresour Technol., 99(5): 930-936. https://doi.org/10.1016/j.biortech.2007.03.010
[39] Li, H.J., Lin, L., Ye, S., Li, H.B., Fan, J.F. (2017). Assessment of nutrient and heavy metal contamination in the seawater and sediment of Yalujiang Estuary. Mar Pollut Bull., 117(1-2): 499-506. https://doi.org/10.1016/j.marpolbul.2017.01.069
[40] Lăcătuşu, R., Câtu, G., C., Aston, J., Lungu, M., Lăcătuşu, A.R. (2009). Heavy metals soil pollution state in relation to potential future mining activities in the Rosia Montanaarea. Carpathian J Earth Environ Sci., 4(2): 39-50.
[41] Finkelman, R.B., Orem, W., Castranova, V., Tatu, C.A., Belkin, H.E., Zheng, B.S., Lerch, H.E., Maharaj, S.V., Bates, A.L. (2002). Health impacts of coal and coal use: possible solutions. International Journal of Coal Geology, 50(1-4), 425-443. https://doi.org/10.1016/S0166-5162(02)00125-8
[42] Dai, S.F., Li, W.W., Tang, YG.., Zhang, Y., Feng, P. (2007). The sources, pathway, and preventive measures for fluorosis in Zhijin County, Guizhou, China. Appl Geochem, 22(5): 1017-1024. https://doi.org/10.1016/j.apgeochem.2007.02.011
[43] Dai, S.F., Ren, D.Y., Chou, C.L., Finkelman, R.B., Seredin, V.V., Zhou, Y.P. (2012). Geochemistry of trace elements in Chinese coals: A review of abundances, genetic types, impacts on human health, and industrial utilization. Int J Coal Geol, 94: 3-21. https://doi.org/10.1016/j.coal.2011.02.003
[44] Dai, S., Yang, J.Y., Ward, C.R., Hower, J.C., Liu, H.D., Garrison, T.M., French, D., O'Keefe, J.M.K. (2015). Geochemical and mineralogical evidence for a coal-hosted uranium deposit in the Yili Basin, Xinjiang, northwestern China. Ore Geol Rev., 70: 1-30. https://doi.org/10.1016/j.oregeorev.2015.03.010
[45] Belkin, H.E., Zheng, B., Zhou, D., Finkelman, R.B. (2008). Chapter seventeen-Chronic arsenic poisoning from domestic combustion of coal in rural China: A case study of the relationship between earth materials and human health. Environmental Geochemistry. Environ Geochem, 401-420. https://doi.org/10.1016/B978-0-444-53159-9.00017-6
[46] Nabulo, G., Young, S.D., Black, C.R. (2010). Assessing risk to human health from tropical leafy vegetables grown on contaminated urban soils. Sci Total Environ., 408(22): 5338-5351. https://doi.org/10.1016/j.scitotenv.2010.06.034
[47] Biljana, D.Š., Maja, B., Grigorije, J., Igor, A. (2018). Seasonal, spatial variations and risk assessment of heavy elements in street dust from Novi Sad, Serbia. Chemosphere, 205: 452-462. https://doi.org/10.1016/j.chemosphere.2018.04.124
[48] Sidenko, N.V., Khozhina, E.I., Sherriff, B.L. (2007) The cycling of Ni, Zn, Cu in the system “mine tailings-ground water-plants: A case study. Appl Geochem, 22: 30-52. https://doi.org/10.1016/j.apgeochem.2006.07.019
[49] Kabata-Pendias, A, Pendias, H. (2001) Trace elements in soils and plants, 3rd edn. CRC Press, Boca Raton
[50] Wuana, R.A., Okieimen, F.E. (2011). Heavy metals in contaminated soils: A review of sources, chemistry, risks and best available strategies for remediation. Isrn Ecology, 2011: 402647. https://doi.org/10.5402/2011/402647
[51] Chen, T.B., Zheng, Y.M., Lei, M., Huang, Z.C., Wu, H.T., Chen, H., Tian, Q.Z. (2005). Assessment of heavy metal pollution in surface soils of urban parks in Beijing, China. Chemosphere, 60(4): 542-551. https://doi.org/10.1016/j.chemosphere.2004.12.072
[52] Mapanda, F., Mangwayana, E.N., Nyamangara, J., Giller, K.E. (2005). The effect of long-term irrigation using wastewater on heavy metal contents of soils under vegetables in Harare, Zimbabwe. Agriculture, Ecosystems & Environment, 107(2-3): 151-165. https://doi.org/10.1016/j.agee.2004.11.005