Natanael Tehna | Elisé Sababa* | Armel Zacharie Ekoa Bessa | Jacques Etame
OPEN ACCESS
This study includes soils and tailings from the gold mine of four stations (Mari, Mbigala, Mboufa and, Bedobo) in Betare-Oya, eastern Cameroon. These stations have been utilized by Cameroonians and later on by some companies. Soils and tailings were sampled and heavy metal (Cr, V, Ni, Cu, Zn, Hg and, Pb) and radioactive element (Th and U) contents have been determined using ICP–MS techniques. This work deals with the heavy metaldistribution in mining waste and surrounding soils and tailings.The study area is exposed to artisanal gold mining activities. Field observations revealed the soildestructionas well as the environment. All metal values fall below the average shale, except Cr who’s the content is higher than the shale value in soils and tailings. Lead and Th values are above the average shale in tailings. Heavy metal pollution was performed using pollution indices such as enrichment factor (EF), geo-accumulation index (I-geo) and pollution load index (PLI). The overall results reveal that the soils and tailing from Betare-Oya mining area, Eastern Cameroon are only polluted by Cr. These sediments have minor to moderate enrichment; they are unpolluted to moderately polluted with a low contamination level for other metals. Only two stations can be considered as slightly polluted, with minor enrichment and moderate contamination by metals.
Betare-Oya, mining, pollution indices, pollution, soil, tailing
Mining can be considered as one of the human activities which negatively influence the environment [1-4]. It usually has as result the destruction of different milieu through the removal of alluvium, flora and burial beneath waste disposal areas [5-7]. Mine waste can be subdivided into two main groups: mine tailings which can be generated when processing the ore, and waste rock produced when the ore is uncover. Various assessments for natural resources include processes such as grinding of rock and metals, recovery of selected element and disposal of the wastes, often as slurry, to a tailing or preservation pond. Finally, almost all the original material may become tailings when low-quality ores are utilized [8-10].
The impacts of mining are the destruction of habitat, the loss of bio-diversity resources and the accumulation of pollutants in various environments [11-13]. Therefore, mining areas have in long term toxicological problem for different ecosystems and human health [5, 14-16]. The exploitation of ore resources create damage in the three various environments: water, atmosphere and, soil. Heavy and radioactive metal elements associated with mining have specific interest for several reasons. They usually show a tendency to accumulate in soils and sediments and have a long tenacity. Metals and radioactive elements are also abundant in soils and sediments derive from both natural and anthropogenic sources. Pathways include inheritance from the parental rocks, application of water and fluvial and/or marine deposition of discharges from dust and mining [10, 17, 18]. At the end, most of metal trace elements, at low values have a crucial role as nutrients for flora, animals, and human health. However, in high concentrations and in some forms, they can be toxic and can cause harm to life [19-21].
This study is focussed on the evaluation of the physical impact and, the concentrations of trace and radioactive metals in the soils and tailings from mine waste in Betare-Oya district (Eastern Cameroon). This helpedto identify their natural enrichment or anthropogenic sources using physical impact affected by gold mining and heavy metal indices such as enrichment factor (EF), geo-accumulation index (Igeo) and pollution load index (PLI). It also helped to assess the environmental risk of heavy and radioactive metals in the investigated area by comparing the acquired metal values with the average shale from Turekian and Wedepohl [22] and the WHO guidelines. The survey of metals in a mining environment is very useful to assess pollution in the Betare-Oya district and provide basic information for the determination of environmental health risks and management of environmental pollution issues in this area.
2.1 Study area
The Betare-Oya mining area is located in the eastern region (Figure 1), with a surface area of more than 210 km2. It is part of the southern Cameroonian plateau whose altitudes vary between 700 to 900 m. This area is characterized by a hilly landscape [23, 24]. It has a "Guinean sub-equatorial" climate with bimodal rainfall. It includes 4 seasons with annual precipitation exceeding 1500 mm/year. The Lom River is the main collector that dissects the surrounding rock domes forming broad U-shaped valleys. Geological formations are mainly composed of metasediments and shale rocks accompanied by quartzites and gneisses [25, 26]. In this area, the mineralized layer is located under the waste rock layers ranging from 1 to 15 m. It is distributed in the diffuse and ubiquitous quartz veins, apparently consistent with schistosity [26]. This area has been continuously exploited for more than a century. Ferrasols and gleysols are the main soils of the Betare-Oya region.
Figure 1. Location map showing the study area
2.2 Sampling and analysis of soils and tailings
In order to represent the various mining waste management situations in the Betare Oya area, observations were made and sampling points were set up on the flats of the Mari, Mbigala, Mboufa and Bedobo main tributaries from the Lom watershed. Eight soil and tailing samples were collected at the top (0-5 cm) of the riverbank deposits using a Peterson mud sampler (XDB0201). One kilogram of the bank sediment was sampled and stored in closed plastic packaging bags following the procedure used by Ekoa Bessa et al. [16]. Each sample was air-dried and after grinding with agatemortar, samples were sieved using a sieve of 0.080 mmto remove debris. Pre-treatment of Cr, V, Ni, Cu, Zn, Hg, Pb, Th and U of sediment and soil samples was obtained using the ‘methods for chemical analysis of silicate rocks’ (GB/T 14506.30-2010). Each element concentration was analysed by Inductively Coupled Plasma Mass Spectrometer (ICP-MS) at ALS Group Laboratory in Vancouver, Canada.
2.3 Heavy metals indices
2.3.1 Enrichment Factor (EF)
To have the probable sources of elements in sediments, enrichment factors were calculated for each element over the average shale background. Typically, the enrichment factor (EF) of elements is stated by the equation:
EF = (M /Fe) sample / (M / Fe) background
where, (M) background and (Fe) background are the concentrations of the studied element and Fe in the background, while (M) sample and (Fe) sample are the mean concentrations of the element and Fe, respectively, in the sample. Iron is frequently used as a reference element. Rubio et al. [27] suggested the use of regional background values. Meanwhile the background values are constant; the levels of contamination vary with time and areas. The EF values close to 1 indicate crusted origin, those less than 1 suggest a possible mobilization or depletion of metals [28, 29], while EF >1 shows anthropogenic origin. EFs greater than 10 are considered to be from non-crusted source. On the basis of the enrichment factor, five contamination categories are recognized (Table 1).
2.3.2 Geo-Accumulation Index (Igeo)
The geo-accumulation index (Igeo) was introduced by Müller [30]. Originally used with river bottom sediments, it can also be applied in the assessment of soil contamination [31]. In the present paper, the Igeo for the soils and debris of studied mining was computed using the following equation:
Igeo = Log2 (Cn / 1.5 Bn)
where, Cn is the measured quantities of heavy metals in the soils and sediments (mg/kg), and Bn is the background concentration of the metals in the soils and sediments (mg/kg [22]). The constant 1.5 is used due to potential variations in the baseline data [31, 32]. The geo-accumulation index consists of 7 classes or grades (Table 1), whereby the highest class 6 reflects a 100-fold enrichment above the background values [33]. The Igeo values for the metals of the examined mining are listed in Table 4.
2.3.3 The pollution load index (PLI)
The pollution load index (PLI) of a single site is the root number (n) multiplied together by the contamination factor (CF) values expressed by the equation:
$P L I=\sqrt[n]{(C F 1 \times C F 2 \times C F 3 \times \ldots \ldots \times C F n}$
where, n is the number of metals and CF is the contamination factor. Harikumar et al. [34] gives some interpretations of the pollution load index. A PLI value under 0 indicate unpolluted sediments; 0 indicates perfection; a value of 1 indicates the presence of only baseline levels of pollutants, and values above 1 would indicate progressive deterioration of the site quality [35].
Table 1. Classes of EF, I-geo, PLI and CF
|
EF classes |
Enrichmentlevel |
Igeo value ; classes |
Pollution level |
|
EF <1 |
No enrichment |
I-geo ≤ 0 ; 0 |
Unpolluted |
|
EF = 1-3 |
Minor enrichment |
I-geo = 0-1 ; 1 |
Unpolluted to moderately polluted |
|
EF = 3-5 |
Moderate enrichment |
I-geo = 1-2 ; 2 |
Moderately polluted |
|
EF = 5-10 |
Moderately severe enrichment |
I-geo = 2-3 ; 3 |
Moderately to strongly polluted |
|
EF = 25-50 |
Very severe enrichment |
I-geo = 3-4 ; 4 |
Stronglypolluted |
|
EF > 50 |
Extremely severe enrichment |
I-geo = 4-5 ; 5 |
Strongly to very strongly polluted |
|
PLI values |
Pollution level |
CF classes |
Contamination level |
|
PLI < 0 |
Unpolluted |
CF <1 |
Low contamination |
|
PLI = 0 |
Perfection |
CF = 1-3 |
Moderate contamination |
|
PLI = 1 |
Baseline level of polluants |
CF = 3-6 |
Considerable contamination |
|
PLI > 1 |
Progressive deterioration |
CF > 6 |
High contamination |
3.1 Impact of Gold Mining on the Studied Area
In the Lom valley, the main mining site operating is located in the Betare-Oya area. Mining activities use practices and equipment that integrate excavators, mechanical washing stations, motorized pumps, and expert coating and enrichment methods.
Figure 2. Visible change in the landscape
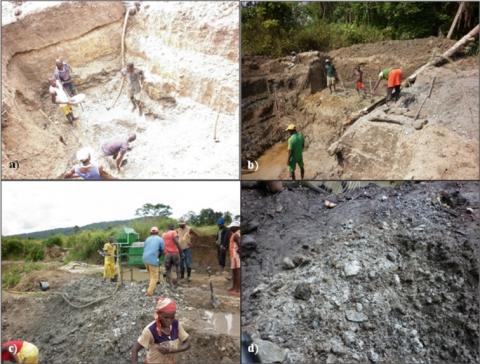
Disruption of the studied area following mining activities is responsible for remarkable modifications in the landscape (Figure 2) and produces a huge quantity of tailings. Therefore, mining activities are the main cause of the destruction of vegetation and soils. Each of these phenomena generates a volume of waste that requires special management during the activity.
3.1.1 Destruction of vegetation covers (deforestation)
To access the ore, the opening of access infrastructures, the prior clearing of some areas for camp development and storage of equipment cause the destruction of the forest ecosystem (Figure 3a). The construction of retaining walls and the satisfaction of current needs on the sites accentuate deforestation. Thus, the increase in mining production induces strong pressure on forest and wood resources. The use of bulldozers and loaders displaces a large part of the vegetation from the farm areas and thus produces a large quantity of plant tailings consisting of tree trunks, roots, branches and foliage (Figure 3b). Strong erosion observed in the area is due to the degradation of the plant cover (Figure 3c).
Figure 3. Destruction of vegetation cover
3.1.2 Soil destruction
Figure 4. Soil destruction
The mining method used in the Betare-Oya area is the placer type. In the area, gold deposits are associated with sediments in a stream bed or flats [9]. Heavy equipment’s consisting of excavators, buckets, loaders and bulldozers are used to reach mineralized gravel, which often occurs at varying depths in the soil. Digging often starts with the delimitation of an area, generally rectangular in shape (Figure 4a). Subsequently, heavy machinery is used to strip the waste rock that covers the mineralized level. The volume of this waste rock resulting from the sinking process often depends on the depth at which this level is located. This depth often varies from a few meters to more than ten meters [15, 36]. When the depth of the pit becomes significant, the stripping is done in successive steps (Figure 4b) and the different levels of the ground thus stripped are placed on these bearings for easy evacuation. These stripped sterile levels consist of overburden (agricultural soil, clay levels, sandy levels, gravel level considered insufficiently rich) and sterile rock blocks (Figure 4c). This irreversible process of deterioration if left unchecked can become catastrophic for several generations. Gold mining could also be the cause of soil infertility, as a result of the erosion of the organo-mineral layer. The soils are then destroyed, and therefore not suitable for agriculture (Figure 4d) [36-38].
3.2 Heavy metals in Betare-Oya mining area
The results and their mean are shown in Table 2. The results show that the highest concentrations of heavy metals are obtained in the area of Bedobo both in soils and tailings. The metals have a decreasing average concentration order Fe > Cr > V > Zn > Ni > Cu > Pb > Th > U > Hg. Comparism between the mean values of metals traces in the various sites and samples shows that the Fe concentrations are higher than those of other metals. Anyway, the average Fe concentration is below the Average Shale value (47200 mg/kg) [22]) reference values.
Table 2. Heavy metal and radioactive element contents (in mg/kg)
|
Station |
MTE |
RE |
||||||||
|
Fe |
Cr |
V |
Ni |
Cu |
Zn |
Hg |
Pb |
Th |
U |
|
|
Soils |
||||||||||
|
Mari |
22185 |
180 |
24 |
7 |
7 |
11 |
0.06 |
5 |
0.69 |
0.21 |
|
Mbigala |
16472 |
210 |
72 |
23 |
16 |
54 |
0.01 |
14 |
4.4 |
1.86 |
|
Mboufa |
41164 |
210 |
120 |
29 |
25 |
42 |
0.03 |
13 |
4 |
1.53 |
|
Bedobo |
22767 |
170 |
119 |
64 |
27 |
136 |
0.01 |
20 |
9.18 |
2.5 |
|
Mean |
25647 |
192.5 |
83.75 |
30.75 |
18.75 |
60.75 |
0.028 |
13 |
4.57 |
1.53 |
|
Tailings |
||||||||||
|
Mari |
21989 |
150 |
51 |
20 |
17 |
60 |
0.005 |
20 |
8.26 |
1.68 |
|
Mbigala |
16651 |
220 |
136 |
14 |
5 |
45 |
0.005 |
14 |
15 |
3.76 |
|
Mboufa |
32259 |
120 |
187 |
30 |
25 |
101 |
0.01 |
30 |
16 |
4.17 |
|
Bedobo |
21758 |
120 |
127 |
25 |
27 |
70 |
0.032 |
24 |
12.65 |
4.02 |
|
Mean |
23164.25 |
152.5 |
125.25 |
22.25 |
18.5 |
69 |
0.013 |
22 |
12.98 |
3.41 |
|
International standards |
||||||||||
|
Average shale* |
47200 |
90 |
130 |
68 |
45 |
95 |
0.4 |
20 |
12 |
3.7 |
|
WHO, 2011 |
|
185 |
|
50 |
100 |
300 |
1 |
1 |
|
0.3 |
MTE: metal trace elements; RE: radioactive elements
The average concentration of the other metals is lower than the reference values from Average Shale [22], except for Cr in all stations of both sediment types. Some of these metals whose mean of stations are generally under reference values for soils and tailings show remarkable values in some stations (Table 2). Thus, V is lower than the Average Shale everywhere, except in Mbigala (136 mg/kg) and Mfoufa (187 mg/kg) in tailings; Zn is also under the average values at Bedobo in soil sediments (136 mg/kg) and at Mboufa in tailings (101 mg/kg). Lead, Th and U are also under the Average Shale in some stations in tailing sediments (Table 1).
In contrast, the average values of the other metals are less than the WHO values (2011), except for Pb (13 and 22 mg/kg in soils and tailings, respectively) and U (1.53 and 3.41 mg/kg in soils and tailings, respectively) which are higher than WHO values (1 mg/kg for Pb and 0.3 mg/kg for U). Similar results are obtained for average Cr (192.5 mg/kg) and Ni (64 mg/kg) values in soil at Bedobo site (Table 1). Low concentrations of heavy metals and radioactive elements can be linked to leaching of source rocks [16, 36, 38]. According to the WHO and UNICEF [39], the mean heavy metal concentrations in the Betare-Oya soils and tailings are under the agricultural, residential and industrial limits for environmental health.
3.3 Estimation of soils contamination intensity of Betare-Oya mining area
3.3.1Enrichment Factor (EF)
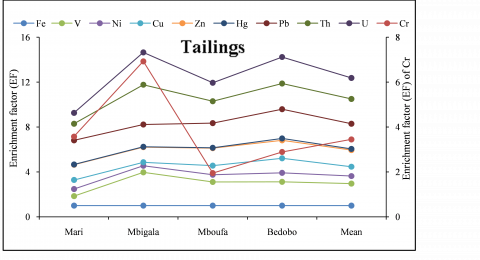
The Enrichment factor (EF) is a common tool to assess enrichment degree. In addition, it generally helps to compare the contamination level in different environmental biota. Table 3 and Figure 5 shows the enrichment factors (EF) of the metals in soils and tailing. Chromium possesses the highest EF average values (3.94 and 3.45 in soils and tailings, respectively) in the overall EF of all other metals. The order of average metal EF is Cr (3.94) > Pb (1.20) > V (1.19) > Zn (1.18) > Ni (0.83) > Cu (0.77) > U (0.76) > Th (0.70) > Hg (0.13) in soils and Cr (3.45) > Pb (2.24) > Th (2.20) > V (1.96) > U (1.88) > Zn (1.48) > Cu (0.84) > Ni (0.67) > Hg (0.11) in tailings. As shown above, the EF values are similar. The EF of the different heavy metals show the highest value in soils and tailings of Bedobo. The order of EF in sediments is: Bedobo > Mbigala > Mboufa > Mari. The low EF shows that the main origin of the heavy metals in the soils may be tailing bile.
Table 3. Enrichment factor (EF) for heavy metals
|
Station |
MTE |
RE |
||||||||
|
Fe |
Cr |
V |
Ni |
Cu |
Zn |
Hg |
Pb |
Th |
U |
|
|
Soils |
||||||||||
|
Mari |
1 |
4.26 |
0.39 |
0.22 |
0.33 |
0.25 |
0.32 |
0.53 |
0.12 |
0.12 |
|
Mbigala |
1 |
6.69 |
1.59 |
0.97 |
1.02 |
1.63 |
0.07 |
2.01 |
1.05 |
1.44 |
|
Mboufa |
1 |
2.68 |
1.06 |
0.49 |
0.64 |
0.51 |
0.09 |
0.75 |
0.38 |
0.47 |
|
Bedobo |
1 |
3.92 |
1.90 |
1.95 |
1.24 |
2.97 |
0.05 |
2.07 |
1.59 |
1.40 |
|
Mean |
1 |
3.94 |
1.19 |
0.83 |
0.77 |
1.18 |
0.13 |
1.20 |
0.70 |
0.76 |
|
Tailings |
||||||||||
|
Mari |
1 |
3.58 |
0.84 |
0.63 |
0.81 |
1.36 |
0.03 |
2.15 |
1.48 |
0.97 |
|
Mbigala |
1 |
6.93 |
2.97 |
0.58 |
0.31 |
1.34 |
0.04 |
1.98 |
3.54 |
2.88 |
|
Mboufa |
1 |
1.95 |
2.10 |
0.65 |
0.81 |
1.56 |
0.04 |
2.19 |
1.95 |
1.65 |
|
Bedobo |
1 |
2.89 |
2.12 |
0.80 |
1.30 |
1.60 |
0.17 |
2.60 |
2.29 |
2.36 |
|
Mean |
1 |
3.45 |
1.96 |
0.67 |
0.84 |
1.48 |
0.11 |
2.24 |
2.20 |
1.88 |
MTE: metal trace elements; RE: radioactive elements
Figure 5. Enrichment Factor (EF) of metals
The increase in Bedobo and Mbigala stations shows that the metals in soil originate from crusted source. Enrichment factor (EF) values close to 1show crested origin of Ni, Cu, Th and V in soils of Mbigala stations; V in soils of Mboufa and U in Mari tailings (Figure 5). Almost all the studied metals of Mari and Mboufa (except Hg) have EF < 1, suggesting a possible leaching of heavy metals from tailing. In the Bedobo and Mbigala stations, heavy metals possess EF > 1 indicating that these metals are from anthropogenic source. Consequently, average values of EF for Ni, Cu, Hg, Th and U show no enrichment in soils; Cu and Hg have no enrichment in tailings; V, Zn and Pb have minor enrichment in soils and tailing, and Th and U show equally minor enrichment in tailings. Enrichment factor for Cr in both soils and tailing shows moderate enrichment. This may result from anthropogenic such asgold mining and agriculture.
3.3.2 Geo-Accumulation Index (I-geo)
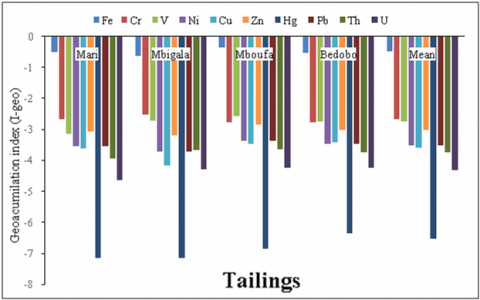
The geo-accumulation index (I-geo) is a quantitative assessment of the degree of pollution of sediments [40]. Table 4 and Figure 6 present the I-geovalues of heavy metal in the soils and tailings from the Betare-Oya area. The I-geo valuesare low for the different heavy metal in soils and tailings irrespective of the studied stations (Table 4 and Figure 6). All metals remain in grade 0 (unpolluted), suggesting that the sediments (soils and tailings) are in background value. This may be due to the non-use of pesticides and fertilizers by agricultural activities and products of mining exploitation.
Table 4. Geoaccumulation index (I-geo) of heavy metals
|
Station |
MTE |
RE |
||||||||
|
Fe |
Cr |
V |
Ni |
Cu |
Zn |
Hg |
Pb |
Th |
U |
|
|
Soils |
||||||||||
|
Mari |
-0.50 |
-2.59 |
-3.47 |
-4.00 |
-4.00 |
-3.81 |
-6.07 |
-4.15 |
-5.01 |
-5.53 |
|
Mbigala |
-0.63 |
-2.53 |
-2.99 |
-3.49 |
-3.65 |
-3.12 |
-6.85 |
-3.70 |
-4.21 |
-4.58 |
|
Mboufa |
-0.24 |
-2.53 |
-2.77 |
-3.39 |
-3.45 |
-3.23 |
-6.37 |
-3.74 |
-4.25 |
-4.67 |
|
Bedobo |
-0.49 |
-2.62 |
-2.77 |
-3.04 |
-3.42 |
-2.72 |
-6.85 |
-3.55 |
-3.89 |
-4.45 |
|
Mean |
-0.44 |
-2.57 |
-2.93 |
-3.36 |
-3.58 |
-3.07 |
-6.41 |
-3.74 |
-4.19 |
-4.67 |
|
Tailings |
||||||||||
|
Mari |
-0.51 |
-2.67 |
-3.14 |
-3.55 |
-3.62 |
-3.07 |
-7.15 |
-3.55 |
-3.93 |
-4.62 |
|
Mbigala |
-0.63 |
-2.51 |
-2.72 |
-3.70 |
-4.15 |
-3.20 |
-7.15 |
-3.70 |
-3.67 |
-4.27 |
|
Mboufa |
-0.34 |
-2.77 |
-2.58 |
-3.37 |
-3.45 |
-2.85 |
-6.85 |
-3.37 |
-3.65 |
-4.23 |
|
Bedobo |
-0.51 |
-2.77 |
-2.75 |
-3.45 |
-3.42 |
-3.00 |
-6.34 |
-3.47 |
-3.75 |
-4.25 |
|
Mean |
-0.49 |
-2.67 |
-2.75 |
-3.50 |
-3.58 |
-3.01 |
-6.53 |
-3.51 |
-3.74 |
-4.32 |
MTE: metal trace elements; RE: radioactive elements
Figure 6. Geo-accumulation index (Igeo) of metals
3.3.3 Pollution load index (PLI)
The pollution load index calculated using the values of contamination factor (CF) shows that the soils are moderately to strongly contaminated by the heavy metals (Table 5).
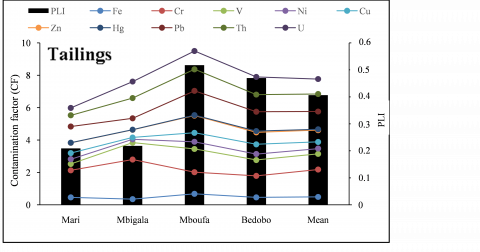
According to the classification of heavy metal pollution developed by Hakanson [41], the CF of almost all the metals in the soils of Betare-Oya show low contamination factor in all stations, except Zn and Pb in Bedobo. In tailing products, most of the metals have low contamination level, but V, Th and U have moderate contamination levels in Mbigala station; V, Zn, Pb, Th and U are lowly contaminated in Mboufa while Bedobo area is moderately contaminated by Pb, Th and U (Figure 7). It is also seen that Cr has moderate contamination level in all stations of the study area. The values on PLI in both soils and tailings are low (PLI <1) and interpreted as low pollution (Table 5; Figure 7). Soils and tailing are lowly contaminated by external sourcesas gold mining activities, agricultural runoff or any other anthropogenic inputs in this area.
Table 5. The contamination factor (CF) and Pollution Load Index (PLI)
|
Station |
CF of MTE |
CF of RE |
PLI |
||||||||
|
Fe |
Cr |
V |
Ni |
Cu |
Zn |
Hg |
Pb |
Th |
U |
||
|
Soils |
|||||||||||
|
Mari |
0.47 |
2.00 |
0.18 |
0.10 |
0.16 |
0.12 |
0.15 |
0.25 |
0.06 |
0.06 |
0.06 |
|
Mbigala |
0.35 |
2.33 |
0.55 |
0.34 |
0.36 |
0.57 |
0.03 |
0.70 |
0.37 |
0.50 |
0.22 |
|
Mboufa |
0.87 |
2.33 |
0.92 |
0.43 |
0.56 |
0.44 |
0.08 |
0.65 |
0.33 |
0.41 |
0.33 |
|
Bedobo |
0.48 |
1.89 |
0.92 |
0.94 |
0.60 |
1.43 |
0.03 |
1.00 |
0.77 |
0.68 |
0.45 |
|
Mean |
0.54 |
2.14 |
0.64 |
0.45 |
0.42 |
0.64 |
0.07 |
0.65 |
0.38 |
0.41 |
0.29 |
|
Tailings |
|||||||||||
|
Mari |
0.47 |
1.67 |
0.39 |
0.29 |
0.38 |
0.63 |
0.01 |
1.00 |
0.69 |
0.45 |
0.21 |
|
Mbigala |
0.35 |
2.44 |
1.05 |
0.21 |
0.11 |
0.47 |
0.01 |
0.70 |
1.25 |
1.02 |
0.22 |
|
Mboufa |
0.68 |
1.33 |
1.44 |
0.44 |
0.56 |
1.06 |
0.03 |
1.50 |
1.33 |
1.13 |
0.52 |
|
Bedobo |
0.46 |
1.33 |
0.98 |
0.37 |
0.60 |
0.74 |
0.08 |
1.20 |
1.05 |
1.09 |
0.47 |
|
Mean |
0.49 |
1.69 |
0.96 |
0.33 |
0.41 |
0.73 |
0.05 |
1.10 |
1.08 |
0.92 |
0.41 |
MTE: metal trace elements; RE: radioactive elements
Figure 7. CF and PLI of metals in the soils and tailings
This study aimed at investigating the environmental impact of gold mining activities, assessing the heavy metal (Cr, V, Ni, Cu, Zn, Hg, Pb, Th and U) contamination of soils and tailings in the mining sites and the surrounding areas. The artisanal mining activities have a negative impact on the esthetic aspects of the landscape as well as the quality of soil and tailing. According to the enrichment factor (EF), contamination factor (CF) and pollution load index (PLI), soils and tailings of Betare-Oya are polluted by Cr. The other metals show low to moderate contamination. Bedobo and Mbigala can be considered as slightly polluted with minor enrichment and moderate contamination by metals in the soils of Betare-Oya.
The authors extend their gratitude to Professor Paul-DésiréNdjigui (University of Yaoundé I) for the constructive advice during the drafting of this manuscript.
Cr chrome
V vanadium
Ni nickel
Cu copper
Hg mercury
Zn zinc
Pb lead or sinker
Th thorium
U uranium
WHO World Health Organization
UNICEF United Nations of International Children's Emergency Fund
km2 kilometer square
m meter
mm/year millimeter/year
cm centimeter
kg kilogram
mm millimeter
Fe iron
Log logarithm
mg/kg milligram/kilogram
[1] Donkor, A.K., Bonzongo, J.C.J., Nartey, V.K., Adotey, D.K. (2005). Heavy metals in sediments of the gold mining impacted Pra River Basin, Ghana, West Africa. Soil & Sediment Contamination, 14(6): 479-503. http://dx.doi.org/10.1080/15320380500263675
[2] Brooks, S.J., Escudero-Oñate, C., Lillicrap, A.D. (2019). An ecotoxicological assessment of mine tailings from three Norwegian mines. Chemosphere, 233: 818-827. http://dx.doi.org/10.1016/j.chemosphere.2019.06.003
[3] Rocha-Nicoleite, E., Overbeck, G.E., Mülle, S.C. (2017). Degradation by coal mining should be priority in restoration planning. Perspectives in Ecology and Conservation, 15(3): 202-205. http://dx.doi.org/10.1016/j.pecon.2017.05.006
[4] Sun, Q., Zhang, J., Qi, W., Li, M. (2019). Backfill mining alternatives and strategies for mitigating shallow coal mining hazards in the Western mining area of China. Quarterly Journal of Engineering Geology and Hydrogeology, 2: 017-026. http://dx.doi.org/10.1144/qjegh2017-026
[5] Pahimi, H., Panda, C.R., Ngassoum, M.B., Tchameni, R. (2015). Environmental impacts of mining in the volcano-sedimentary basins of Cameroon: case study of artisanal gold mine tailings (Betare Oya, East-Cameroon). International Journal of Energy, Sustainability and Environmental Engineering, 2: 5-15.
[6] Rakotondrabe, F., Ngoupayou, J.R.N., Mfonka, Z., Rasolomanana, E.H., Abolo, A.J.N., Ako, A.A. (2018). Water quality assessment in the Bétaré-Oya gold mining area (East-Cameroon): Multivariate statistical analysis approach. Science of The Total Environment, 610-611: 831-844. http://dx.doi.org/10.1016/j.scitotenv.2017.08.080
[7] Zhou, P., Wang, Y.J., Zhu, G.L., Gao, Y.B. (2019) Comparative analysis of the mine pressure at non-pillar long wall mining by roof cutting and traditional long wall mining. Journal of Geophysics and Engineering, 16(2): 423-438. http://doi.org/10.1093/jge/gxz026
[8] Ledin, M., Pedersen, K. (1996). The environmental impact of mine wastes roles of microorganisms and their significance in treatment of mine wastes. Earth-Science Reviews, 41(1-2): 67-108. http://dx.doi.org/10.1016/0012-8252(96)00016-5
[9] Mimba, M.E., Ohba, T., Fils, S.C.N., Nforba, M.T., Numanami, N., Bafon, T.G., Suh, C.E. (2018). Regional geochemical baseline concentration of potentially toxic trace metals in the mineralized Lom Basin, East Cameroon: A tool for contamination assessment. Geochemical Transactions, 19(1): 11. http://dx.doi.org/10.1186/s12932-018-0056-5
[10] Chen, S., Liang, Z., Webster, R., Zhang, G., Zhou, Y., Teng, H., Shi, Z. (2019). A high-resolution map of soil pH in China made by hybrid modelling of sparse soil data and environmental covariates and its implications for pollution. Science of the Total Environment, 655: 273-283. https://doi.org/10.1016/j.scitotenv.2018.11.230
[11] Guo, Y., Barnett, A.G., Zhang, Y., Tong, S., Yu, W., Pan, X. (2010). The short-term effect of air pollution on cardiovascular mortality in Tianjin, China: Comparison of time series and case–crossover analyses. Science of the Total Environment, 409(2): 300-306. http://dx.doi.org/10.1016/j.scitotenv.2010.10.013
[12] Bat, L., Özkan, E.Y. (2019). Heavy metal levels in sediment of the Turkish Black Sea coast. In Oceanography and Coastal Informatics: Breakthroughs in Research and Practice, pp. 86-107. IGI Global. http://dx.doi.org/10.4018/978-1-5225-7308-1.ch004
[13] Gao, J., Liu, Q., Song, L., Shi, B. (2019). Risk assessment of heavy metals in pipe scales and loose deposits formed in drinking water distribution systems. Science of the Total Environment, 652: 1387-1395. https://doi.org/10.1016/j.scitotenv.2018.10.347
[14] Zahra, A., Hashmi, M.Z., Malik, R.N., Ahmed, Z. (2014). Enrichment and geo-accumulation of heavy metals and risk assessment of sediments of the Kurang Nallah feeding tributary of the Rawal Lake Reservoir, Pakistan. Science of the Total Environment, 470-471: 925-933. http://dx.doi.org/10.1016/j.scitotenv.2013.10.017
[15] Tehna, N., Nguene, F.D., Etame, J., Medza, Ekodo, J.M., Noa Tang, S., Suh, E.C., Bilong, P. (2015). Impending pollution of BetareOya opencast mining environment (Eastern Cameroon). Journal of Environmental Science and Engineering, 4: 37-46. http://dx.doi.org/10.17265/2162-5263/2015.01.006
[16] Ekoa Bessa, A.Z., El-Amier, Y.A., Doumo, E.P.E., Ngueutchoua, G. (2018). Assessment of sediments pollution by trace metals in the Moloundou swamp, Southeast Cameroon. Annual Research & Review in Biology, 30(1): 1-13. http://dx.doi.org/10.9734/ARRB/2018/46070
[17] Douglas, S.A., Ohlstein, E.H. (2000). Human urotensin-II, the most potent mammalian vasoconstrictor identified to date, as a therapeutic target for the management of cardiovascular disease. Trends in Cardiovascular Medicine, 10(6): 229-237. http://dx.doi.org/10.1016/S1050-1738(00)00069-4
[18] Getaneh, W., Alemayehu, T. (2006). Metal contamination of the environment by placer and primary gold mining in the Adola region of southern Ethiopia. Environmental Geology, 50(3): 339-352. http://dx.doi.org/10.1007/s00254-006-0213-5
[19] Dessalew, G., Beyene, A., Nebiyu, A., Astatkie, T. (2018). Effect of brewery spent diatomite sludge on trace metal availability in soil and uptake by wheat crop, and trace metal risk on human health through the consumption of wheat grain. Heliyon, 4(9): e00783. http://dx.doi.org/10.1016/j.heliyon.2018.e00783
[20] Sababa, E., Ndong Bidzang, F., Tehna, N., Kouamelan, A.N., Ndjigui, P.D. (2018). Evaluation of the metal trace elements (Cr, As, Pb, Zn and Cd) in water surface area of the Lom catchment area, East Cameroon: impact of semi-industrial gold mining. Science, Technology and Development, 20: 1-10.
[21] Bhattacharya, S., Dawson, D.A., Hipperson, H., Ishtiaq, F. (2019). A diet rich in C3 plants reveals the sensitivity of an alpine mammal to climate change. Molecular Ecology, 28(2): 250-265. http://dx.doi.org/10.1111/mec.14842
[22] Turekian, K.K., Wedepohl, K.H. (1961). Distribution of the elements in some major units of the earth's crust. Geological Society of America Bulletin, 72(2): 175-192. http://dx.doi.org/10.1130/0016-7606(1961)72%5B175:DOTEIS%5D2.0.CO;2
[23] Ndjigui, P.D., Bilong, P., Nyeck, B., Eno Belinga, S.M., Vicat, J.P., Gerard, M. (1999). Morphological, mineralogical and geochemical study of two lateritical profiles in the coastal plain of Douala (Cameroon). Collection GEOCAM, 2(1999): 189-201.
[24] Bongue, D., Suzuki, T., Kudo, H., Njock, M.G.K., Tokonami, S. (2019). Simultaneous indoor radon, thoron and thoron progeny measurements in betare-oya gold mining areas, eastern Cameroon. Radiation Protection Dosimetry, 1-11.
[25] NtepGweth, P., Dupuy, J.P., Matip, O., Fombulu, F.A., Nkalngui, E. (2002). Minerals Resources of Cameroon. Explanatory note to the Thematic Resource Map Minerals of Cameroon on a Geological Background, Ed. SOPECAM, Yaoundé, Cameroon, p. 375.
[26] Nzenti, J.P., Kapajika, B., Wörner, G., Lubala, T.R. (2006). Synkinematic emplacement of granitoids in a Pan-African shear zone in Central Cameroon. Journal of African Earth Sciences, 45(1): 74-86. http://dx.doi.org/10.1016/j.jafrearsci.2006.01.005
[27] Rubio, B., Nombela, M.A., Vilas, F. (2000). Geochemistry of major and trace elements in sediments of the Ria de Vigo (NW Spain): An assessment of metal pollution. Marine Pollution Bulletin, 40(11): 968-980. http://dx.doi.org/10.1016/S0025-326X(00)00039-4
[28] Szefer, P., Szefer, K., Glasby, G.P., Pempkowiak, J., Kaliszan, R. (1996). Heavy metal pollution in surficial sediments from the Southern Baltic sea of Poland. Journal of Environmental Science & Health Part A, 31(10): 2723-2754.
[29] Rashed, M.N. (2010). Monitoring of contaminated toxic and heavy metals, from mine tailings through age accumulation, in soil and some wild plants at Southeast Egypt. Journal of Hazardous Materials, 178(1-3): 739-746. http://dx.doi.org/10.1016/j.jhazmat.2010.01.147
[30] Muller, G. (1969). Index of geoaccumulation in sediments of the Rhine River. Geojournal, 2(3): 108-118.
[31] Loska, K., Wiechula, D., Korus, I. (2004). Metal contamination of farming soils affected by industry. Environment International, 30(2): 159-65. http://dx.doi.org/10.1016/S0160-4120(03)00157-0
[32] Solgi, E., Esmaili-Sari, A., Riyahi-Bakhtiari, A., Hadipour, M. (2012). Soil contamination of metals in the three industrial estates, Arak, Iran. Bulletin of Environmental Contamination and Toxicology, 88(4): 634-638. http://dx.doi.org/10.1007/s00128-012-0553-7
[33] Forstner, U., Ahlf, W., Calmano, W., Kersten, M. (1990). Sediment criteria development-contributions from environmental geochemistry to water quality management. Sediments and Environmental Geochemistry: Selected Aspects and Case Studies, 3: 11-38.
[34] Harikumar, P.S., Nasir, U.P., Rahman, M.M. (2009). Distribution of heavy metals in the core sediments of a tropical wetland system. International Journal of Environmental Science & Technology, 6(2): 225-232. http://dx.doi.org/10.1007/BF03327626
[35] Seshan, B.R.R., Natesan, U., Deepthi, K. (2010). Geochemical and statistical approach for evaluation of heavy metal pollution in core sediments in southeast coast of India. International Journal of Environmental Science & Technology, 7(2): 291-306. http://dx.doi.org/10.1007/BF03326139
[36] Mandeng, E.P.B., Bidjeck, L.M.B., Bessa, A.Z.E., Ntomb, Y.D., Wadjou, J.W., Doumo, E.P.E., Dieudonné, L.B. (2019). Contamination and risk assessment of heavy metals, and uranium of sediments in two watersheds in Abiete-Toko gold district, Southern Cameroon. Heliyon, 5(10): e02591. http://dx.doi.org/10.1016/j.heliyon.2019.e02591
[37] Ekengele, N.L, Sabine, D.D., Zo’o Zame, P., Jung, M.C. (2016). Physical and metals Impact of Traditional Gold Mining on Soils in Kombo-Laka Area (Meiganga, Cameroon). International Journal of Geosciences, 7: 1102-1121. http://dx.doi.org/10.4236/ijg.2016.79084
[38] Ekoa Bessa, A.E., Ngueutchoua, G., Ndjigui, P.D. (2018). Mineralogy and geochemistry of sediments from Simbock Lake, Yaoundé area (southern Cameroon): Provenance and environmental implications. Arabian Journal of Geosciences, 11(22): 710. http://dx.doi.org/10.1007/s12517-018-4061-x
[39] WHO, U., & UNICEF. (2011). Global HIV/AIDS response: epidemic update and health sector progress towards universal access. Progress report.
[40] Singh, M., Ansari, A.A., Müller, G., Singh, I.B. (1997). Heavy metals in freshly deposited sediments of the Gomati River (a tributary of the Ganga River): Effects of human activities. Environmental Geology, 29(3-4): 246-252. http://dx.doi.org/10.1007/s002540050123
[41] Hakanson, L. (1980). An ecological risk index for aquatic pollution control. A sedimentological approach. Water Research, 14(8): 975-1001. http://dx.doi.org/10.1016/0043-1354(80)90143-8