Reda Guerroui![]() * | Abdelhalim Benouis
* | Abdelhalim Benouis![]()
© 2023 IIETA. This article is published by IIETA and is licensed under the CC BY 4.0 license (http://creativecommons.org/licenses/by/4.0/).
OPEN ACCESS
The longevity of masonry mortar coatings is heavily influenced by their adhesion to the underlying substrate, a factor determined by multiple parameters including the nature and thickness of the mortars, as well as the substrate type and surface condition. This study explores the influence of cement mortar consistency (fluid, plastic, and firm) and thickness on adhesion to two distinct substrates - concrete and breeze block. Adhesion was evaluated using shear tests on 50×50 mm2 specimens. An adhesive failure mode was observed at the interface between the substrates and the coating mortars. Among the tested conditions, plastic consistency mortar demonstrated superior adhesion to both substrates, with breeze block exhibiting a higher degree of mortar adhesion compared to concrete. This effect was particularly pronounced at early stages, with differences ranging from 35% to 257% at 7 days, reducing to 8% to 92% at 28 days. An increase in adhesion with thickness was observed for all mortar types across both substrates, with plastic consistency mortar displaying the most significant increase, exceeding 100%. The fluid and firm mortars showed comparatively smaller increases, ranging from 8% to 67%.
mortars, consistency, substrate, roughness, capillarity, adhesion
The deterioration of the adhesion of coating mortar on masonry walls not only incurs economic cost but also threatens the preservation of a building's structural integrity and lifespan, influencing habitability, thermo-acoustic comfort, structural protection, and resistance to adverse weather and water infiltration [1]. The necessity to ascertain the sufficient resilience of a cement mortar coating on any part of a structure's facade as early and safely as possible is paramount. This industrial need makes it imperative to understand the strength and adhesion of these mortars, taking into account their composition, as well as desired physical and chemical properties. Construction generally involves elements requiring protection via a mortar coating for environmental or performance-enhancing purposes.
The mortar layer is subject to unavoidable phenomena (hydration, drying, carbonation), altering the bond between the two materials (substrate and mortar). Indeed, the microstructural changes and water movements accompanying these phenomena lead to the contraction of the mortar layer restricted by the substrate and can be responsible for a loss of adhesion to the system. While mortar cracking appears to be less radical than the complete disassociation of the mortar layer, this mode of damage can still lead to local detachment and cause a reduction in the adhesion between the two materials. The presence of micro cracks at the interface induced by restricted shrinkage is, according to several authors, the cause of adhesion losses [2-4].
Thus, in general, mortar-substrate interactions are key determinants of mortar performance and adhesion, as indicated by Nicot [4]. This adhesion of the mortar to the substrate is assessed by various tests, including the compressive shear test. It is used to assess the adhesion of repair materials [5]. The failure is not necessarily localized at the interface, and the substrate's roughness influences the failure mode. A slightly rougher layer will result in an adhesive failure along with the interface, whereas a rougher layer may result in a cohesive failure as in the pull-out test. The difference in elastic moduli between the substrate and the coating layer can generate stress concentrations and disrupt the test [6].
Adhesion, as posited by several researchers, is not attributed solely to the roughness of the substrate or the presence or absence of cracks on the surface. Instead, Valentini et al. [7] proposes that high bond strengths are also a consequence of an amplified percentage of microspores in the cement paste, which in effect, augments the contact area. Furthermore, Wu and Eamon [8] highlight the necessity of an open pore structure to facilitate adequate penetration, particularly relevant in the context of plastic concrete, to ensure optimal mechanical bonds. The deterioration of adhesion, however, is influenced by several factors. The roughness of the substrate, for instance, plays a significant role. The presence of contaminants such as formwork oil or dust can obstruct the establishment of contact adhesion. Equally, the level of water saturation of the substrate, much like the case with cracking, is crucial to the adhesion of the coating. In light of these findings, this study sets out to explore the impact of the consistency (fluid, plastic, and firm) and thickness of a cement mortar coating on its adhesion to two types of substrates, namely concrete and breeze block. Adhesion was assessed using shear tests on different mortars bonded to different substrates. With a cross-section of 50×50 mm2, the specimens provided a representative interface between the mortar and substrate.
Tests were carried out on the different mortars and their components (sands and cement) as well as their substrates (concrete and breeze blocks). The number of samples used in each test are three and the result of each test is the average obtained for the three samples.
2.1 Sands
Two types of sand were used in this study. A crushed limestone sand "SC" coming from the quarry in region of Guelma, and a dune sand "SD" coming from the region of Tebessa. These two regions are located at east of Algeria. Table1 summarizes the main characteristics of the two types of sands used in this study. These sands have properties similar to those used in other countries.
Table 1. Physical characteristics of sands (SC, SD)
|
Physical Properties |
Symbol |
SC |
SD |
|
Apparent density (Kg/m3) |
MVapp |
1650 |
1565 |
|
Absolute density (Kg/m3) |
MVabs |
2630 |
2667 |
|
Sand equivalent (piston) (℅) |
ESP |
52 |
62 |
|
Fineness modulus |
Mf |
4.2 |
2.9 |
|
Percentages of fine elements (℅) |
f |
3.1 |
2.8 |
|
Curvature coefficient |
Cc |
1.0 |
1.2 |
|
Uniformity coefficient |
Cu |
9.0 |
1.9 |
|
Density |
ρ |
2.6 |
2.7 |
|
Water content (℅) |
W |
26 |
22 |
|
Absorption coefficient (℅) |
Abs |
12.25 |
20 |
|
Friability coefficient (℅) |
Fs |
38 |
35 |
2.2 Cement
The cement used for the mortars and the concrete support is a CPJ CEM II/A 42.5, from the HdjarSoud -SKIKDA cement. It has an absolute density of 3200 Kg/m3 and a specific surface of 3300-4000 cm2/g. The chemical and mineralogical compositions, of cement and clinker, respectively, are given in Table 2.
Table 2. Chemical and mineralogical composition of cement
|
Chemical Composition |
||||||||
|
CEMII |
SiO2 |
Fe2O3 |
Al2O3 |
CaO |
MgO |
|||
|
(%) |
22-28 |
3-3.6 |
5-6 |
55-65 |
1-2 |
|||
|
SO3 |
Cl |
Na2O |
PF/PAF à 975℃ |
|||||
|
1.8-2.5 |
0-0.01 |
0.1-0.16 |
1-2 |
|||||
|
Mineralogical Composition |
||||||||
|
Phases |
C3S |
C2S |
C3A |
C4AF |
||||
|
3CaO.2SiO2 |
2CaO.2SiO2 |
3CaO.Al2O3 |
4CaO.AL2O3 Fe2O3 |
|||||
|
℅ Mass |
55-65 |
10-25 |
8-12 |
9-13 |
||||
2.3 Mixing water
The mixing water used in this research is tap water, available at the Civil Engineering and HydraulicLaboratory (LGCH) at the university 8 May 1945 (Guelma). Its temperature is between 18 and 22℃.The chemical analysis of the water is shown in Table 3 and meets all the requirements of standard [9] for mortar.
Table 3. Chemical characteristics of water (mg/l)
|
Ca |
Mg |
Na |
k |
Cl |
SO4 |
CO2 |
NO3 |
Insoluble |
PH |
|
116 |
36 |
80 |
3 |
140 |
170 |
305 |
5 |
786 |
7.9 |
2.4 Properties of the substrates
Two different supports were used in this study. These were masonry substrate (breeze block) and concrete substrate. The composition of 1m3 of the concrete base consists of 582 kg of sand, 911 kg of 15/25 gravel and 153 kg of 8/15 gravel, 315 kg of cement, and 172 liters of water. The material strengths of these two substrates are respectively 5.24 and 26.82 MPa for compression and 0.23 and 3.87 MPa for flexural tension.
2.4.1 Capillary absorption coefficient
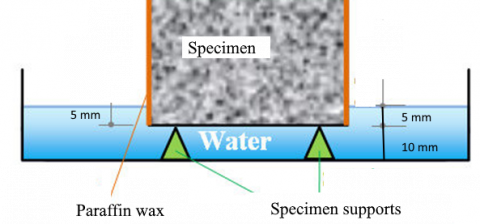
The capillary water absorption test was carried out on circular samples of 15 cm diameter and 4 cm thickness for concrete blocks and breeze blocks of 40×20×15cm3. The test procedures applied are those laid down in the standard [10]. Firstly, the specimens were left for a week in laboratory conditions to stabilize the humidity. Then, they are placed in an oven at 105℃ until they are of a constant mass. The weight of the prepared specimen mo is measured immediately before testing. The bottom side of the specimen is immersed in water (tap water) up to a depth of 5 millimeters. The water level is kept constant during the duration of the test (Figure1). To obtain a unidirectional flow, the sidewalls of the samples were covered with paraffin in several layers. The uptake of water by capillary absorption is measured through the weight of the specimens m(t) at time intervals of 0.5, 10, 20, 30, 60, 180, 360, and 1440 minutes. The water absorption of each test specimen w(t)=m(t)-mo is recorded and presented for each of the specified time intervals. Together with the absorption data, the area of the tested surface is given for each specimen. The absorption of water per unit area of the test surface [kg/m2] is calculated for the specified suction periods.
The following formula obtains the capillary absorption coefficient: Ca= $\frac{m_0-\mathrm{m}(\mathrm{t})}{\mathrm{S} \cdot \sqrt{\mathrm{t}}}$, it is expressed as $\left(\frac{\mathrm{kg}}{\mathrm{m}^2 \sqrt{\min. }}\right)$.
Figure 1. Water capillary absorption test
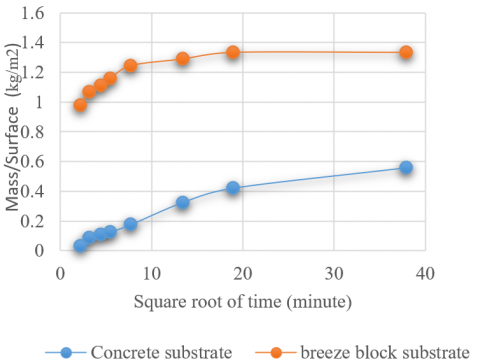
The results of the capillary absorption of the two substrates are shown in the following Figure 2.
Figure 2 presents the results of the capillary absorption of the two substrates. It can be noted that the variation of wet mass/surface area is a function of the square root of time.
Figure 2. Water absorption by capillary of substrates
The following formula obtains the capillary absorption coefficient: Ca= $\frac{m_0-\mathrm{m}(\mathrm{t})}{\mathrm{S} \cdot \sqrt{\mathrm{t}}} \ldots$ Eq. (1), it is expressed as $\left(\frac{\mathrm{kg}}{\mathrm{m}^2 \sqrt{\min } .}\right)$.
It can be noted that the breezeblock substrate has higher absorption than the concrete substrate. This difference in absorption is mainly due to the porous structure of the breeze block. The breezeblock has a capillary absorption coefficient of Ca=0,037 $\frac{\mathrm{kg}}{\mathrm{m}^2 \sqrt{\min } .}$, which is 75% higher than concrete (Ca=0.025 $\frac{\mathrm{kg}}{\mathrm{m}^2 \sqrt{\min }.}$).
3.1 Composition and properties of mortars
Table 4. Composition of the different mortars
|
|
Mortar with Dune Sand |
Mortar with the Two Sands |
||||
|
Constituents (Kg/m3) |
Firm |
Plastic |
Fluid |
Firm |
Plastic |
Fluid |
|
Cement |
450 |
450 |
450 |
450 |
450 |
450 |
|
Water |
270 |
292.50 |
337.50 |
235.25 |
258.75 |
303.75 |
|
Dune sand |
1350 |
1350 |
1350 |
675 |
675 |
675 |
|
Quarry sand |
--- |
--- |
--- |
675 |
675 |
675 |
|
w/c |
0.60 |
0.65 |
0.75 |
0.52 |
0.57 |
0.67 |
Table 5. Rheological and mechanical properties mortars
|
|
Mortar with Dune Sand |
Mortar with the Two Sands |
||||
|
Properties |
Firm |
Plastic |
Fluid |
Firm |
Plastic |
Fluid |
|
Density. (Kg/m3) |
2040 |
2040 |
2123 |
2087.5 |
2154 |
2204 |
|
Consistency (mm) |
13.09 |
15.40 |
20.82 |
12.55 |
15.53 |
20.97 |
|
Occluded air (%) |
6.76 |
6.36 |
2.56 |
6.62 |
4.71 |
2.78 |
|
Rc 7 (MPa) |
14.88 |
12.38 |
10.48 |
25.04 |
23.07 |
22.73 |
|
Rt 7 (MPa) |
4.88 |
4.33 |
2.83 |
6.07 |
5.47 |
4.25 |
|
Rc 28 (MPa) |
23.57 |
22.87 |
16.72 |
30.64 |
29.92 |
26.18 |
|
Rt 28 (MPa) |
5.83 |
5.88 |
4.82 |
7.50 |
7.08 |
6.37 |
It Is noted that mortars based on both sands (mixed sand) are used for the geobetis layer and mortar based on dune sand is used for the finishing layer.
3.2 Preparation of the substrates
First, the substrates were moistened thoroughly at several stages’ and quarterly intervals. The side to be coated was thoroughly moistened and dried on the surface. The side of the concrete substrate to be coated is pitted, wire-brushed, cleaned of dust formwork oils, and washed with water.
3.3 Execution of the coating by mortar
The different coatings by our mortars are constituted by a geobetis or bonding layer (mixed sand) and a finishing layer (dune sand). Two thicknesses were used for these different mortars (1 and 2 cm), and the test bodies were kept in water until the age of execution of the tests.
3.4 Curing method of the test block
After coating by mortar, the test blocks are stored in a room at controlled temperature and humidity until test day (28 days).
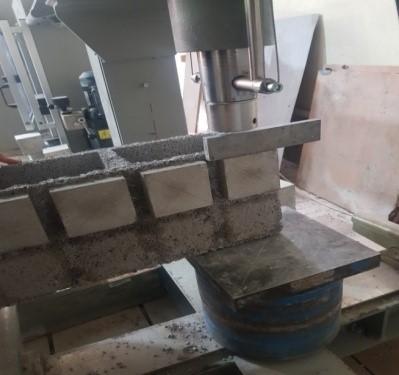
Lap-shear tests evaluated the adhesion between the different mortars and the different substrates on samples with a cross-section of 50×50 mm2 (Figure 3). The principle of the test is to apply a compressive load on either side of the interface, parallel to the interface, to stress it in shear. The disadvantage of this test is that it can lead to mixed loading of the interface (tensile/shear), as indicated by Mauroux [11].
The results present the average of tests of three samples for each mortar consistency and each type of substrate.
Figure 3. Lap-shear adherence test of mortars
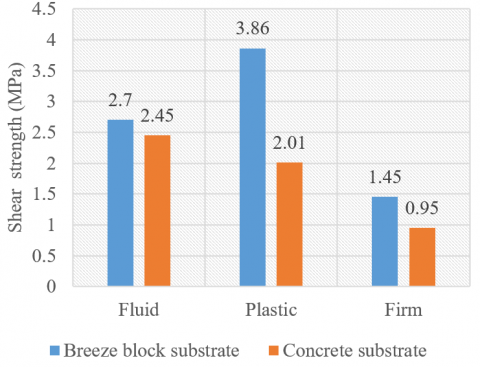
4.1 Effect of the nature of the mortar and the substrates
The failure was adhesive between the substrate and the lining mortar in the tests. The best adhesion was obtained with the plastic mortar on the breezeblock and concrete substrates (Figure 4). These 28 days shear strengths are 3.86MPa and 2.01MPa for breeze block and concrete substrates. The composition of the mortars alone cannot explain the differences between the bond strengths of the different mortars. The fluid, plastic, and firm mortars have 28 days compressive strengths of 26.18MPa, 29.92MPa, and 30.64MPa, respectively.
In contrast, their flexural tensile strengths are 6.37MPa, 7.08MPa, and 7.50MPa, respectively. Thus, the strongest mortar did not give the best bond. As stated by study [10], the adhesion between the two materials develops before the cohesion of the mortar is effective. It should be kept in mind that other parameters influence the adhesion of mortars, in particular the nature and surface of the substrate and the thickness of the mortar.
Figure 4. Shear strength of mortars at 28 days (thick=2cm)
The rough and porous surface condition of the breeze block contributed positively to the adherence of the different mortars. The breeze block substrate has better mortar adhesion than the concrete substrate. The breeze block substrate has higher mortar adhesion than the concrete substrate. The adhesion increases as the roughness of the substrate increases. The mortar, when fresh, penetrates easily into the interstices of the substrate. As Mauroux [11] indicates, increasing the complexity of the surface texture of the substrate promotes the extent of the specific surface area of the interface and thus increases adhesion. There is also another phenomenon of water exchange that occurs when a mortar is applied to a substrate. This water exchange is more or less important depending on the nature of the substrate [12]. The breeze block has a capillary water absorption coefficient 75% higher than that of substrate. Therefore, the suction by the porous substrate of the breezeblock is more important, which decreases the amount of water in the mortar.
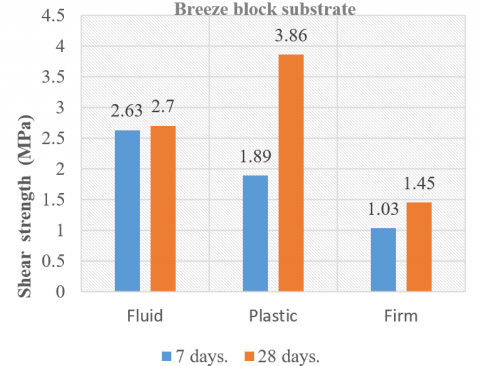
4.2 Effect of age
The evolution of the adhesion of mortars over time is affected by their composition and the nature of the substrate to which they are applied (Figures 5 and 6). Fluid mortar increases adhesion between 7 and 28 days by 3% and 147%, respectively, on breeze block and concrete substrates. These increases are 104% and 279% for plastic mortar and 41% and 25% for firm mortar. These changes are greater than the changes in the intrinsic strengths of the mortars. The increase in compressive strength of the other mortars between 7 and 28 days varies from 15 to 29%. The increase in flexural tensile strength of the mortars varies from 23 to 50%. Sadowski and Stefaniuk [13] argue that the evolution of mortar adhesion on concrete substrate tends toward an asymptotic value from the seventh (7) days after the material has been spilled. This finding was not verified by our tests.
Figure 5. Evolution of shear strength of mortars on breezeblock substrate with age (thick=2cm)
Figure 6. Evolution of shear strength of mortars on concrete substrate with age (thick=2cm)
It shows that the effect of the nature of the support is more visible at a young age. The differences vary from 35% to 257% at 7 days and only from 8% to 92% at the age of 28 days
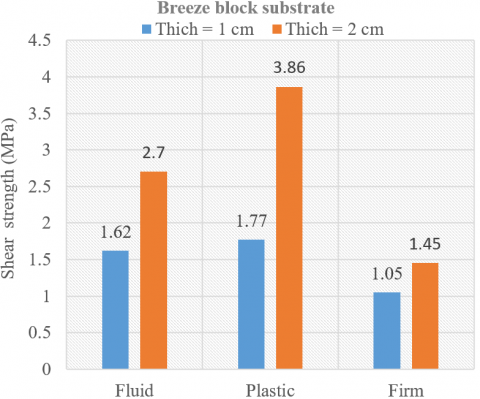
4.3 Effect of thickness
The 28 days bond strengths were determined for two mortar thicknesses (1 and 2cm). This was done for the three types of materials (fluid, plastic, and firm) and the two substrates (breeze block and concrete. For the different mortars and their substrates, an increase in adhesion with increasing thickness can be observed (Figures 7 and 8). The plastic mortar shows the highest increase, 118% for the breeze block substrate and 114% for the concrete substrate. The other two mortars have smaller increases ranging from 8% to 67%. These results contradict the results obtained by Khaldi et al. [14]. The authors indicated a decrease in the adhesion of mortars with an increasing thickness. Other research is in line with our results. The thin thickness of the mortar favors the rapid departure of water by evaporation leading to poor hydration. Travailleur [12] indicates highlighted that for a thickness of less than 20 mm, there is not enough water after 24 h of drying to ensure the hydration of the cement. In addition, we can notice the cracks resulting from drying shrinkage that can initiate delamination by edge effect at the ends, as shown by Certain et al. [15]. At the same time, a greater thickness leads to different hydration in the depth of the mortar. In addition, lower hydration of the material in the vicinity of the drying surface can be observed. Therefore, differences in the properties of the material once cured depending on the depth, as indicated by Amba et al. [16], can be noticed. Thus, the adhesion layer will have better properties.
Figure 7. Effect of thickness on the shear strength of mortars on breeze block substrate, at 28 days
Figure 8. Effect of thickness on the shear strength of mortars on concrete substrate, at 28 days
The loss of adhesion between the substrate and the coating mortar was adhesive. The results show that the plastic mortar obtains the best adhesion on the breezeblock and the concrete substrate. The composition of the mortars alone cannot explain these differences between the bond strengths of the different mortars. The rough and porous surface of the breezeblock contributed favorably to the adhesion of the different mortars. The breezeblock substrate has higher mortar adhesion than the concrete substrate. The breezeblock substrate has higher absorption than the concrete substrate, with a difference in the capillary absorption coefficient of 75%. Changes in mortar adhesion to both substrates with age are more important than changes in the intrinsic strength of the mortars. Increases in adhesion of more than 270% were obtained between 7 and 28h. Their strengths increase by 29% in compression and 50% in flexural tension. The effect of the nature of the support is more visible at a young age. The differences range from 35% to 257% at 7 days and only 8% to 92% at 28 days. There is an increase in adhesion with increasing thickness for the different mortars and their substrates. The thinness of the mortar favors the rapid departure of water by evaporation leading to incomplete hydration. Although the research materials selected are regional but the consistency and thickness of the mortars as well as the type of support are universal. Thus, the results discussed through these parameters can be generalized to mortars based on different materials but having the same parameters of this research.
The authors thank the LGCH research laboratory at the University 8 May 1945 (Guelma) and the pedagogical laboratory of the civil and hydraulic engineering department (Guelma) for their technical support during the experimental work.
|
W/C |
Water Cement Ratio |
|
t |
Time (days) |
|
CEMII |
Portland cement type |
|
SC |
Quarry sand |
|
SD |
Dune sand |
|
Ca |
Capillary absorption coefficient($\frac{\mathrm{kg}}{\mathrm{m}^2 \sqrt{\mathrm{t}}}$) |
|
MFE |
Firm mortar |
|
MPL |
Plastic mortar |
|
MFL |
Fluid mortar |
|
ESP |
Sand equivalent (piston) (℅) |
|
Mf |
Fineness modulus |
|
Fs |
Friability coefficient (℅) |
|
Rc 7 |
Lap-shear strength at 7 days (Mpa) |
|
Rc 28 |
Lap-shear strengthat 28 days (Mpa) |
[1] Salustio, J., Torres, S.M., Melo, A.C., Silva, A.J.C., Azevedo, A.C., Tavares, J.C., Leal, M.S., Delgado, J.M.P.Q. (2022). Mortar bond strength: A brief literature review, tests for analysis, new research needs and initial experiments. Materials, 15(6): 2332. https://doi.org/10.3390/ma15062332
[2] Cavaco, E., Camara, J. (2017). Experimental research on the behaviour of concrete-to-concrete interfaces subjected to a combination of shear and bending moment. Engineering Structures, 132: 278-287. https://doi.org/10.1016/j.engstruct.2016.11.041
[3] Francke, B., Piekarczuk, A. (2020). Experimental investigation of adhesion failure between waterproof coatings and terrace tiles under usage loads. Buildings, 10(3): 59. https://doi.org/10.3390/buildings10030059
[4] Bertelsen, I.M.G., Kragh, C., Cardinaud, G., Ottosen, L.M., Fischer, G. (2019). Quantification of plastic shrinkage cracking in mortars using digital image correlation. Cement and Concrete Research, 123: 105761. https://doi.org/10.1016/j.cemconres.2019.05.006
[5] Nicot, P. (2008). Mortar-substrate interactions: Determinants of mortar performance and adhesion. University of Toulouse, France. https://www.researchgate.net/publication/30759025.
[6] Zhou, J., Ye, G., van Breugel, K. (2016). Cement hydration and microstructure in concrete repairs with cementitious repair materials. Construction and Building Materials, 112: 765-772. https://doi.org/10.1016/j.conbuildmat.2016.02.203
[7] Valentini, P., Lunardi, M.P., Menegotto, C.W., Kazmierczak, C.S., Kulakowski, M.P. (2022). Methodology for evaluation of the influence of roughness and capillary absorption of ceramic blocks on the render’s tensile bond strength. Cerâmica, 68: 171-180. https:/doi.org/10.1590/0366-69132022683863202
[8] Wu, H.C., Eamon, C.D. (2017). Strengthening of concrete structures using fiber reinforced polymers (FRP): design, construction and practical applications. Woodhead Publishing, 332. https://doi.org/10.1016/B978-0-08-100636-8.00001-6
[9] NF EN 1008. (2003). Mixing water for concrete, Specifications for sampling, testing and evaluation of suitability for use, including process water in the concrete industry, such as mixing water for concrete. AFNOR. https://www.boutique.afnor.org/fr-fr/norme/nf-en-1008/.
[10] NF EN 13057. (2002). Products and systems for the protection and repair of concrete structures - Test methods - Determination of capillary absorption, AFNOR.
[11] Mauroux, T. (2011). Impact of drying on the adhesion properties between a mortar and a substrate (influence of cellulose ether admixture). University of La Rochelle, France. https://www.researchgate.net/publication/278642487.
[12] Travailleur, L. (2019). Thin film mortar-polymer composites: impact of drying and microbial colonization. Université of Paris-Est. France. http://madis-externe.ifsttar.fr/exl-php/tel-03012239.
[13] Sadowski, Ł., Stefaniuk, D. (2017). Microstructural evolution within the interphase between hardening overlay and existing concrete substrates. Applied Sciences, 7(2): 123. https://doi.org/10.3390/app7020123
[14] Khaldi, N., Belachia, M., Benouis, A. (2020). Estimation of the adherence of mortars using ultrasound. Civil and Environmental Engineering Reports, 30(2): 0185-0199. https://doi.org/10.2478/ceer-2020-0026
[15] Certain, P.V., Bissonnette, B., Bastien, J., Marchand, J., Jolin, M. (2012). Robustness of shrinkage-compensating repair concretes. Innovative Materials and Techniques in Concrete Construction, Springer, Netherlands, Greece, 291-301. https://doi.org/10.1007/978-94-007-1997-2_19
[16] Amba, J.C., Balayssac, J.P., Détriché, C. (2009). Characterisation of differential shrinkage of bonded mortar overlays subjected to drying. Materials and Structures, 43: 297-308. https://doi.org/10.1617/s11527-009-9489-8