Mohamed Fnides*![]() | Toufik Bensana
| Toufik Bensana![]() | Brahim Fnides
| Brahim Fnides![]() | Medkour Mihoub
| Medkour Mihoub![]()
© 2023 IIETA. This article is published by IIETA and is licensed under the CC BY 4.0 license (http://creativecommons.org/licenses/by/4.0/).
OPEN ACCESS
Aluminum alloys are widely recognized as highly advantageous materials for various engineering applications, including pistons, valve components, brakes, engine blocks, and impellers. In this study, our objective was to investigate the mechanical characteristics and surface behavior of the Aluminum alloy (AlSi8Cu3). To achieve this, torsion tests were conducted to analyze the material's response to shear and high deformation, while mitigating instability phenomena. Specifically, torsion tests were performed on annealed aluminum alloy specimens until rupture, at 1/3 of the rupture, and at 2/3 of the rupture to evaluate crucial material properties, such as the modulus of Young and shear modulus. Through these tests, we also examined the hardness of the specimens and analyzed the microstructural state at both the center and periphery of the deformed sections. Additionally, we determined the hardness, microstructure, and values of the strength coefficient (K) and the strain hardening exponent (n) within the plastic domain of the alloy. Our experimental results demonstrated that increasing deformation on the specimens led to a reduction in grain size. Furthermore, this deformation resulted in a decrease in Young's modulus, attributed to the initiation of cavity coalescence. Based on our investigation, we conclude that the obtained results are excellent and hold significant implications for further research in this field.
mechanical behavior, torsion, strength coefficient, strain hardening exponent, hardness, microstructure
The reactivity of materials to external stresses, both mechanical and thermal, varies considerably due to the inherent characteristics and manufacturing methodologies employed. These influences shape the evolution of a material's behavior, essential for modeling structural behaviors [1-4]. The microstructure, processes of solidification, and chemical composition significantly influence properties, casting ability, corrosion resistance, and weldability [5-9].
Aluminum, due to its non-toxicity, high thermal conductivity, low density, remarkable corrosion resistance, and ease of formation, casting, and machining, finds extensive applications [10-12]. The metal's non-sparking and non-magnetic characteristics, along with being the sixth most ductile and the second most malleable, add to its widespread usage [13]. A mechanical engineer requires a comprehensive understanding of the mechanical behavior of materials used for manufacturing various structures. Mechanical tests provide crucial data for forming process development [14]. This data elucidates the plastic behavior of materials, which is exploited to induce significant yet permanent distortion during shaping procedures like rolling and stamping. The laws governing this behavior are defined flexibly and generally, corresponding to the studied material. These behavior-modulating parameters, derived from mechanical tests, have been the subject of several studies [15].
One such study [15] demonstrated that, in a frictionless rough contact between a slug and an axisymmetric punch, the billet material flows akin to a viscous lubricant near the contact surface. This has been corroborated by experimental evidence and precise numerical modeling measurements. Izabela et al. [16] studied the hardness measurements, tensile tests, and microstructure analysis results of friction stir (FS) welded sheets of AA5083 and AA7075 alloys.
Further research by Goodall and others [17-18] proposed an empirical expression that yielded excellent results. Arfa et al. [19] based their study on the mechanical properties and the microstructure of aluminum alloys reinforced with Al7075 at 6, 9, and 12% by weight of WCCo. They used liquid metallurgy to create the composites, and SEM and EDS analyses for material characterization.
Wallgram et al. [20] observed good mechanical and metallurgical connections with flawless micrographs during microstructure, structural analysis, microhardness, and tensile testing by X-ray diffraction. Kodancha et al. [21] emphasized the importance of anisotropic variations in the compressive and tensile properties of the aluminum alloy AA2050-T84. They indicated a decrease in crack driving parameters and a stress parameter with decreasing temperature at the plate surface and the central location.
Azadi and Aroo [22] investigated the fatigue behavior of aluminum alloys in bending. They concluded that defects during the shaking molding process led to increased fatigue-corrosion and fatigue life of aluminum alloy reinforced with heat treatment and nanoparticle process by 114% and 128%, respectively, under high stress levels compared to aluminum alloy. Shahraki et al. [23] proposed a severe plastic deformation method called constrained groove compression (CGP) to study the submicrocrystalline structure in commercially pure Al, using a hollow cylindrical aluminum specimen exhibiting a semi-elliptical crack to study the variation in crack growth behavior under pure torsion loading, cyclic axial tension combined tension+torsion fatigue loading, and pure cyclic tensile loading. They found that the crack propagation paths differed with various forms of initial defects.
Shoja-Senobar et al. [24] chose Aluminum alloys AA7075 and AA6061 to study the hardness of these two alloys. They recorded the minimum hardness at around 70.1 BHN and the maximum hardness at around 121 BHN compared to 170 BHN for the base alloy. The researchers compared two plane strain finite element models of the same die-stamping process using the Abacus software, concluding that the choice between an implicit quasi-static regime and a dynamic explicit regime is not trivial.
Raufaste et al. [25] applied a severe plastic deformation method to produce an ultrafine-grained microstructure in IF, steel sheets. They used hardness, electron microscopy, and uniaxial tensile tests for evaluating the microstructure and mechanical properties of CGPed IF steel sheet. The researchers proposed a variational formulation of the contact problem in large transformations with Coulomb friction. This mixed formulation employed both the field of displacements and the field of multipliers as the unknown fields, where the weight functions were the field of virtual displacements and the field of virtual multipliers. For a particular application, heat treatment of 2205 duplex stainless steel allows the development of microstructure and properties in an efficient manner [26]. Mohammed et al. [27] used Raw Materials Alumina, Titania and Silica Fume were used to prepare Aluminum Titania /Mullite Composite.
Our work aligns with this framework, aiming to study and validate the torsion tests of annealed specimens in aluminum alloy (AlSi8Cu3) at 1/3 hardening rate. We employed a numerical model based on the finite element method to simulate torsion tests, and the results were compared with experimental data. The primary objectives were to find the correlation between the torsion test results and the numerical model and to provide a deeper understanding of the material behavior under torsion loading.
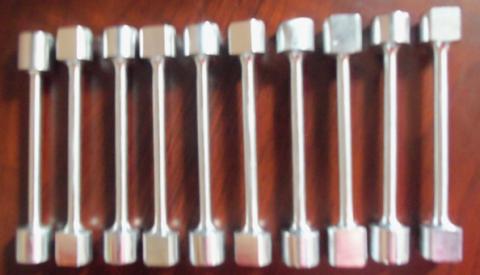
The specimens shown in Figure 1 are made of aluminum alloy of AlSi8Cu3 grade, with a diameter Ф=6mm, a total length L=115mm and an inter-dead length l=75mm.
AlSi8Cu3 is mainly used for die-cast parts (engine blocks, crankcases, cylinder heads, pipes, complex mechanical parts).
The aluminum alloy has experienced very significant development thanks in particular to its use in industries relating to transport: aviation, automotive, marine. It is also used in packaging, construction, electricity, mechanics etc.
The mechanical characteristics:
Low density: 2.7kg/dm3, Melting point: 658℃.
Low Young’s modulus: 70000 MPa.
High elongation at rupture>=1.0%.
Brinell hardness: 75.
Poisson’s ratio: 0.34.
Shear modulus: 26000MPa.
Figure 1. Test specimens for torsion
Table 1. Real chemical composition of AlSi8Cu3 alloy
|
Elements |
Percentage (%) |
|
Aluminium |
89 |
|
Silicon |
8 |
|
Copper |
3 |
Table 2. Heat treatment conditions
|
Alloy |
Heat Treatment |
Maintaining Time |
|
AlSi8Cu3 |
320℃ |
8 hours |
The chemical composition of the AlSi8Cu3 alloy is given in Table 1.
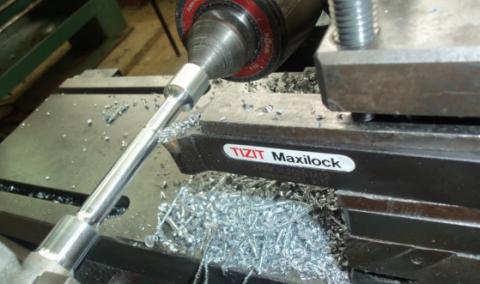
The machine tools used to machine the specimens are: a parallel lathe and a vertical milling machine.
The machines used for the heat treatment are: electric oven (controlab), micro-hardness tester and microscope.
For the heat treatment of the torsion specimens, we performed annealing with the heat treatment conditions listed in Table 2.
Heating of the electric oven to 320℃ at ±5℃.
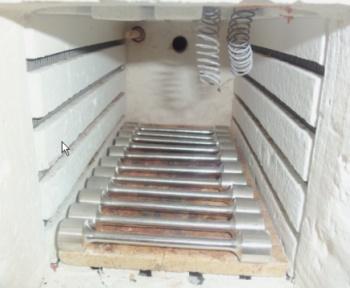
Placement of the 11 test pieces in the electric furnace (9+2 safety test pieces: see Figure 2).
Removal of the specimens from the furnace after 7 hours and 20 minutes of annealing and cooling to room temperature.
Figure 2. Arrangement of test specimens inside the oven
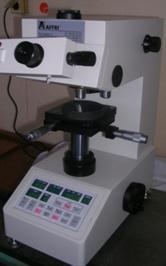
To measure the hardness of the specimens after annealing, we used a DM2D type digital hardness tester illustrated in Figure 3. The measurement is carried out in HV and will be converted into HRC.
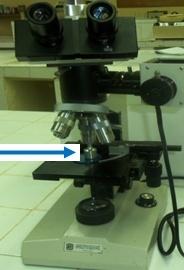
The microscope used to perform the Microstructure study is an EUROMEX microscope. The specimen is placed under the microscope objective on a micrometer table with crossed movements as shown in Figure 4.
Figure 3. Digital micro-hardness tester
Figure 4. Optical microscope (EUROMEX)
The torsion bench used is a torsion test machine, 30Nm WP 500 which is used to study the torsion of the specimens during a load until their destruction.
In addition to the equipment mentioned, we also used a caliper and a digital camera.
The machining of the aluminum alloy specimens necessary for the realization of our work, were carried out in the hall of technology within the Laboratory of metal cutting. As for the heat treatment tests (annealing) and the Microstructure study, they were carried out in the Materials Science Laboratory (SDM). The torsion tests were carried out at the Strength of materials Laboratory RDM. All tests were carried out at May 8th 1945 University, Algeria.
3.1 Torsion tests
The tests were carried out at room temperature.
Performing 3 torsion tests until failure;
Realization of 3 torsion tests at 1/3 of the rupture;
Carrying out 3 torsion tests at 2/3 of the rupture.
3.2 Heat treatment
Carrying out annealing (It aims to modify certain properties such as resistance in general).
3.3 Microstructure study
Figure 5. Polished surfaces
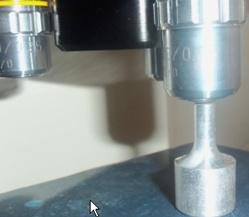
Figure 6. Hardness test
For the realization of the Microstructure studies, we proceeded to five stages:
Step 1: Cutting of the deformed specimens into two parts along the normal to the axis of the specimens.
Step 2: Polishing of the sections of the deformed specimens with sandpaper in three phases (600, 1200, and 2400), (Figure 5).
Step 3: To bring out the grains of our aluminum alloy we used the following chemical composition: Keller’s solution: 0.5ml of HF, 1.5ml of Hl, 2.5ml of HNO3, 95ml of H2O, this is to obtain a contrast between the different grains.
Stage 4: Hardness test (Figure 6), an AFFRI Microdurometer was used to observe the evolution of the hardness at the center and at the periphery of the cut section of the specimen as a function of the deformation.
This Hardness test is carried out on four specimens having undergone different deformations during torsion:
Specimen deformed at 0% rupture, Specimen deformed at 1/3% of the rupture, Specimen deformed at 2/3% of the rupture and Specimen deformed at 100% of the rupture.
Step 5: Microstructural analysis of the specimens: Taking microscopic images to see the Microstructure of the different deformed specimens.
3.4 Determination of the hardening parameters and the resistance coefficient
From Eqs. (1) and (2) (Holomon’s hardening law), we can determine the strain hardening exponent n and the strength coefficient K, by putting the natural logarithm operator on both sides of the equation, we will have:
$\sigma=\mathrm{K} .\left(\varepsilon_p\right)^n$ (1)
So: $\ln (\sigma)=\ln (K)+\mathrm{n} . \ln \left(\varepsilon_p\right)$ (2)
$\sigma$ represents the applied true stress on the material, $\varepsilon_p$ is the true strain, and K is the strength coefficient and n is the strain hardening exponent [28].
The torsion test was initially developed for the analysis of the behavior of metals under shear and at high deformation, while making it possible to avoid the phenomena of instability (constriction). In this test, the deformation of a cylindrical specimen is imposed by the rotation of one of its ends.
4.1 Evolution of the torque as a function of the angle of torsion tests
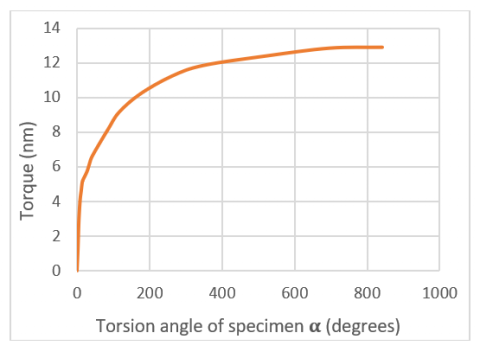
Figure 7. Evolution of the torque as a function of $\alpha$
By analyzing the graphs in Figure 7, it can be seen that the rupture of the specimens takes place after 150 revolutions of the hand, wanting of the machine, i.e., a torsion angle of the specimens equal to 871 degrees with a maximum torque of 12.5 Nm.
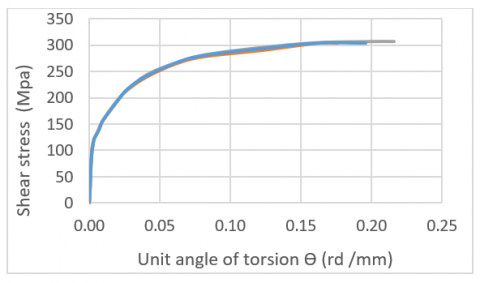
4.2 Evolution of the shearing stress according to the unit angle of torsion
Calculation of the shear stress by Eqs. (3)-(5):
$\tau_{\max }=\frac{M_t}{I_0} . \mathrm{r}$ (3)
with: $I_0=\frac{\pi. \mathrm{d}^4}{32}$ (4)
The calculation of the unit angle of torsion is given by Eq. (3).
$\theta=\frac{\alpha}{L}$ (5)
where, d: Diameter of the specimen, Mt: Torque detected by the machine, $\alpha$: Angle detected by the machine, L: Distance between jaws.
1st rupture test: $\tau_{\text {Max }}$=303.26MPa and $\theta$=0.19583rd/mm;
2nd rupture test: $\tau_{\text {Max }}$=306.68MPa and $\theta$=0.20249rd/mm;
3rd rupture test: $\tau_{\text {Max }}$=304.44MPa and $\theta$=0.17558rd/mm.
It can be seen that the average maximum tangential stress is 305 MPa and that the unit torsion angle $\theta$ is equal to 0.20rd/mm (Figure 8) [29].
Figure 8. Evolution of τmax as a function of $\theta$ (rd/mm)
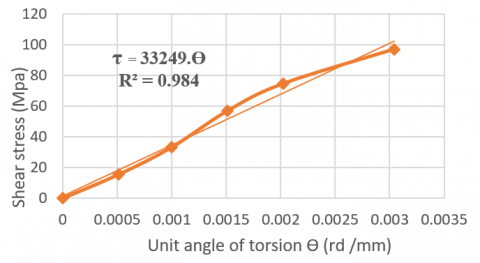
4.3 Determination of shear modulus
Figure 9. Zoom in small deformations: 1st rupture test
The analysis of the readings shows that the elastic zone present in the diagrams above consists of only two points. We cannot therefore guarantee the reliability of the measurements of the Shear and Young’s modulus.
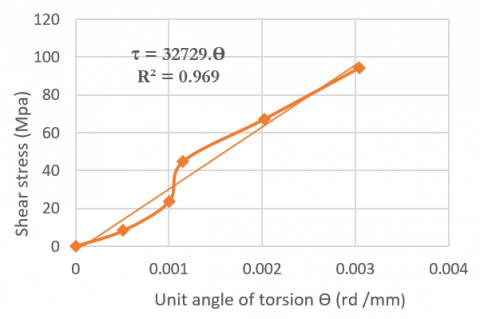
Calculated values: Shear Modulus, G varies from 32729 to 33249MPa (straight line equation of the trend curve of Figure 9 and y=36498x which corresponds to τ=G $\theta$, by identification we obtain: G1=33249MPa and G2=32729MPa) with a correlation coefficient R2 varied between 0.984÷0.969 (Figures 9 and 10). Since we have a very good superposition of the curves, the calculated values of G are the same for the other tests.
Figure 10. Zoom in small deformations: 2nd rupture test
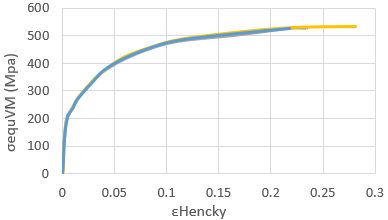
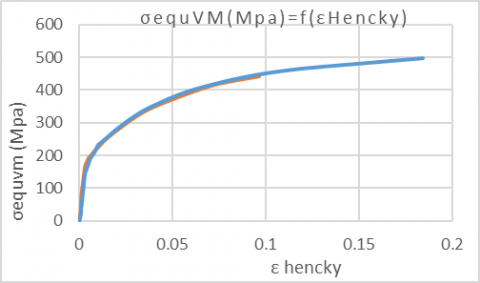
4.4 Evolution of the von mises equivalent stress as a function of the hencky strain
In order to translate this stress into equivalent tensile stress, we will diagonalise the deformation matrix applied to the specimen Eqs. (6)-(8) [30]:
$[M]=\lambda . I$ (6)
So, $\left[\begin{array}{ccc}0 & \frac{\gamma}{2} & 0 \\ \frac{\gamma}{2} & 0 & 0 \\ 0 & 0 & 0\end{array}\right]-\left[\begin{array}{lll}\lambda & 0 & 0 \\ 0 & \lambda & 0 \\ 0 & 0 & \lambda\end{array}\right]=0$ (7)
Consider the diagonalised matrix:
$[\varepsilon]=\left[\begin{array}{ccc}\frac{\gamma}{2} & 0 & 0 \\ 0 & -\frac{\gamma}{2} & 0 \\ 0 & 0 & 0\end{array}\right]$ (8)
Being in large strain, more complex definitions are required: such as logarithmic stress, Green Lagrange stress and Almansi stress. The logarithmic deformation ε, also called Hencky deformation, will therefore be used here by Eqs. (9)-(11)
$\sigma_{\text {Hencky }}=\ln \left(1+\frac{\gamma}{2}\right)$ (9)
with: $\gamma=\theta. \mathrm{r}$ (10)
For ductile materials $\sigma_{\text {equiVM }}=\tau. \sqrt{3}$ (11)
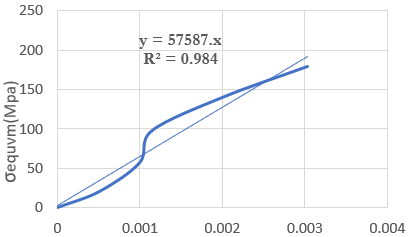
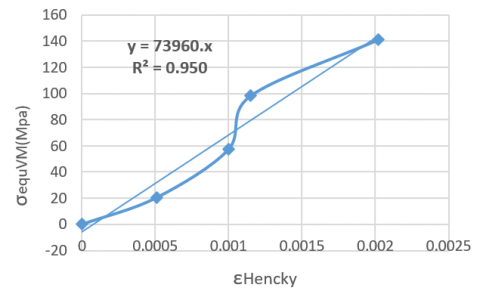
4.5 Determination of the modulus of elasticity (young)
To calculate the Young’s modulus, we take any two points and we apply Eq. (12):
$E=\frac{\sigma_{\text {equiVM } 2} \quad -\sigma_{\text {equiVM1 } }}{\varepsilon_{\text {Hencky2 }} \quad -\sigma_{\text {Henck } 12}}$ (12)
In the area of small deformations for curves: $\sigma_{\text {equiVM }}=\varepsilon_{\text {Hencky}}$ (Figure 11) and according to the equations of the trend curves of Figures 12 and 13, it can be seen that the value of the Young’s modulus E is between 57587 and 73960MPa. That is: $\mathrm{E}_{\text {Average }}$=65773.5MPa (by identification with the equation σ=E.ε) with a correlation coefficient R2 of 98.4% and 95% respectively.
For the different tests, the curves are very similar and the values of E are identical.
The comparison of the values of the mechanical characteristics determined experimentally with the values indicated in the literature (Table 3) shows that the Young’s and Coulomb’s modulus are fairly close, which can lead to significant differences between the values. It is for this reason that we smoothed the experimental curve.
(σequVM (Mpa)=Equivalent Von Mises stress, εHencky=Hencky strain)
Figure 11. Equivalent von mises stress as a function of the hencky strain
Figure 12. Zoom in small deformations first rupture test
Figure 13. Zoom in small deformations (3rd rupture test)
Table 3. Theoretical values taken from: www.matweb.com
|
Aluminum Alloy AlSi8Cu3 |
Values |
|
Brinell Hardness (HB) |
75 |
|
Elongation % |
>=1.0% |
|
Young’s Modulus |
70GPa |
|
Poisson Coefficient |
0.34 |
|
Shear Modulus |
26.0GPa |
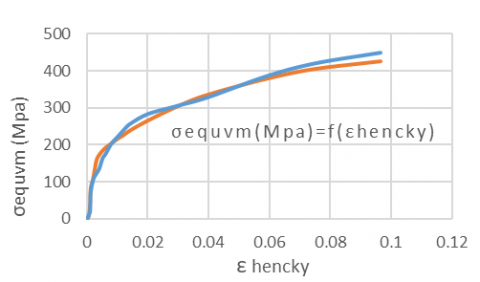
4.6 Test of torsion at 1/3 and at 2/3 of the rupture
The two tests presented in Figures 14 and 15, correspond to 1/3 and 2/3 of the elongation at rupture, i.e., 50 and 100 turns of the hand wheel. As for the first two tests, good correlation is observed.
Figure 14. Torsion test at 1/3 and at 2/3 of the rupture
Figure 15. Torsion test curves at 1/3 (2 test)
Table 4. Evaluation of hardness according to percentage of deformation
|
Deformation % |
0% |
33% |
66% |
100% Rupture |
|||||
|
Vickers Hardness at the Center |
test 1 |
79.88 |
81.00 |
96.90 |
99.40 |
86.54 |
112.75 |
86.94 |
80.46 |
|
test 2 |
82.5 |
81.75 |
74.98 |
79.24 |
72.19 |
93.37 |
94.77 |
82.62 |
|
|
test 3 |
79.88 |
80.25 |
101.11 |
98.83 |
84.90 |
104.01 |
99.63 |
114.21 |
|
|
Average Center |
80.88 HV |
90.08 HV |
92.29 HV |
93.11 HV |
|||||
|
Vickers Hardness at the Periphery |
test 1 |
79.88 |
81.00 |
100.77 |
94.99 |
79.36 |
117.20 |
94.89 |
96.12 |
|
test 2 |
82.5 |
81.75 |
98.26 |
87.70 |
85.75 |
108.11 |
102.55 |
98.10 |
|
|
test 3 |
79.88 |
80.25 |
92.48 |
102.03 |
106.63 |
88.21 |
99.33 |
91.92 |
|
|
Middle Heriphery |
80.88 HV |
96.04 HV |
97.54 HV |
97.15 HV |
|||||
|
Total Average |
80.88 HV |
93.08 HV |
95.23 HV |
95.13 HV |
|||||
4.7 Hardness test
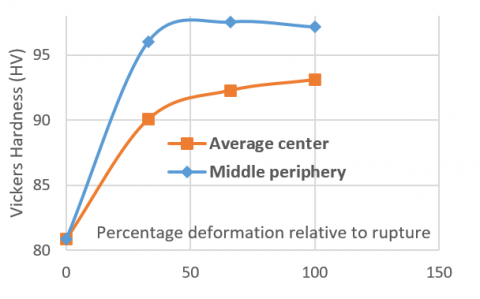
Hardness is a parameter used to characterize materials. Vickers hardness (HV) was developed in the 1920 by engineers from the Vickers Company in England. It is characterized by the imprint made by an indenter under a given load. The indenter has the shape of a square-based diamond pyramid whose opposite faces make an angle of 136°. Table 4 presents the evaluation of the HV hardness at the center and at the periphery of the specimens as a function of the percentage of deformation.
It is interesting to see the rapid increase in hardness at the start of the deformation with a rapid stabilization (Figure 16). In addition, there is a different level of hardness between the center and the periphery of the specimen. This is easily explained by a higher level of hardening on the periphery during the torsion test.
Finally, we can see a saturation of the hardness at the level of the periphery with a drop in the hardness while the hardness continues to increase in the center of the specimen.
Figure 16. Evolution of hardness (HV) according to percentage of deformation
Therefore, similar to the variation of Young’s modulus noted in the previous paragraph. This therefore confirms the beginning of the deterioration of the material and the coalescence of the cavities reducing the mechanical characteristics.
4.8 Microstructure result
Microstructure studies will only be made on annealed specimens with 33%; 66% and 100% elongation compared to the elongation at rupture.
4.8.1 Annealed specimen deformed at 33% compared to the elongation at rupture
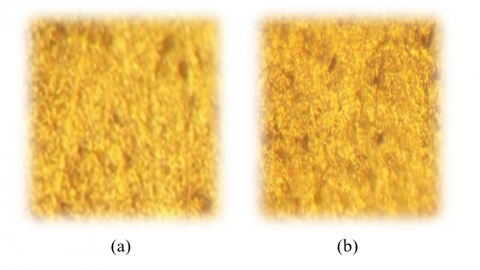
Figures 17 and 18 show the Microstructure state of a torsion specimen annealed and deformed at 33% with respect to the elongation at rupture, they show a heterogeneous of the grain size. If we analyze Figure 17a and b, we can easily guess the grains while in Figure 18, no grain is dissociable.
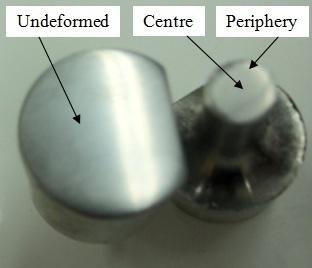
4.8.2 Undeformed annealed specimen
Figure 19 is the Microstructure state without deformation of the specimen. The grain size is significantly larger. If we analyze Figures 20-23 more carefully, we can see in the periphery of the specimen the flow of the material caused during the torsion test.
Figure 17. (a) Annealed specimen deformed at 33% (center zooms X100); (b) Annealed specimen deformed at 33% (center zooms X40)
Figure 18. Annealed specimen deformed at 33% (periphery zooms X40)
Figure 19. Undeformed annealed specimen (center zooms X40)
4.9 Determination of the strength coefficient (K) and the strain hardening exponent (n)
The tensile test is often chosen as a reference test to establish the hardening curve connecting the evolution of the elastic limit σ0 to the internal variable of hardening (the plastic equivalent strain εp).
Although the first Hollomon’s law has the advantage of being the simplest, however it presents a certain limitation in the description of the curve of work hardening for the weak deformations:
$\sigma=\mathrm{K} .\left(\varepsilon_p\right)^n$ (13)
Figure 20. Annealed specimen deformed to 66% (periphery zooms X40)
Figure 21. Annealed specimen deformed to 66% (center zooms X100)
Figure 22. Annealed specimen deformed until rupture (center zooms X10)
Figure 23. Annealed specimen deformed until rupture (periphery zooms X10)
The parameter n represents the strain hardening exponent, it takes into account the capacity of the material to deform plastically. The parameter K represents the strength coefficient of the material (expressed in MPa).
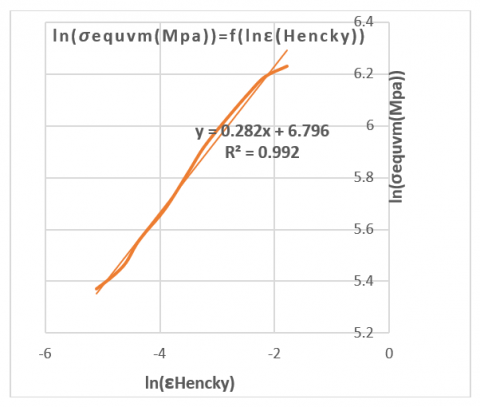
For the first rupture test (Table 5a). From Eq. (14), we obtain:
$\ln (\sigma)=\ln (K)+\mathrm{n}. \ln \left(\varepsilon_p\right)$ (14)
Consider the equation of the straight line of the trend curve obtained in Figure 24, by identifying, we have:
$\ln (\sigma)=6.796+0.282 .\ln \left(\varepsilon_p\right)$ (15)
And we have y=0.282x+6.796 (trend line equation), from where, $\ln (K)=6.796$, So: $K=894.26 \mathrm{MPa}$ and $n=0.282$, with a correlation coefficient R2=99.2%.
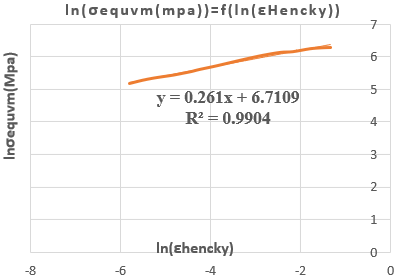
For the second rupture test (Table 5b) we obtain:
$\ln (\sigma)=\ln (K)+\mathrm{n} . \ln \left(\varepsilon_p\right)$ (16)
Consider the equation of the straight line of the trend curve obtained in Figure 25, We have: $\ln (\sigma)=6.710+0.261 . \ln \left(\varepsilon_p\right)$; From where, $\operatorname{Ln}(K)=6.710$. So: $K=820.5 \mathrm{MPa}$ and $n=0.261$ with a correlation coefficient R2=99%.
From the same procedure we find after calculation and by identification (Figure 25) we obtain that K=820.5MPa and n=0.261 and the correlation coefficient R2=99%. Table 6 shows us that the values of the strain hardening coefficientand the resistance coefficient are very close for the two first rupture tests.
Table 5a. Values of ln (σ) as a function of ln (ε)
|
Ln(εHencky) |
Ln(σequVM) |
|
-5.11 |
5.37 |
|
-4.82 |
5.42 |
|
-4.6 |
5.47 |
|
-4.42 |
5.54 |
|
-4.25 |
5.59 |
|
-3.91 |
5.68 |
|
-3.51 |
5.82 |
|
-3.23 |
5.92 |
|
-2.83 |
6.03 |
|
-2.44 |
6.13 |
|
-2.17 |
6.19 |
|
-1.79 |
6.23 |
Table 5b. Values of ln (σ) as a function of ln (ε)
|
Ln(εHencky) |
Ln(σequVM) |
|
-5.8 |
5.17 |
|
-5.51 |
5.27 |
|
-5.29 |
5.33 |
|
-5.11 |
5.37 |
|
-4.82 |
5.43 |
|
-4.6 |
5.49 |
|
-4.42 |
5.54 |
|
-4.25 |
5.6 |
|
-3.91 |
5.7 |
|
-3.51 |
5.83 |
|
-3.23 |
5.92 |
|
-2.83 |
6.04 |
|
-2.44 |
6.13 |
|
-2.17 |
6.15 |
|
-1.79 |
6.24 |
|
-1.53 |
6.27 |
|
-1.33 |
6.28 |
Figure 24. Transformation of the stress-strain curve
Figure 25. Transformation of the stress-strain curve
Table 6. Values of the strength coefficient and the strain hardening exponent
|
|
K |
n |
|
First Rupture Test |
$894.26 \mathrm{MPa}$ |
0.282 |
|
Second Rupture Test |
$820.57 \mathrm{MPa}$ |
0.261 |
Analysis of the torsion test experimental values reveals that the measurements of the shear and Young’s modulus and those suggested in are sufficient.
The examination of the experimental data from the torsion test demonstrates that the measurements of the shear and Young’s modulus and those suggested in the literature are sufficient (excellent result). The following conclusions can be drawn from the measurement of the hardness at the cross-sectional level of specimens that have undergone torsion testing for the different deformations:
This is analogous to the variation of Young’s modulus because we observe a saturation of the hardness at the level of the perimeter with a decrease in hardness, while the hardness increases towards the core of the specimen.
The total deformation is not important enough.
The beginning of the deterioration of the material and the coalescence of the cavities reduce the mechanical characteristics.
The Microstructure condition of the torsion specimens shows that the increase in deformation on the specimen causes a reduction in the size of the grains. It is very important to propose a polishing in order to minimize the surface defects which can cause the premature rupture of the specimen and to analyze the interval of the large deformations with precision, this increases the hardness. Finally, the results indicate that the scheme is feasible and useful for extracting the mechanical characteristics of aluminum alloys (AlSi8Cu3).
Special thanks to the staffs and members of Mechanics and Structures Research Laboratory (LMS) and Higher School of Technological Education in Skikda who always provide facilities that are needed in order to complete this work.
[1] Gray III, G.T. (2012). High-strain-rate deformation: mechanical behavior and deformation substructures induced. Annual Review of Materials Research, 42: 285-303. https://doi.org/10.1146/annurev-matsci-070511-155034
[2] Mishra, S., Yadava, M., Kulkarni, K.N., Gurao, N.P. (2019). A new phenomenological approach for modeling strain hardening behavior of face centered cubic materials. Acta Materialia, 178: 99-113. https://doi.org/10.1016/j.actamat.2019.08.002
[3] Alexopoulos, N.D., Pantelakis, S.G. (2004). Quality evaluation of A357 cast aluminum alloy specimens subjected to different artificial aging treatment. Materials & Design, 25(5): 419-430. https://doi.org/10.1016/j.matdes.2003.11.007
[4] Chellman, D.J., Langenbeck, S.L. (1992). Aerospace applications of advanced aluminum alloys. Key Engineering Materials, 77: 49-60. https://doi.org/10.4028/www.scientific.net/KEM.77-78.49
[5] Tisza, M., Lukács, Z. (2018). High strength aluminum alloys in car manufacturing. In IOP Conference Series: Materials Science and Engineering, IOP Publishing, 418(1): 012033. https://doi.org/10.1088/1757-899X/418/1/012033
[6] Lakshmikanthan, A., Prabhu, T.R., Udayagiri, S.B., Koppad, P.G., Gupta, M., Munishamaiah, K., Bontha, S. (2020). The effect of heat treatment on the mechanical and tribological properties of dual size SiC reinforced A357 matrix composites. Journal of Materials Research and Technology, 9(3): 6434-6452. https://doi.org/10.1016/j.jmrt.2020.04.027
[7] Shabestari, S.G., Moemeni, H. (2004). Effect of copper and solidification conditions on the microstructure and mechanical properties of Al-Si-Mg alloys. Journal of Materials Processing Technology, 153: 193-198. https://doi.org/10.1016/j.jmatprotec.2004.04.302
[8] Irizalp, S.G., Saklakoglu, N. (2014). Effect of Fe-rich intermetallics on the microstructure and mechanical properties of thixoformed A380 aluminum alloy. Engineering Science and Technology, an International Journal, 17(2): 58-62. https://doi.org/10.1016/j.jestch.2014.03.006
[9] Timelli, G., Bonollo, F. (2010). The influence of Cr content on the microstructure and mechanical properties of AlSi9Cu3 (Fe) die-casting alloys. Materials Science and Engineering: A, 528(1): 273-282. https://doi.org/10.1016/j.msea.2010.08.079
[10] Ceschini, L., Boromei, I., Morri, A., Seifeddine, S., Svensson, I.L. (2009). Microstructure, tensile and fatigue properties of the Al-10% Si-2% Cu alloy with different Fe and Mn content cast under controlled conditions. Journal of Materials Processing Technology, 209(15-16): 5669-5679. https://doi.org/10.1016/j.jmatprotec.2009.05.030
[11] Chandrashekar, J.R., Annaiah, M.H., Chandrashekar, R. (2021). Microstructure and mechanical properties of aluminum cast alloy A356 reinforced with dual-size B4C particles. Frattura ed Integrità Strutturale, 15(57): 127-137. https://doi.org/10.3221/IGF-ESIS.57.11
[12] Cheng, Y., Li, Y.X., Chen, X., Zhou, X., Wang, N.Z. (2018). Compressive properties and energy absorption of aluminum foams with a wide range of relative densities. Journal of Materials Engineering and Performance, 27: 4016-4024. https://doi.org/10.1007/s11665-018-3514-4
[13] Benedyk, J.C. (2010). Aluminum alloys for lightweight automotive structures. In Materials, Design and Manufacturing for Lightweight Vehicles, 79-113. https://doi.org/10.1533/9781845697822.1.79
[14] Wu, Z., Bei, H., Pharr, G.M., George, E.P. (2014). Temperature dependence of the mechanical properties of equiatomic solid solution alloys with face-centered cubic crystal structures. Acta Materialia, 81: 428-441. https://doi.org/10.1016/j.actamat.2014.08.026
[15] Chin Ang, K., Fai Leong, K., Kai Chua, C., Chandrasekaran, M. (2006). Investigation of the mechanical properties and porosity relationships in fused deposition modelling‐fabricated porous structures. Rapid Prototyping Journal, 12(2): 100-105. https://doi.org/10.1108/13552540610652447
[16] Kalemba, I., Dymek, S. (2016). Microstructure and properties of friction stir welded aluminium alloys. Welding International, 30(1): 38-42, https://doi.org/10.1080/09507116.2014.937611
[17] Goodall, R., Hernandez-Nava, E., Jenkins, S.N.M., Sinclair, L., Tyrwhitt-Jones, E., Khodadadi, M.A., Ip, D.H., Ghadbeigi, H. (2019). The effects of defects and damage in the mechanical behavior of Ti6Al4V lattices. Frontiers in Materials, 6: 117. https://doi.org/10.3389/fmats.2019.00117
[18] Conde, M., Henriques, J., Coppieters, S., Andrade-Campos, A. (2022). Parameter identification of swift law using a FEMU-based approach and an innovative heterogeneous mechanical test. Key Engineering Materials, 926: 2238-2246. https://doi.org/10.4028/p-1n7iop
[19] Arfa, H., Bahloul, R., BelHadjSalah, H. (2013). Finite element modelling and experimental investigation of single point incremental forming process of aluminum sheets: influence of process parameters on punch force monitoring and on mechanical and geometrical quality of parts. International Journal of Material Forming, 6: 483-510. https://doi.org/10.1007/s12289-012-1101-z
[20] Wallgram, W., Schmölzer, T., Cha, L., Das, G., Güther, V., Clemens, H. (2009). Technology and mechanical properties of advanced γ-TiAl based alloys. International Journal of Materials Research, 100(8): 1021-1030. https://doi.org/10.3139/146.110154
[21] Kodancha, K., Ekabote, N., Revankar, P.P. (2022). Elastic-plastic fracture analysis of anisotropy effect on AA2050-T84 alloy at different temperatures: a numerical study. Frattura ed Integrità Strutturale, 16(59): 78-88. https://doi.org/10.3221/IGF-ESIS.59.06
[22] Azadi, M., Aroo, H. (2021). Bending cyclic behavior and scatter-band analysis of aluminum alloys under beneficial and detrimental conditions through high-cycle fatigue regime. Frattura ed Integrità Strutturale, 15(58): 272-281. https://doi.org/10.3221/IGF-ESIS.58.20
[23] Shahraki, S., Ghanbari, B.F., Abdollahi, H. (2020). Sub-microcrystalline Al achieved by various procedures of constrained groove pressing: microstructure and mechanical properties. Engineering Solid Mechanics, 8(2): 93-104. https://doi.org/10.5267/j.esm.2019.10.005
[24] Shoja-Senobar, M., Etemadi, E., Lezgy-Nazargah, M. (2021). An analytical investigation of elastic-plastic behaviors of 3D warp and woof auxetic structures. International Journal of Mechanics and Materials in Design, 17(3): 545-561. https://doi.org/10.1007/s10999-021-09546-w
[25] Raufaste, C., Cox, S.J., Marmottant, P., Graner, F. (2010). Discrete rearranging disordered patterns: Prediction of elastic and plastic behavior, and application to two-dimensional foams. Physical Review E, 81(3): 031404. https://doi.org/10.1103/PhysRevE.81.031404
[26] Makhatha, M.E., Baruwa, A.D., Gonya, E. (2022). Grain boundary and microstructural characterization of heat-treated as-rolled 2205 duplex stainless steel. Revue des Composites et des Matériaux Avancés-Journal of Composite and Advanced Materials, Vol. 32, No. 6, pp. 285-293. https://doi.org/10.18280/rcma.320604
[27] Mohammed, A.S.S.K., Kurovics, E., Ibrahim, J.E.F.M., Tihtih, M., Simon, A., Géber, R. (2022). Preparation of an aluminum titania /mullite composite from the raw materials alumina, titania and silica fume. Revue des Composites et des Matériaux Avancés-Journal of Composite and Advanced Materials, 32(5): 223-228. https://doi.org/10.18280/rcma.320502
[28] Qin, H.L., Zhang, H., Sun, D.T., Zhuang, Q.Y. (2015). Corrosion behavior of the friction-stir-welded joints of 2A14-T6 aluminum alloy. International Journal of Minerals, Metallurgy, and Materials, 22: 627-638. https://doi.org/10.1007/s12613-015-1116-9
[29] Afrin, N., Chen, D.L., Cao, X., Jahazi, M. (2007). Strain hardening behavior of a friction stir welded magnesium alloy. Scripta Materialia, 57(11): 1004-1007. https://doi.org/10.1016/j.scriptamat.2007.08.001
[30] Chen, X.H., Lu, L. (2007). Work hardening of ultrafine-grained copper with nanoscale twins. Scripta Materialia, 57(2): 133-136. https://doi.org/10.1016/j.scriptamat.2007.03.029