Nagamadhu Mahadevappa | Vijay K. Shankar* | Samuel Sehgal | Rajath Upadhya
© 2020 IIETA. This article is published by IIETA and is licensed under the CC BY 4.0 license (http://creativecommons.org/licenses/by/4.0/).
OPEN ACCESS
Common fiber composite overlays are attractive for a few applications, (for example, aviation and flying machine auxiliary parts) because of their predominant properties and bio-degradable. Typically, mechanical drilling process parameters are significant effect final machining process outcomes. It covers drilling performance like convectional drilling, grinding, vibration-influence twist drilling, and rapid boring, drilling apparatus geometry and materials, drilling actuated delamination and its smothering methodologies, thrust power, and wear rate. This paper aimed to address the effect and ranking of process parameters on trust force, torque, and delamination at both entry and exit of the hole sisal fabric herringbone reinforced epoxy composites. The herringbone woven sisal fabric reinforced epoxy composite is fabricated using conventional compression molding technique. The result shows that at higher speed and feed rate delamination at both entrance and exit, thrust force, and toque decreases. Optimum drill diameter found from 6 to 10 mm to obtain minimum responses. As four output parameters are deciding quality of drilled hole, further grey regression analysis is used to study the ranking of output responses. Form grey regression analysis it is found that for 2700 rpm spindle speed, 60 mm/min feed and 8 mm diameter exhibit minimum effort.
sisal fabric, drilling of composite, epoxy, grey regression analysis
In recent times, composite materials have gained a lot of recognition because of their superior properties due to which they find their application in a number of fields [1, 2]. They are additionally utilized in hardware, building development, furniture, control industry, oil industry, restorative industry and in numerous other mechanical items, for example, oxygen tanks, control transmission shafts and so on [3, 4]. But with these applications, the composites need to be properly selected to avoid burning and delamination can be overcome chemical treatment [5, 6].
There were many advantages in composites such as good strength to weight ratio, high creep resistance, high wear resistance, corrosion-resistant, anisotropic and many more that is why it has strong future potential and prospects. It also depends on the composites being used, whether matrix or fiber, chemical treatments [7]. In addition to that, natural fiber-reinforced composite is eco-friendly [8-10]. There were various drawbacks in using of composites such as material costs, manufacturing difficulties, difficult to repair, inspection and testing more complex and also difficult to achieve required property in required direction [11, 12]. There were various machining processes such as drilling, milling, trimming, grinding, etc. which were used to reduce the raw materials to the desired shape and while machining, it was possible that the properties of the composite may get impaired. Among the different machining operations, drilling was one of the most prominent operations for the joining of composites to structures [13]. It is defined as an operation in which a drill bit is used to make a circular hole in a workpiece. While drilling, the fiber particles come in contact with the drill bit in an intermittent fashion, thus causing delamination of the composite material. Factors such as material thickness, drill bit diameter, spindle speed, feed rate, thrust force, torque and several other factors play a pivotal role in the drilling of reinforced composites. [14, 15]
The epoxy resin was most demanding matrix material, which is used during the preparation of composites. Epoxy was a thermosetting polymer that possesses unique mechanical and resistance properties. Epoxy resins were first commercialized in 1946 and are widely used in industry as protective coatings and for structural applications, such as laminates and composites, tooling, molding, casting, bonding and adhesives, and others [16-18]. Nagamadhu et al. also worked on dynamic mechanical analysis of composites and found that bonding strength between epoxy to sisal fabric was better even at higher temperature [12]. Saba et al. worked on thermal and dynamic mechanical properties of cellulose nanofibers reinforced epoxy composites and observed that reinforcement enhanced the thermal and dynamic mechanical properties [19]. Mohan et al. observed the water barrier properties of nano clay filled sisal fiber reinforced epoxy composites and found that mechanical properties are enhanced by adding nano clay [20]. Fiore et al. observed that mechanical properties enhanced with adding Arundo Donax fillers in epoxy [21]. It was found from the literatures that mechanical and thermo-mechanical properties were enhanced by reinforcement. But machining of natural fiber epoxy composite was major limitation due to its processing parameters. Karthikeyan et al. studied the effect of drilling process parameters of natural fiber chaired epoxy composite with polyurethane foam as core material [22]. These literatures revels that need to understand the effect of drilling process parameters on sisal fabric reinforced composites.
Taguchi technique method was implemented for the design of systems with improved quality [23, 24]. With the help of Taguchi technique, the performance characteristics can be optimized for the sensitivity of the source of the design parameters [25]. This technique can be used to improve the quality of the hole produced. The drilling processes are analyzed using statistical techniques in order to determine the effect of thrust force and torque on the geometry of the bit. Ranking and finding the most optimal solution for the problem is done using this technique.
Grey relation finds its use in different fields. With the help of these method operations with multiple performance characteristics were solved effectively. This method was used to solve problems having limited information. The model made using GRA is able to handle incomplete as well as inaccurate information [26]. It was widely used in real-world applications due to its ability to find the most optimum solution for the designed problem. Management, Engineering and many other domains make use of this method. After careful analysis, it can be said that the quality of the drilled hole depends on parameters such as delamination, torque, thrust force and many more of the drilling process. Since there has been limited research done multi responses using grey relation analysis, hence this paper aims to improve the process parameters like spindle speed, bit diameter and feed rate on drilling of herringbone epoxy composites for the output characteristics like thrust force, torque and delamination.
2.1 Materials
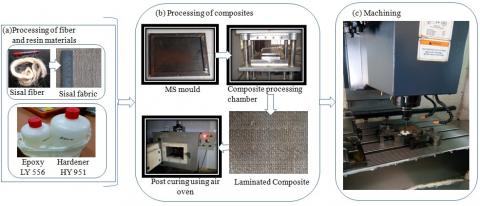
Herringbone woven type fabric shown in Figure 1(a) is prepared from the extracted sisal fiber in M/s. OM Textile Industries, Bangalore the basic properties of which are shown in Table 1. The composite is prepared by first preparing a mixture of ARALDITE LY 556 unfilled non-modified epoxy resin of low viscosity (5000-8000 MPa. s at 20℃) and pot life of ½ to 1 hours (at 20℃) and hardener HY 951 in the ratio 10:1. Once the mixture is ready it is stirred using a conventional stirrer at 50rpm to prepare the composite. The Araldite resin LY 556 with hardener HY 951 is supplied by M/s. Zenith Industrial Suppliers, Bangalore shown in Figure 1(a).
The Yarn crimp of Herringbone woven fabrics measured according to ASTM: D3883. Yarn size (linear density, yarn count) measured according to ASTM: D1907. Fabric density (number of yarns) measured according to ASTM: D3775, fabric weight (GSM) according to ASTM: D3776 and fabric thickness measured as per ASTM: D1777.
2.2 Composite fabrication
Epoxy composites are prepared using herringbone type sisal fabrics by maintaining suitable orientation with warp and weft directions 60% weight fraction of fiber. The resin is mixed with nearly 100ml of HY 951 hardener for about 5 min. Convectional compression molding technique is used to make the composite sheets shown in Figure 1(b). The trapped air bubbles are carefully removed with the help of a roller after which the mold is closed. It is then cured at room temperature for 8 hours and then post cured at 80℃ for 4 hours Figure 1(b).
Table 1. Textile properties of fabric
|
Sl. No |
Woven type |
Fabric Thickness in mm |
GSM |
Cover factor (%) |
Yarn Count in Tex |
Number of yarns per cm |
|||
|
Warp (P) |
Weft (T) |
Warp (P) |
Weft (T) |
Warp (P) |
Weft (T) |
||||
|
1 |
Herringbone (SH) |
1.43 |
402 |
88.6 |
93.8 |
242.1 |
273.1 |
11 |
12 |
The prepared herringbone epoxy composite is machined using VMC drilling machine by varying process parameters shown in Figure 1(c). To minimize the defects due to vibrations during machining the composite should be properly clamped using suitable fixtures. All precautions must be taken such as proper clamping, suitable coolant etc. to avoid the loss of properties of the composite. The VMC is programmed to follow a particular path by considering drilling bit diameter. A high-speed steel twist drill of a specific diameter is used and the composite material is subjected to drilling. Parameters such as drill diameter, spindle speed and feed rate are varied during its operation and it is tabulated in the Table 2 [27, 28].
Table 2. Levels of operational parameters
|
Levels |
Spindle speed (RPM) |
Feed rate (mm/min) |
Drill diameter(mm) |
|
Lowest |
450 |
30 |
4 |
|
Lower |
852 |
40 |
6 |
|
Medium |
1260 |
50 |
8 |
|
Higher |
1860 |
60 |
10 |
|
Highest |
2700 |
70 |
12 |
Fd =Dmax/Do (1)
where,
Dmax = Affected zone of maximum diameter;
Do= Drilled hole diameter of Actual size.
The parameters such as bit diameter, spindle speed and feed rate are varied. Five different values are considered for the study. The factors with their corresponding values for different variations is tabulated. The torque and thrust force acting on the drill bit is evaluated. The process is then optimized using Taguchi’s technique using Minitab 18.
In composite materials the input parameters should be chosen optimally since it affects the machining and geometrical characteristics of drilling operation. Grey relation theory has an easier computing technique and less processing time compared to other optimizing techniques. Using grey relation technique, the responses can be understood effectively in a problem. It provides significant data about the relationship among the sequences. With minimum data the relationship with the sequences can be studied. The results of the experiments based on Taguchi’s L25 orthogonal array is shown in Table 3.
To optimize several parameters using Grey relation technique, the following steps are stated below [28].
During the Grey relation technique, the variation in multiple output characteristics are preprocessed to a comparable data within 0-1. After the analysis the output parameters such as thrust force, delamination and torque are standardized by using given formula shown in Eq. (2).
Table 3. Taguchi L25 orthogonal array
|
Sl no |
Spindle speed (rpm) |
Feed rate (mm/min) |
Drill diameter (mm) |
Delamination factor (Fd) |
Thrust force (N) |
Torque (N-m) |
|
|
Entry |
Exit |
||||||
|
1 |
450 |
30 |
4 |
1.003 |
1.010 |
453.06 |
1.10 |
|
2 |
450 |
40 |
6 |
1.008 |
0.998 |
604.08 |
2.20 |
|
3 |
450 |
50 |
8 |
1.006 |
1.000 |
339.80 |
1.65 |
|
4 |
450 |
60 |
10 |
1.005 |
0.999 |
271.84 |
1.65 |
|
5 |
450 |
70 |
12 |
1.009 |
1.013 |
302.04 |
2.20 |
|
6 |
852 |
30 |
6 |
1.017 |
0.997 |
239.29 |
0.87 |
|
7 |
852 |
40 |
8 |
1.004 |
0.999 |
239.29 |
1.16 |
|
8 |
852 |
50 |
10 |
1.009 |
1.001 |
191.43 |
1.16 |
|
9 |
852 |
60 |
12 |
1.012 |
1.012 |
159.53 |
1.16 |
|
10 |
852 |
70 |
4 |
1.008 |
1.015 |
358.94 |
0.87 |
|
11 |
1260 |
30 |
8 |
1.000 |
1.000 |
323.62 |
1.57 |
|
12 |
1260 |
40 |
10 |
1.010 |
1.000 |
258.89 |
1.57 |
|
13 |
1260 |
50 |
12 |
1.004 |
1.009 |
242.71 |
1.77 |
|
14 |
1260 |
60 |
4 |
1.005 |
1.010 |
728.13 |
1.77 |
|
15 |
1260 |
70 |
6 |
1.013 |
1.000 |
431.49 |
1.57 |
|
16 |
1860 |
30 |
10 |
1.006 |
0.999 |
175.38 |
1.06 |
|
17 |
1860 |
40 |
12 |
1.008 |
1.011 |
146.15 |
1.06 |
|
18 |
1860 |
50 |
4 |
1.005 |
1.013 |
438.45 |
1.06 |
|
19 |
1860 |
60 |
6 |
1.008 |
0.998 |
292.30 |
1.06 |
|
20 |
1860 |
70 |
8 |
1.005 |
1.001 |
219.22 |
1.06 |
|
21 |
2700 |
30 |
12 |
1.034 |
1.017 |
88.10 |
0.64 |
|
22 |
2700 |
40 |
4 |
1.010 |
1.003 |
264.29 |
0.64 |
|
23 |
2700 |
50 |
6 |
1.007 |
1.002 |
176.19 |
0.64 |
|
24 |
2700 |
60 |
8 |
1.003 |
1.000 |
132.14 |
0.64 |
|
25 |
2700 |
70 |
10 |
1.011 |
1.002 |
120.82 |
0.73 |
|
Sl no |
Normalizing/preprocessing |
Deviation sequence data |
||||||
|
Thrust force |
Torque |
Delamination |
Thrust force |
Torque |
Delamination |
|||
|
Entry |
Exit |
Entry |
Exit |
|||||
|
1 |
0.43 |
0.71 |
0.93 |
0.33 |
0.57 |
0.29 |
0.07 |
0.67 |
|
2 |
0.19 |
0.00 |
0.76 |
0.92 |
0.81 |
1.00 |
0.24 |
0.08 |
|
3 |
0.61 |
0.35 |
0.82 |
0.83 |
0.39 |
0.65 |
0.18 |
0.17 |
|
4 |
0.71 |
0.35 |
0.85 |
0.88 |
0.29 |
0.65 |
0.15 |
0.12 |
|
5 |
0.67 |
0.00 |
0.73 |
0.21 |
0.33 |
1.00 |
0.27 |
0.79 |
|
6 |
0.76 |
0.85 |
0.51 |
1.00 |
0.24 |
0.15 |
0.49 |
0.00 |
|
7 |
0.76 |
0.67 |
0.89 |
0.90 |
0.24 |
0.33 |
0.11 |
0.10 |
|
8 |
0.84 |
0.67 |
0.74 |
0.78 |
0.16 |
0.33 |
0.26 |
0.22 |
|
9 |
0.89 |
0.67 |
0.66 |
0.25 |
0.11 |
0.33 |
0.34 |
0.75 |
|
10 |
0.58 |
0.85 |
0.78 |
0.08 |
0.42 |
0.15 |
0.22 |
0.92 |
|
11 |
0.63 |
0.40 |
1.00 |
0.83 |
0.37 |
0.60 |
0.00 |
0.17 |
|
12 |
0.73 |
0.40 |
0.71 |
0.83 |
0.27 |
0.60 |
0.29 |
0.17 |
|
13 |
0.76 |
0.28 |
0.88 |
0.38 |
0.24 |
0.72 |
0.12 |
0.62 |
|
14 |
0.00 |
0.28 |
0.85 |
0.33 |
1.00 |
0.72 |
0.15 |
0.67 |
|
15 |
0.46 |
0.40 |
0.61 |
0.83 |
0.54 |
0.60 |
0.39 |
0.17 |
|
16 |
0.86 |
0.73 |
0.82 |
0.88 |
0.14 |
0.27 |
0.18 |
0.12 |
|
17 |
0.91 |
0.73 |
0.78 |
0.29 |
0.09 |
0.27 |
0.22 |
0.71 |
|
18 |
0.45 |
0.73 |
0.85 |
0.21 |
0.55 |
0.27 |
0.15 |
0.79 |
|
19 |
0.68 |
0.73 |
0.76 |
0.92 |
0.32 |
0.27 |
0.24 |
0.08 |
|
20 |
0.80 |
0.73 |
0.85 |
0.77 |
0.20 |
0.27 |
0.15 |
0.23 |
|
21 |
1.00 |
1.00 |
0.00 |
0.00 |
0.00 |
0.00 |
1.00 |
1.00 |
|
22 |
0.72 |
1.00 |
0.71 |
0.71 |
0.28 |
0.00 |
0.29 |
0.29 |
|
23 |
0.86 |
1.00 |
0.80 |
0.75 |
0.14 |
0.00 |
0.20 |
0.25 |
|
24 |
0.93 |
1.00 |
0.93 |
0.83 |
0.07 |
0.00 |
0.07 |
0.17 |
|
25 |
0.95 |
0.94 |
0.68 |
0.73 |
0.05 |
0.06 |
0.32 |
0.27 |
|
Sl no |
Grey relational coefficient |
Grey Relational Grade |
Rank/order |
|||
|
Thrust force |
Torque |
Delamination |
||||
|
Entry |
Exit |
|||||
|
1 |
0.467 |
0.630 |
0.872 |
0.429 |
0.599 |
18 |
|
2 |
0.383 |
0.333 |
0.672 |
0.857 |
0.561 |
23 |
|
3 |
0.560 |
0.436 |
0.732 |
0.750 |
0.619 |
16 |
|
4 |
0.635 |
0.436 |
0.774 |
0.811 |
0.664 |
13 |
|
5 |
0.599 |
0.333 |
0.651 |
0.387 |
0.493 |
24 |
|
6 |
0.679 |
0.772 |
0.506 |
1.000 |
0.739 |
5 |
|
7 |
0.679 |
0.600 |
0.820 |
0.828 |
0.732 |
6 |
|
8 |
0.756 |
0.600 |
0.655 |
0.698 |
0.677 |
11 |
|
9 |
0.818 |
0.600 |
0.594 |
0.400 |
0.603 |
17 |
|
10 |
0.542 |
0.772 |
0.695 |
0.353 |
0.590 |
19 |
|
11 |
0.576 |
0.456 |
1.000 |
0.750 |
0.695 |
10 |
|
12 |
0.652 |
0.456 |
0.631 |
0.750 |
0.622 |
15 |
|
13 |
0.674 |
0.409 |
0.804 |
0.444 |
0.583 |
20 |
|
14 |
0.333 |
0.409 |
0.774 |
0.429 |
0.486 |
25 |
|
15 |
0.482 |
0.456 |
0.562 |
0.750 |
0.562 |
22 |
|
16 |
0.786 |
0.648 |
0.740 |
0.811 |
0.746 |
4 |
|
17 |
0.846 |
0.648 |
0.695 |
0.414 |
0.651 |
14 |
|
18 |
0.477 |
0.648 |
0.774 |
0.387 |
0.572 |
21 |
|
19 |
0.610 |
0.648 |
0.672 |
0.857 |
0.697 |
9 |
|
20 |
0.709 |
0.648 |
0.774 |
0.686 |
0.704 |
8 |
|
21 |
1.000 |
1.000 |
0.333 |
0.333 |
0.667 |
12 |
|
22 |
0.645 |
1.000 |
0.631 |
0.632 |
0.727 |
7 |
|
23 |
0.784 |
1.000 |
0.719 |
0.667 |
0.793 |
2 |
|
24 |
0.879 |
1.000 |
0.872 |
0.750 |
0.875 |
1 |
|
25 |
0.907 |
0.895 |
0.608 |
0.652 |
0.766 |
3 |
where,
yoi(p) = Sequence of original value;
y*i(p) = the sequence value after data-preprocessing;
maxy*i(p) = the maximum value of yio(p);
miny*i(p) = the maximum value of yio(p);
yo = the desired value.
Eq. (2) shows the original responses for “lesser-the better" characteristics are preprocessed and tabulated in Table 4. The variation of sequence data can be calculated from the preprocessed data to a comparable value within 0-1. Δmax is considered as 1 and Δmin is considered as 0. The Grey coefficient ξ(p) can be determined by the below mentioned equation:
$\xi(\mathrm{p})=\frac{\Delta_{\min }+\xi \Delta_{\max }}{\Delta \operatorname{Oi}(p)+\xi \Delta_{\max }}$ (3)
where,
$\Delta_{\mathrm{oi}}=$ The absolute difference between yi0(p) and yi*(p), in other words called as deviation sequence. $\xi$ coefficient used, if the $\xi$ has a larger value. But in common the value of $\xi$ is considered as 0.5.
$\Delta_{\mathrm{oi}}=\left\|\mathrm{y}_{0}^{*}(\mathrm{p})-\mathrm{y}_{\mathrm{i}}^{0}(\mathrm{p})\right\|$ (4)
$\Delta_{\min }=\left(\begin{array}{c}\left.\min _{\forall j \in i}\right)\left(\min _{\forall p}\right)\left\|\mathrm{y}_{0}^{*}(\mathrm{p})-\mathrm{y}_{\mathrm{j}}^{*}(\mathrm{p})\right\|\end{array}\right.$ (5)
$\Delta_{\max }=\left(\begin{array}{l}\left.\max _{\forall j \in i}\right)\left(\max _{\forall p}\right)\left\|\mathrm{y}_{0}^{*}(\mathrm{p})-\mathrm{y}_{i}^{*}(\mathrm{p})\right\|\end{array}\right.$ (6)
Grey relation grade is the average of grey relational coefficient of each sequence. It is calculated from Eq. (7) as shown below:
$\gamma_{\mathrm{i}}=\frac{1}{n} \sum_{p=1}^{n} \xi i(p)$ (7)
It is quite possible that the significant factors in the real world may change according to their circumstance of unequal weight for various factors. Hence the GRG value can be calculated using Eq. (8):
$\gamma_{i}=\frac{1}{n} \sum_{p=1}^{n} w_{p} \xi_{i}(p)$ (8)
where, wp = normalized weight of factor p, when, wp is considered as equal for all the factors in the problem. The grey coefficient was determined using the Eq. (3) and GRG value by Eq. (8) and is tabulated in Table 5.
4.1 Grey regression analysis
The drilling operation was conducted and 25 holes were drilled with varying input process parameters. It was observed that input parameters such as feed rate, spindle speed and drill diameter affected the quality of the drilled hole. By varying the parameters, different values for thrust force and torque were obtained while drilling the specimen. One of the major factors affecting the quality of the drilled hole was the delamination factor which is dependent on the input process parameters. Hence different output values are obtained for the 25 drilled holes having varying input parameters, which are tabulated in Table 3 using Taguchi’s L 25 orthogonal array.
The 25 trials are listed according to their ranks. The grey relation coefficient and grey relation grade was first calculated for all 25 trials by using the values from Table 3 and set of formulas from Eqns. (2)-(8), the values of which have been shown in Table 5. The trial having the greatest grey relational grade is ranked 1. The trial having the second greatest value is ranked 2 and the procedure is followed for all 25 trials.
The value of grey relational grade is higher for trial 24 and the values corresponding to it are the optimal values for improving the quality of the drilled hole. It is found that the maximum value of grey relational grade is 0.875 for which the spindle speed is 2700 rpm, feed rate is 60mm/min and the drill diameter is 8mm. Thus, selecting these optimal input values will reduce the parameters affecting the quality of the drilled hole thereby achieving a drilled hole of improved quality and also enhancing the life of the tool [29].
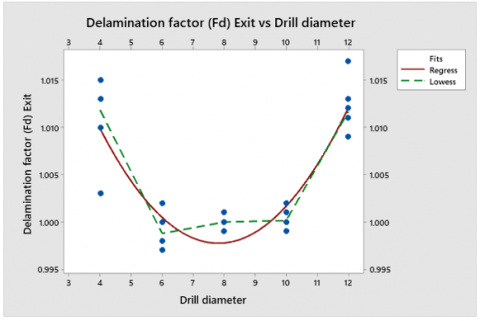
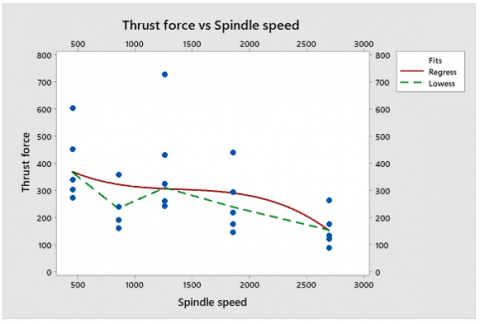
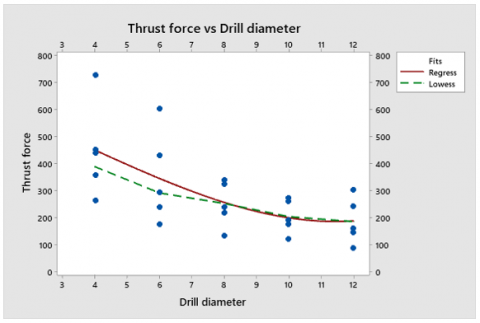
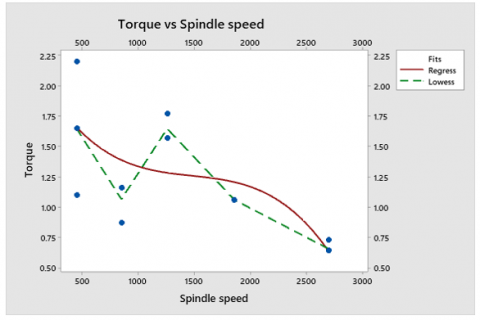
The influences of input variables on output responses are analyzed and only few graphs are plotted here to show the significance. Figure 2(a) to 2(d) shows the significantly varied input variable and output response. Figure 1(a) shows the variation of delamination factor at exit of hole over a range of drill diameter. It is found that drill diameter is from 6 to 10 mm exhibit lesser defect at exit of the hole. This may due to following (a) drill diameter is less then 6mm and more then 10mm will tears the fiber during drilling and forms delamination as fiber yarns are herringbone pattern [30, 31], (b) gram per square meter of the fabric is high, (c) yarn crimp of the fabric is higher, (d) yarn linear density of the fabric (e) yarn count of the fabric. Figure 2(b) shows the variations of thrust force on spindle speed, found that as spindle speed increased the thrust force decreases. Figure 2(c) variations of thrust force on drill diameter and found that as drill diameter increases thrust force decreases. Figure (d) shows the variations of torque on spindle speed and found as the spindle speed increases torque decreases [32, 33].
(a) Influence of drill diameter on delamination factor at exit of hole
(b) Influence of thrust force on Spindle speed
(c) Influence of thrust force on drill diameter
(d) Influence of spindle torque on spindle speed
Figure 2. Influence of operational parameters on drilling performance
The experiment on drilling of sisal fiber reinforced herringbone epoxy composite material is conducted, the delamination factor is analyzed and the following conclusions are drawn:
1. By varying the cutting parameters, the delamination factor for sisal fiber reinforced herringbone epoxy composite material is observed and analyzed.
2. The result obtained indicates that the value of output characteristics decreases with increasing spindle speed, increasing feed rate and selecting a slightly larger drill bit diameter.
3. The optimum drill diameter was found from 6mm to 10mm to reduce the delamination at both entrance and exit of the hole
4. The decrease of drill diameter increases the delamination due to the increase of Thrust Force developed on the drill bit during drilling. Thus, it is suggested to use a slightly bigger drill bit for this fiber.
5. The spindle speed is having only limited effect on drilling of sisal fiber reinforced chaired epoxy composite materials in which higher spindle speed is preferred to reduce the delamination.
Hence, from the entire experiment, it is found that spindle speed of 2700 rpm, feed rate of 60mm/min and drill diameter of 8mm are the optimal values for the drilling of sisal fiber reinforced herringbone epoxy composite material.
[1] Dittenber, D.B., Ganga Rao, H.V.S. (2012). Critical review of recent publications on use of natural composites in infrastructure. Composite Part A: Applied Science and Manufacturing, 43(8): 1419-1429. https://doi.org/10.1016/j.compositesa.2011.11.019
[2] Nagamadhu, M., Pitchaimani, J., Channabasappa, M.K.G. (2019). Mechanical and tribological behavior of woven sisal fabric. Tribology in Industry, 41(4): 622-633. https://doi.org/10.24874/ti.2019.41.04.14
[3] Gibson, R.F. (2010). A review of recent research on mechanics of multifunctional composite materials and structures. Composite Structure, 92(12): 2793-2810. https://doi.org/10.1016/j.compstruct.2010.05.003
[4] Pickering, S.J. (2006). Recycling technologies for thermoset composite materials current status. Composite Part A: Applied Science and Manufacturing, 37(8): 1206-1215. https://doi.org/10.1016/j.compositesa.2005.05.030
[5] Sathishkumar, S., Suresh, A.V., Nagamadhu, M., Krishna, M. (2017). The effect of alkaline treatment on their properties of Jute fiber mat and its vinyl ester composites. Materials Today: Proceedings, 4(2): 3371-3379. https://doi.org/10.1016/j.matpr.2017.02.225
[6] Gunge, A., Koppad, P.G., Nagamadhu, M., Kivade, S.B., Shivananda Murthy, K.V. (2019). Study on mechanical properties of alkali treated plain woven banana fabric reinforced biodegradable composites. Composites Communications, 13: 47-51. https://doi.org/10.1016/j.coco.2019.02.006
[7] Gunge, A., Kivade, S.B., Nagamadhu, M., Rajole, S. (2019). Mechanical properties of chemically treated woven banana/polyvinyl alcohol composites. Emerging Materials Research, 8(4): 638-643. https://doi.org/10.1680/jemmr.18.00028
[8] Channabasappa, M.K.G., Pitchaimani, J., Nagamadhu, M. (2019). Dynamic mechanical analysis of glutaraldehyde cross linked polyvinyl alcohol under tensile mode. AIP Conference Proceedings, 2057: 020017. https://doi.org/10.1063/1.5085588
[9] Channabasappa, M.K.G., Pitchaimani, J., Nagamadhu, M. (2020). Influence of glutaraldehyde crosslinker on dynamic properties of polyvinyl alcohol polymer. Emerging Materials Research, 9(1): 1-13. https://doi.org/10.1680/jemmr.18.00059
[10] Sanjay, M.R., Madhu, P., Jawaid, M., Senthamaraikannan, P., Senthil, S., Pradeep, S. (2018). Characterization and properties of natural fiber polymer composites: A comprehensive review. Journal of Cleaner Production, 172: 566-581. https://doi.org/10.1016/j.jclepro.2017.10.101
[11] Somashekhar, S., Shanthakumar, G.C., Nagamadhu, M. (2020). Influence of fiber content and screw speed on the mechanical characterization of Jute fiber reinforced Polypropylene composite using Taguchi Method. Materials Today Proceedings, 24(4): 2366-2374. https://doi.org/10.1016/j.matpr.2020.03.766
[12] Nagamadhu, M., Jeyaraj, P., Mohan Kumar, G.C. (2019). Characterization and mechanical properties of sisal fabric reinforced polyvinyl alcohol green composites: Effect of composition and loading direction. Material Research Express, 6(12): 125320. https://doi.org/10.1088/2053-1591/ab56b3
[13] Nagamadhu, M., Jeyaraj, P., Mohan Kumar, G.C. (2019). Influence of textile properties on dynamic mechanical behavior of epoxy composite reinforced with woven sisal fabrics. Sādhanā, 45(14): 1-10. https://doi.org/10.1007/s12046-019-1249-z
[14] Sathishkumar, S.R., Suresh, A.V., Nagamadhu, M. (2019). Optimization of drilling parameters of untreated JFRP polyurethane foam sandwich structures by Taguchi method. Emerging Materials Research, 8(3): 1-9. https://doi.org/10.1680/jemmr.18.00055
[15] Sathish Kumar, S., Suresh, A., Nagamadhu, M., Vitala, H.R., Dileep, B.P. (2019). Optimization of drilling parameters on Alkaline treated jute fiber sandwich material. International Journal of Recent Technology and Engineering (IJRTE), 8(3): 2454-2459. https://doi.org/10.35940/ijrte.c4693.098319
[16] Chee, S.S., Jawaid, M., Sultan, M.T.H., Alothman, O.Y., Abdullahad, L.C. (2019). Thermomechanical and dynamic mechanical properties of bamboo/woven kenaf mat reinforced epoxy hybrid composites. Composites Part B: Engineering, 163: 165-174. https://doi.org/10.1016/j.compositesb.2018.11.039
[17] Chee, S.S., Jawaid, M., Sultan, M.T.H. (2017). Thermal stability and dynamic mechanical properties of kenaf/bamboo fibre reinforced epoxy composites. BioResources, 12(4): 7118-7132.
[18] Chhetri, S., Samanta, P., Murmu, N.C., Srivastava, S.K., Kuila, T. (2016). Effect of dodecyal amine functionalized graphene on the Mechanical and thermal properties of epoxy-based composites. Polymer Engineering, and Science, 56(11): 1221-1228. https://doi.org/10.1002/pen.24355
[19] Saba, N., Safwan, A., Sanyang, M.L., Mohammad, F., Pervaiz, M., Jawaid, M., Alothman, O.Y., Sain, M. (2017). Thermal and dynamic mechanical properties of cellulose nanofibers reinforced epoxy composites. International Journal of Biological Macromolecules, 102: 822-828. https://doi.org/10.1016/j.ijbiomac.2017.04.074
[20] Mohan, T.P., Kanny, K. (2011). Water barrier properties of nanoclay filled sisal fibre reinforced epoxy composites. Composites Part A: Applied Science and Manufacturing, 42(4): 385-393. https://doi.org/10.1016/j.compositesa.2010.12.010
[21] Fiore, V., Scalici, T., Vitale, G., Valenza, A. (2014). Static and dynamic mechanical properties of Arundo Donax fillers-epoxy composites. Materials & Design, 57: 456-464. https://doi.org/10.1016/j.matdes.2014.01.025
[22] Karthikeyan, K., Nagamadhu, M., Jaiprakash, M., Kiran, Sheriff, M. (2020). Effect of drilling parameters on natural fiber reinforced with chaired epoxy poly urethane foam composites using grey relational analysis. Materials Today Proceedings, 24(4): 2193-2203. https://doi.org/10.1016/j.matpr.2020.03.677
[23] Siddiquee, A.N., Khan, Z.A., Goel, P., Kumar, M., Agarwal, G., Khan, N.Z. (2014). Optimization of deep drilling process parameters of AISI 321 steel using taguchi method. Procedia Materials Science, 6: 1217-1225. https://doi.org/10.1016/j.mspro.2014.07.195
[24] Samavi, J., Goharimanesh, M., Akbari, A., Dezyani, E. (2018). Optimisation of drilling parameters on St37 based on Taguchi method. Journal of the Brazilian Society of Mechanical Sciences and Engineering, 40(8): 370. https://doi.org/10.1007/s40430-018-1245-y
[25] Singh, A.P., Sharma, M. (2013). Modelling of thrust force during drilling of fibre reinforced plastic composites. Procedia Engineering, 51: 630-636. https://doi.org/10.1016/j.proeng.2013.01.089
[26] Shariff, M., Nagamadhu, M., Jaiprakash, M., Karthikeyan, K., Kiran. (2020). Effect of drilling process parameters on natural fiber reinforced basket epoxy composites using grey relational analysis. Materials Today Proceedings, 24(4): 2255-2264. https://doi.org/10.1016/j.matpr.2020.03.677
[27] Kiran, Nagamadhu, M., Jaiprakash, M., Karthikeyan, K., Sheriff, M. (2020). Study the impact of drilling process parameters on natural fiber reinforced chaired epoxy composites. Materials Today Proceedings, 24(4): 2204-2218. https://doi.org/10.1016/j.matpr.2020.03.678
[28] Jaiprakash, M., Nagamadhu, M., Karthikeyan, K., Kiran, Sheriff, M. (2020). Effect of drilling parameters on Neem wood veneer epoxy composites using grey relational analysis. Materials Today Proceedings, 24(4): 2163-2173. https://doi.org/10.1016/j.matpr.2020.03.674
[29] Shankar, V.K., Kunar, B.M., Murthy, C.H., Ramesh, M.R. (2020). Measurement of bit-rock interface temperature and wear rate of the tungsten carbide drill bit during rotary drilling. Friction, 8(6): 1073-1082. https://doi.org/10.1007/s40544-019-0330-2
[30] Shankar, V.K., Kunar, B.M., Murthy, C.S.N. (2020). ANN model for prediction of bit–rock interface temperature during rotary drilling of limestone using embedded thermocouple technique. Journal of Thermal Analysis and Calorimetry, 139: 2273-2282. https://doi.org/10.1007/s10973-019-08646-2
[31] Shankar, V.K., Kunar, B.M., Murthy, C.S.N. (2020). Temperature measurement during rotary drilling of rocks - A statistical approach. In: Satapathy S., Raju K., Molugaram K., Krishnaiah A., Tsihrintzis G. (eds) International Conference on Emerging Trends in Engineering (ICETE). Learning and Analytics in Intelligent Systems, vol 2. Springer, Cham. https://doi.org/10.1007/978-3-030-24314-2_38
[32] Shankar, V.K., Kunar, B.M., Murthy, C.S. (2018). Experimental investigation and statistical analysis of operational parameters on temperature rise in rock drilling. International Journal of Heat and Technology, 36(4): 1176-1180. https://doi.org/10.18280/ijht.360403
[33] Vijay Kumar, S., Murthy, C.S., Kunar, B.M. (2018). Effect of thermal response on physical properties during drilling operations-A Case study. Materials Today Proceedings, 5(2): 7404-7409. https://doi.org/10.1016/j.matpr.2017.11.411