Zhaoyu Wu* | Guang Wen | Yong Han
© 2020 IIETA. This article is published by IIETA and is licensed under the CC BY 4.0 license (http://creativecommons.org/licenses/by/4.0/).
OPEN ACCESS
This paper mainly explores how the addition of yttrium (Y) affects the grain growth and oxidation resistance of Fe-Cr-Al electrothermal alloy under high temperatures. Firstly, five groups of Y-free samples of Fe-Cr-Al electrothermal alloy were prepared through hot forging, hot rolling and cold rolling, and each group was doped with different amounts of Y and treated at several temperature levels. The element distribution and cross-sectional morphology of the oxide film were obtained by scanning electron microscopy (SEM). The evolution of the oxide film was monitored in backscattering Raman configuration. According to the surface and cross-sectional morphologies and X-ray diffraction (XRD) spectra, it is concluded that the addition of Y can refine the grain size, inhibit the grain growth and improve the oxidation resistance of Fe-Cr-Al alloy under high temperature, creating a continuous dense layer of oxide film on the matrix; the density and continuity of the film can be improved by adding a trace amount of Y (0.1wt.%). In this case, the film will adhere to the matrix more tightly, reducing the oxidation rate. However, a high Y dose (³0.4wt.%) will thicken the oxide film and reduce the oxidation resistance of the alloy. The optimal dose of Y is 0.1wt.% for the Fe-Cr-Al alloy. The research results provide a reference for improving the performance of Fe-Cr-Al alloy with rare earth (RE) elements.
grain growth, oxidation resistance, electrothermal alloy, yttrium (Y)
Fe-Cr-Al electrothermal alloy is a special material of heat-resistant steel. Despite its resistance to high-temperature oxidation, Fe-Cr-Al electrothermal alloy faces a short service life under the effects of oxidative corrosion, which clearly restricts its application and development at high temperature.
If the alloy is exposed to high temperature for a long time, Al2O3 film will soon appear on the surface. The oxidative film is easy to wrinkle and peel off, ceasing to protect the alloy. Once the Al content falls below a threshold, the Al2O3 protective film will no longer form on the alloy.
The traditional Fe-Cr-Al electrothermal alloys mainly include 1Cr13Al4, 0Cr13Al6Mo2, and 0Cr27Al17Mo2, which are suitable for low-, medium- and high-temperature resistance furnace, respectively [1-4]. Recently, some novel Fe-Cr-Al electrothermal alloys have been developed, namely, 0Cr27Al7Mo2, for ultra-high temperature environment (up to 1,350℃).
Fe-Cr-Al electrothermal alloy directly bears on the performance of industrial electric furnaces. New Fe-Cr-Al electrothermal alloys are urgently needed to enhance the strength, processing ability and oxidation resistance of such furnaces under high temperature.
Many scholars have attempted to modify Fe-Cr-Al electrothermal alloy with rare earth (RE) elements, which have long been applied in steel smelting. The RE can refine the grains of the alloy: In the liquid steel, the RE solidifies within the dendrite network or on the grain boundaries, especially on the solid-liquid interface; the accumulation of the RE intensifies the branching and promotes the dendritic growth. In this way, the spacing between secondary dendrites decreases, resulting in refined grains [5-8].
This paper aims to disclose how the addition of yttrium (Y), a RE element, affects the recrystallization, grain growth and oxidation resistance of Fe-Cr-Al electrothermal alloy. Therefore, several experiments were carried out to analyse the properties of Fe-Cr-Al electrothermal alloy doped with different amounts of Y. The research results help to optimize the production and promote the industrial application of Fe-Cr-Al electrothermal alloy.
2.1 Sample preparation
A piece of 25kg Fe-Cr-Al electrothermal alloy (diameter: 90mm) was prepared through argon-shielded vacuum induction melting (VIM) in our lab. The alloy was hot forged into a stick of 40mmtick was m: length).
Next, the hot-forged stick was cut into several 40mmngth). Nextsmall sticks. After that, each small stick was hot-rolled into a 6mm-thick plate under 900-1,099°C, and then air cooled. Finally, the hot-rolled plates were cold-rolled at room temperature into 4.5mm- and 3mm-thick sheets.
The nitrogen (N) content of the sheets was measured by a nitrogen oxide analyser; the carbon (C) and sulphur (S) contents were measured by a carbon/sulphur analyser; the contents of other elements were measured by an inductively coupled plasma atomic emission spectrometer (ICP-AES).
The chemical compositions of the sheets are recorded in Table 1 below.
Table 1. The chemical compositions of the sheets (wt.%)
|
Serial number of steel sheets |
C |
N |
S |
Cr |
Al |
Zr |
Y |
Fe |
|
1 |
0.012 |
0.0104 |
0.0039 |
21.0 |
5.86 |
0.14 |
- |
Bal. |
|
2 |
0.025 |
0.0138 |
0.0032 |
21.3 |
5.46 |
0.14 |
0.05 |
Bal. |
|
3 |
0.019 |
0.0105 |
0.0028 |
21.8 |
5.59 |
0.15 |
0.12 |
Bal. |
|
4 |
0.023 |
0.0094 |
0.0018 |
21.5 |
5.54 |
0.13 |
0.21 |
Bal. |
|
5 |
0.018 |
0.0074 |
0.0010 |
21.6 |
5.62 |
0.14 |
0.40 |
Bal. |
The microstructures of the sheets (samples) were observed under a VHX-100 optical microscope (Keyence, Japan). First, each sample was ground with 200-1,200 grit SiC abrasive papers, and then polished with 1ithdiamond paste. The polished sample was etched in an aqueous solution (FeCl3: HCl: C2H5OH=1g: 3mL: 10mL) for 15s at 5V to expose the cross-section morphologies. The element distribution and cross-sectional morphology of the oxide film after phase change were observed by a Phenom XL scanning electron microscope (SEM) (Thermo Fisher Scientific, US), which supports energy dispersive X-ray analysis (EDAX).
The evolution of the oxide film during the initial oxidation was monitored for 60s with a LabRAM HR Evolution Raman spectrometer (Horiba, Japan) (spectral resolution>1cm-1; spatial resolution: 0.5μm) in backscattering Raman configuration. In addition, each sample was illuminated by a 532nm solid-state laser from a BXFM confocal microscope (Olympus, Japan).
3.1 Grain growth
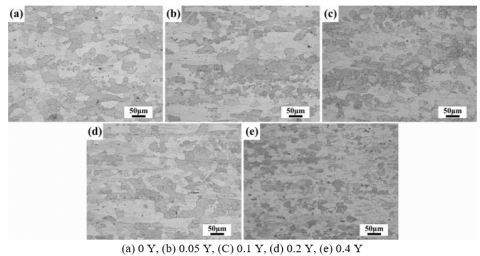
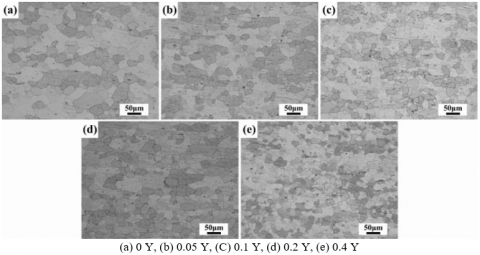
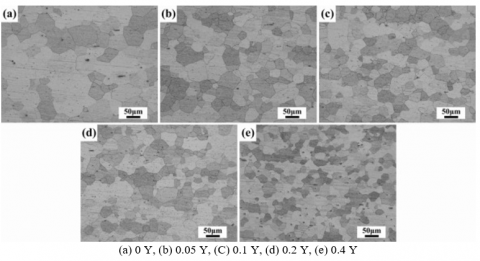
The five samples were fully recrystallized for 5min at 950℃, 975℃, 1,000℃, 1,025℃ and 1,050℃, respectively. The metallographs of the recrystallized samples are displayed in Figures 1(a)-5(a), respectively. Obviously, every sample was basically recrystallized after the heat treatment between 950℃ and 1,050℃. However, rolling traces were observed on the metallographs under 950℃ and 975℃, indicating the incomplete recrystallization of grains. There was no rolling trace on the metallograph under 1,000℃. The grain size on the metallographs under 1,025℃ and 1,050℃ were excessively large. Overall, the optimal recrystallization temperature was determined as 1,000℃.
Figure 1. Metallographs of Fe-Cr-Al alloy doped with different Y doses after 5min under 950℃
Figure 2. Metallographs of Fe-Cr-Al alloy doped with different Y doses after 5min under 975℃
Figure 3. Metallographs of Fe-Cr-Al alloy doped with different Y doses after 5min under 1,000℃
Figure 4. Metallographs of Fe-Cr-Al alloy doped with different Y doses after 5min under 1,025℃
Figure 5. Metallographs of Fe-Cr-Al alloy doped with different Y doses after 5min under 1,050℃
Next, each sample was doped with four different doses (wt.%) of Y: 0.05, 0.1, 0.2 and 0.4. The doped samples were treated for 5min at 950℃, 975℃, 1,000℃, 1,025℃ and 1,050℃, respectively. Figures 1(b)-1(e) show the metallographs of the four doped samples of sheet 1; Figures 2(b)-2(e) show the metallographs of the four doped samples of sheet 2… Figures 5(b)-5(e) show the metallographs of the four doped samples of sheet 5. It can be seen that, with the growing Y dose, the grain size of Fe-Cr-Al alloy plunged at the same temperature, indicating that the Y addition refines grains and inhibits grain growth at high temperature. This is because the addition of Y causes the molten steel to redistribute in the course of solidification, pushing up the super-cooling degree on the solid-liquid interface [9] and refining the grains.
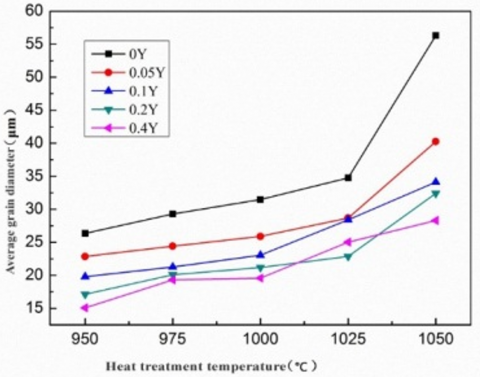
The average grain size curves of samples doped with different amounts of Y after 5min under 950-1,050℃ are presented in Figure 6. It can be seen from Figures 1-6 that the addition of Y refined the recrystallized grains, and the refinement increased with the Y dose. For instance, after 5min under 1,000℃, the average grain size gradually dropped from 31.49 to 19.57μm with the increase of Y dose.
Figure 6. Average grain size curves of samples doped with different amounts of Y after 5min under 950-1,050℃
It can also be seen that, with the rising temperature of heat treatment, the average grain size of Fe-Cr-Al alloy grew at an increasingly fast rate; however, the growth rate decreased with the increase in Y dose. Specifically, the average grain size of the Y-free sample increased slowly from 26.35 to 34.76μm before 1,025℃, and rocketed up to 56.31μm under 1,050℃. By contrast, the average grain size sample with 0.4Y slowly climbed up from 15.08 to 28.31μm under the high temperatures.
The above results show that the addition of Y can greatly refine the recrystallized grains and effectively hinder the rapid growth of grain size. As a result, many problems induced by grain growth in long-time service at high temperature can be solved by adding Y, namely, the decreasing strength, plastic deformation and short-circuiting.
3.2 Surface morphology of oxide film
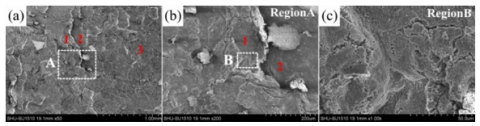
The surface morphology of the Y-free sample after 360h of isothermal oxidation under 1,250℃ is displayed in Figure 7. It is obvious that the Y-free sample was severely oxidized after the long thermal treatment. The oxide film peeled off in many places. Once the old film peeled off, the exposed substrate was oxidized, forming a new oxide film. This process repeated itself through the thermal treatment, exhibiting as the stratification of oxide film.
(a) Overall morphology; (b) Enlarged image of oxide film (Region A); (c) Enlarge image of exposed area (Region B)
Figure 7. The surface morphology of the Y-free sample after 360h under 1,250℃
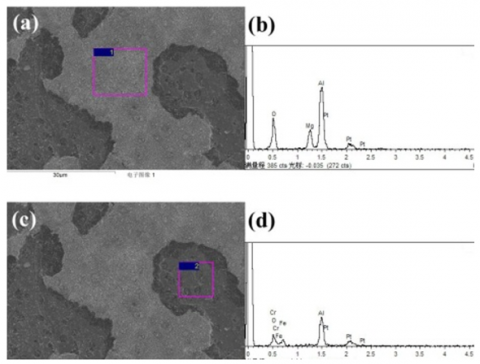
Figure 8 shows the results on the Y-free sample after 360h under 1,250℃ obtained through scanning electron microscopy/energy dispersive X-ray spectroscopy (SEM/EDS) analysis. It was found that the oxide film on the sample surface is rich in Al and O. Hence, the oxide was judged to be Al2O3. According to the energy spectrum of the exposed area, O was detected in addition to matrix elements like Fe, Cr and Al, indicating that the exposed matrix has been partially oxidized. This means the alloy without Y is prone to oxidation, and the oxide film can peel off easily. In addition, micro-cracks were observed on the exposed area. These cracks are induced by the local stress from the lateral growth of the oxide film under high temperature. Each crack provides a channel for O atoms to migrate from the atmosphere to the substrate, speeding up the oxidation process.
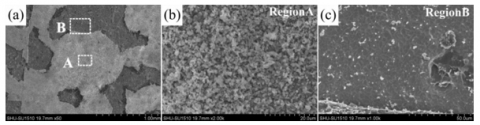
The surface morphology of the sample doped with 0.05Y after 360h of isothermal oxidation under 1,250℃ is displayed in Figure 9. It can be seen that, despite the wide exfoliation of the oxide film, no stratification occurred through the thermal treatment. The oxide film was thin and flat, with equiaxial crystals closely arranged on the surface. Many particle traces were observable on the exposed area, i.e. the exposed matrix is not or slightly oxidized. The exfoliation of the oxide film is the result of the heat cycle and temperature difference.
(a) Morphology of oxide film; (b) Energy spectrum of oxide film;
(c) Morphology of exposed area; (d) Energy spectrum of exfoliated film
Figure 8. The SEM/EDS results on the Y-free sample after 360h under 1,250℃
(a) Overall morphology; (b) Enlarged image of oxide film (Region A); (c) Enlarge image of exposed area (Region B)
Figure 9. The surface morphology of the sample doped with 0.05Y after 360h under 1,250℃
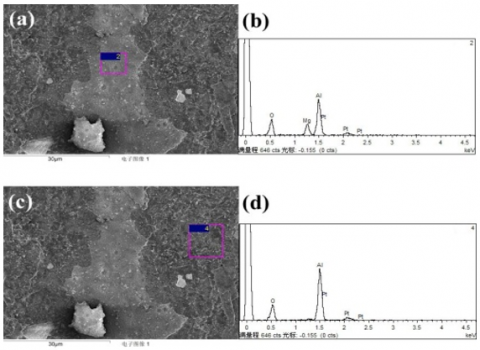
Figure 10 shows the SEM/EDS results on the sample doped with 0.05Y after 360h under 1,250℃. It can be seen that the exposed area was rich in matrix elements, containing only a small amount of O. The thin oxide film neither stratified nor exfoliated. This means the oxide film is compact and binds tightly to the matrix, providing effective protection to the matrix.
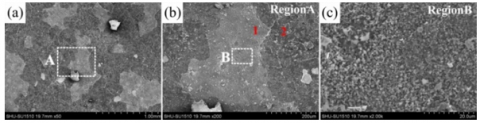
The surface morphology and the SEM/EDS results of the sample doped with 0.4Y after 360h of isothermal oxidation under 1,250℃ are displayed in Figures 11 and 12, respectively. Compared with the sample doped with 0.05Y, the sample doped with 0.4Y suffered from a limited exfoliation of the oxide film with the low dose of Y, indicating that the addition of Y can effectively enhance the adhesion of the oxide film. As shown in Figure 11, the particles on the oxide film were relatively compact, with only a few small pieces (black spots) peeling off. Figure 12 shows that the oxide film and the exposed area were both rich in Al and O, i.e. the sample surface only has Al2O3 oxide film, and the exposed area has been oxidized again.
(a) Morphology of oxide film; (b) Energy spectrum of oxide film;
(c) Morphology of exposed area; (d) Energy spectrum of exfoliated film
Figure 10. The SEM/EDS results on the sample doped with 0.05Y after 360h under 1,250℃
(a) Overall morphology; (b) Enlarged image of oxide film (Region A);
(c) Enlarge image of exposed area (Region B)
Figure 11. The surface morphology of the sample doped with 0.4Y after 360h under 1,250℃
(a) Morphology of oxide film; (b) Energy spectrum of oxide film;
(c) Morphology of exposed area; (d) Energy spectrum of exfoliated film
Figure 12. The SEM/EDS results on the sample doped with 0.4Y after 360h under 1,250℃
3.3 Cross-sectional morphology of the oxide film
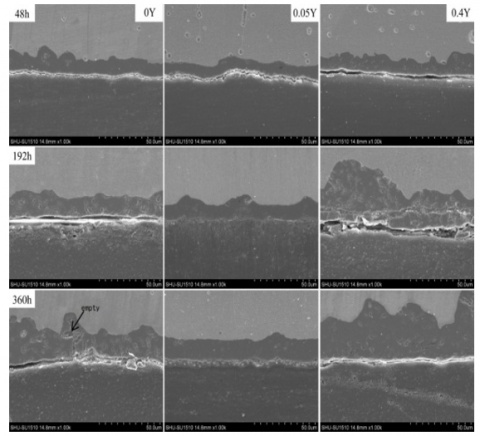
Figure 13 compares the cross-sectional morphologies of the samples doped with different amounts of Y (0, 0.05 and 0.4 wt.%) and treated for 48h, 192h and 360h under 1,250℃. The comparison shows that, with the elapse of time, the oxide film of the three samples became thicker, without stratification. The sample doped with 0.05Y had the thinnest and densest oxide film, whose thickness grew from 12.7 to 21.8μm with the elapse of time. The sample doped with 0.4Y had a thicker oxide film than the sample doped with 0.05Y. On this sample, the oxide film was tightly attached to the matrix, but suffered from severe stratification: the exposed area is not matrix but a deeper layer of the film.
The above phenomena can be explained as follows: Y can react with O easily to form a non-soluble oxide Y2O3 on the grain boundaries; the Y3+ slows down the grain growth, and suppresses the outward diffusion of cations and O2- [10, 11]. The addition of 0.4Y worsens the oxidation resistance of the alloy at high temperature, making it easier for O atoms to penetrate into the oxide film.
Figure 13. Cross-sectional morphologies of the samples doped with different amounts of Y (0, 0.05 and 0.4 wt.%) and treated for 48h, 192h and 360h under 1,250℃
3.4 X-ray diffraction (XRD) analysis
The XRD spectra of samples doped with different amounts of Y (0, 0.05 and 0.4 wt.%) and treated for 360h under 1,250℃ are exhibited in Figure 14. It can be seen that the surface oxide on the samples was α-Al2O3.
The Al2O3 oxide film is one of the best oxide protective films under high temperature. With a minimal amount of defects, this oxide film does not produce volatile products like Cr2O3. However, pure Al2O3 oxide film often peels off in the heat cycle, which reduces the oxidation resistance of the alloy under high temperature.
The film exfoliation can be reduced by adding Y and other RE elements, such that the alloy can resist oxidation stably under high temperature. The RE elements prevent the cavitation on the interface between the matrix and oxide film, and thus improves the bonding between the two parts.
According to the surface and cross-sectional morphologies of the samples with or without Y, there was a slight bulge at the exfoliation spot, and a small hole on the matrix-film interface, which is the result of hole concentration [12, 13]. Once the film peeled off, the holes were cut apart, preventing cavities from forming on the interface. Hence, the adhesion of the oxide film was improved.
Figure 14. The XRD spectra of samples doped with different amounts of Y (0, 0.05 and 0.4 wt.%) and treated for 360h under 1,250℃
3.5 Raman spectrum analysis
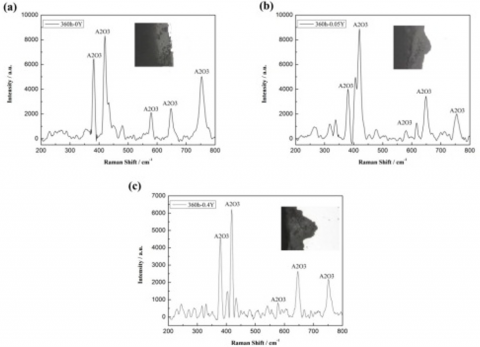
Table 2 lists the peak positions of Raman spectral vibration of common oxides [14-18]. Figure 15 displays the Raman spectra of samples doped with different amounts of Y (0, 0.05 and 0.4 wt.%) and treated for 360h under 1,250℃. It can be seen that the diffusion interface mainly depends on the element distribution of grain boundaries, i.e. the grain size may have a great impact on the products of high-temperature oxidation. After high temperature oxidation, the oxide films on the samples doped with different amounts of Y were mainly composed of Al2O3. The preferential oxidation of Al effectively protects the matrix, creating a thin layer of non-stratified oxide film.
Table 2. The peak positions of Raman spectral vibration of common oxides
|
Name |
Peak (cm-1) |
||||||||||
|
α-Fe2O3 |
226 |
245 |
296 |
|
411 |
495 |
|
612 |
|
|
|
|
α-Fe2O3 |
225 |
245 |
295 |
|
415 |
500 |
|
615 |
|
|
|
|
α-Fe2O3 |
227 |
245 |
293 |
|
414 |
501 |
|
612 |
|
|
|
|
γ-Fe2O3 |
|
|
|
|
350 |
505 |
|
|
|
660 |
710 |
|
γ-Fe2O3 |
|
265 |
300 |
345 |
395 |
515 |
|
641 |
645 |
670 |
715 |
|
γ-Fe2O3 |
|
263 |
|
350 |
380 |
505 |
|
|
650 |
|
740 |
|
Fe3O4 |
|
|
302 |
|
|
513 |
534 |
|
|
663 |
|
|
Fe3O4 |
|
|
|
|
|
|
540 |
|
|
665 |
|
|
Fe3O4 |
|
|
|
|
|
|
550 |
|
|
670 |
|
|
Fe3O4 |
|
|
300 |
320 |
420 |
|
560 |
|
|
680 |
|
|
Fe3O4 |
|
|
298 |
320 |
420 |
|
550 |
|
|
676 |
|
|
FeO |
|
|
298 |
|
435 |
|
|
|
616 |
662 |
|
|
Cr2O3 |
|
|
306 |
342 |
|
|
541 |
602 |
616 |
617 |
|
|
Cr2O3 |
|
|
303 |
351 |
397 |
|
530 |
551 |
609 |
|
|
|
Cr2O3 |
|
|
300 |
350 |
|
|
|
540 |
554 |
613 |
|
|
FeCr2O4 |
|
|
|
|
|
|
|
564 |
678 |
680 |
695 |
|
Al2O3 |
415 |
494 |
618 |
669 |
|||||||
|
α-Al2O3 |
|
379 |
418 |
577 |
|
|
752 |
||||
|
α-Al2O3 |
|
|
422 |
|
|
|
721 |
||||
Figure 15. The Raman spectra of samples doped with different amounts of Y (0, 0.05 and 0.4 wt.%) and treated for 360h under 1,250℃
This paper probes deep into the grain growth and oxidation resistance of Fe-Cr-Al electrothermal alloys doped with different amounts of Y under high temperatures. The main conclusions are as follows:
(1) The microstructure of the target alloy, which was prepared through hot forging, hot rolling and cold rolling, was completely recrystallized after 5min under 1,000℃, exhibiting refined grains. If the temperature is too low, the rolling traces will not be eliminated. If the temperature is too high, the grains will grow excessively. The addition of Y refined the recrystallized grains, and the refinement increased with the Y dose.
(2) The grain size of Fe-Cr-Al electrothermal alloy grew quickly at 1,150°C. The growth slowed down with the rise in the Y dose. An excessively high Y dose (³0.4wt.%) suppressed the grain growth.
(3) Under 1,250℃, a continuous dense Al2O3 oxide film formed on the surface of Fe-Cr-Al electrothermal alloy. The density and continuity of the film can be improved by adding a trace amount of Y. In this case, the film will adhere to the matrix more tightly, reducing the oxidation rate. However, a high Y dose will thicken the oxide film and reduce the oxidation resistance of the alloy.
The authors would like to thank Q. H. Liu for the SEM tests. This research was sponsored by Jiangsu Cooperative Innovation Fund-the major innovation carrier construction of Shanghai University Xinghua Institute of Special Stainless Steels (BY2013089).
[1] Liu, F., Stiller, K. (2013). Atom probe tomography of thermally grown oxide scale on FeCrAl. Ultramicroscopy, 132: 279-284. https://doi.org/10.1016/j.ultramic.2013.02.004
[2] Handbook, K. (2001). Resistance Heating Alloys and Systems for Industrial Furnaces. Kanthal AB Sweden TM.
[3] Amano, T. (2010). Rare earth application for heat-resisting alloys. Journal of Rare Earths, 28: 12-21. https://doi.org/10.1016/S1002-0721(10)60371-7
[4] Basu, S.N., Wu, H., Gupta, V., Kireev, V. (2003). The effect of structure and chemistry on the strength of FeCrAl (Y)/sapphire interfaces: I. Structure and chemistry of interfaces. Materials Science and Engineering: A, 349(1-2): 248-255. https://doi.org/10.1016/S0921-5093(02)00792-X
[5] Pang, Q., Hu, Z.L., Sun, D.L. (2016). The influence of Ce content and preparation temperature on the microstructure and oxidation behavior of Ce–modified Cr coating on open–cell NiCrFe alloy foam. Vacuum, 129: 86-98. https://doi.org/10.1016/j.vacuum.2016.04.018
[6] Wua, Z.T., Qib, Z.B., Zhua, F.P., Liua, B., Wang, Z.C. (2013). Influences of Y addition on mechanical properties and oxidation resistance of CrN coating. Physics Procedia, 50: 150-155.
[7] Park, D.J., Kim, H.G., Park, J.Y., Jung, Y.I., Park, J.H., Koo, Y.H. (2015). A study of the oxidation of FeCrAl alloy in pressurized water and high-temperature steam environment. Corrosion Science, 94: 459-465. https://doi.org/10.1016/j.corsci.2015.02.027
[8] N’Dah, E., Tsipas, S., Hierro, M.P., Pérez, F.J. (2007). Study of the cyclic oxidation resistance of Al coated ferritic steels with 9 and 12% Cr. Corrosion Science, 49(10): 3850-3865. https://doi.org/10.1016/j.corsci.2007.05.011
[9] Weng, F., Yu, H., Chen, C., Wan, K. (2015). High‐temperature oxidation behavior of Ni‐based superalloys with Nb and Y and the interface characteristics of oxidation scales. Surface and Interface Analysis, 47(3): 362-370. https://doi.org/10.1002/sia.5718
[10] Moniruzzaman, M., Maeda, M., Murata, Y., Morinaga, M. (2003). Degradation of high-temperature oxidation resistance for Ni-based alloys by Re addition and the optimization of Re/Al content. ISIJ international, 43(3): 386-393. https://doi.org/10.2355/isijinternational.43.386
[11] Wu, Y., Hagihara, K., Umakoshi, Y. (2005). Improvement of cyclic oxidation resistance of Y-containing TiAl-based alloys with equiaxial gamma microstructures. Intermetallics, 13(8): 879-884. https://doi.org/10.1016/j.intermet.2005.01.014
[12] Cueff, R., Buscail, H., Caudron, E., Riffard, F., Issartel, C., El Messki, S. (2004). Effect of reactive element oxide coating on the high temperature oxidation behaviour of FeCrAl alloys. Applied Surface Science, 229(1-4): 233-241. https://doi.org/10.1016/j.apsusc.2004.01.072
[13] Rovere, F., Mayrhofer, P.H., Reinholdt, A., Mayer, J., Schneider, J.M. (2008). The effect of yttrium incorporation on the oxidation resistance of Cr–Al–N coatings. Surface and Coatings Technology, 202(24): 5870-5875. https://doi.org/10.1016/j.surfcoat.2008.06.161
[14] Boucherit, N., Hugot-Le Goff, A., Joiret, S. (1991). Raman studies of corrosion films grown on Fe and Fe-6Mo in pitting conditions. Corrosion Science, 32(5-6): 497-507. https://doi.org/10.1016/0010-938X(91)90103-V
[15] Thibeau, R.J., Brown, C.W., Heidersbach, R.H. (1978). Raman spectra of possible corrosion products of iron. Applied Spectroscopy, 32(6): 532-535.
[16] De Faria, D.L.A., Venâncio Silva, S., De Oliveira, M.T. (1997). Raman microspectroscopy of some iron oxides and oxyhydroxides. Journal of Raman spectroscopy, 28(11): 873-878. https://doi.org/10.1002/(SICI)1097-4555(199711)28:11<873::AID-JRS177>3.0.CO;2-B
[17] Beattie, I.R., Gilson, T.R. (1970). The single-crystal Raman spectra of nearly opaque materials. Iron (III) oxide and chromium (III) oxide. Journal of the Chemical Society A: Inorganic, Physical, Theoretical, 980-986.
[18] Fabis, P., Heidersbach, R., Brown, C., Rockett, T. (1981). Oxide scale formation on iron-chromium alloys in elevated temperature air environments. Corrosion, 37(12): 700-711. https://doi.org/10.5006/1.3577561