Tumula Eswara Rao* | Guruji Rama Krishna | Mailapalli Vinay Kumar
OPEN ACCESS
The purpose of this research study is to investigate the microstructural properties at Heat Affected Zone (HAZ) using Scanning Electron Microscope and to analyze the strength of the welded plates compared to parent metal plates. To carry this research work, mild steel plates (IS 2062) with butt joint using Metal Inert Gas (MIG) are considered. To know the effect on microstructure of the weld portion and strength compared to parent metal, three different thickness plates i.e. 5 mm, 6 mm and 8 mm are considered and welded with but joint at three different input current i.e. 120 A, 140 A and 160 A by keeping voltage constant i.e. 50 V. The results obtained from the different thickness plates are compared to find the optimal thickness and current required.
metal inert gas welding, heat affected zone, steel plates IS 2062, microstructure analysis, impact test
Rakesh Kumar and Satish Kumar [1] discussed the influence of various welding parameters like welding current, arc voltage and root gap on the mechanical properties during the MIG welding of mild steel 1018 grade. The microstructure, hardness and tensile strength of the welded specimens are investigated in this study. M.A. Bodude and I. Momohjimoh [2] used OAW and SMAW techniques to find out the influence of the amount of heat which was supplied to measure the mechanical properties of low carbon steels. Hardness, impact energy and tensile strength of the welding portion have been calculated. G. Haragopal et al. [3] constructed a new design for input process parameters to optimize the different mechanical properties of Aluminium alloy, used for construction of aerospace wings. Gas pressure, current, groove angle and pre-heat temperature have been considered as process parameters. Process parameters were assigned for each experiment. E. Mahdi et al. [4] investigated using a series of electrochemical and mechanical tests to know the behaviour of MIG welded and unwelded AA 6061 T6. It was observed that the HAZ was more vulnerable to corrosion showing severe pitting corrosion as compared to that of the base metal. When the welded specimen went away from the weld centre the hardness also increased and torsion welded specimens were broken at the HAZ suggesting softness of this area due to the impact of MIG welding. Sapakal and M.T. Telsang [5] investigated the influence of welding parameters like welding current, welding voltage, welding speed on the penetration depth of mild steel during welding by using Taguchi design method. Result showed that the welding voltage had large impact on the penetration depth. Suresh Kumar et al. [6] discuss the microstructural development during MIG welding of copper with iron filler. The welding parameters considered during the experimental work were welding voltage, welding current and travel speed. They investigated the needle shaped morphology of iron matrix which was typical of martensitic structure. It was also observed that the microstructure was bended at the copper iron interface which varied with travel speed.
K Y Benyounis and Abdul-Ghani Olabi [7] tried to optimize the different welding process using numerical and statistical approaches. They showed that the quality of a welded joint is directly influenced by the welding input parameters during the welding process and hence conclude that welding can be considered as a multi input multi output process. They tried to look upon the common problem that the manufacturers normally face i.e. to control the various input process parameters to get a noble welded joint with the required weld feature and bead geometry to minimize the distortion and detrimental residual stresses. They reviewed how to the utilized to optimize the process input parameters required for a sound weld with the help of several optimization techniques. Ajit Hooda et al. [8] tried to find out the influence of process parameters on the yield strength in the medium carbon steel graded AISI 1040. They investigated the yield strength and microstructure of the MIG welded sample welded at different welding parameters. The input parameters included welding voltage of 23-25 V, Welding current of 200-220 A, Wire speed of 2.4-3.2 m/min and gas flow rate of 12-16 CFH (Cubic Feet of gas per Hour). They found out that longitudinal yield strength is greater than the transverse yield strength for all the welded samples.
K. Abbasi et al. [9] investigated the effect of MIG welding parameters on the weld bead shape characteristics. They fixed the welding current and welding voltage at 165A and 16V respectively. They studied the effect of process parameters like welding speed and heat input on the penetration depth. They found out that the penetration depth increased with an increase in speed up to an optimum value of 1450 mm/min. Shape factor also increased with an increase in welding speed up to 1450 mm/min. Depth of penetration also increased with an increase in heat input up to an optimum value and then decreased with a further increase in heat input. Wansheng Du [10] investigated the mechanical properties and microstructures of the welding joints by Optical Microscopy, SEM, micro hardness test and tensile test. They found out that the weld zone had an as-cast structure with equiaxed shaped grains. The columnar grains form on one side of the welding seam as well as equiaxed crystal on the other side. The micro hardness decreased in the order Base Metal > HAZ > Welding zone. Rafael Garcia [11] carried out the metallurgical characterization of API x65 steel joint welded by MIG welding process with axial magnetic field. API x65 was heat treated in nonconventional way to improve the resistance produced mechanically. It was found out that with the application of an external axial magnetic field during welding, the defects that were normally produced without the application of magnetic field were eliminated. These defects include porosity and lack of lateral fusion to name a few. The mechanical properties of joints in the presence of magnetic fields were improved. The toughness of the welded joints in presence of magnetic fields was also improved. They grain refinement zone within the microstructure in the weld bead and significant reduction of porosity as the reasons for these kinds of observations.
K. Srinivasan and V. Balasubramanian [12] studied the effect of heat input on fume generation and joint properties of Gas metal arc welded Austenitic stainless steel (AISI 316) plates. They also studied the mechanical properties (strength, hardness and toughness) and carried out the microstructural analysis of the weld deposits. They finally concluded that the FGR and fume percentage show a directly proportional relationship with the wire feed rate of GMAW., Shekhar Srivastava and R. K. Garg [13] tried to study the effect of various process parameters on welding of IS 2062 mild steel plate using GMAW with a copper coated mild steel wire of 0.8 mm diameter. They obtained various results like bead width, bead height and depth of penetration using Response surface methodology. They concluded that the error between experimental and theoretical values was less than 2 %.
For metal inert gas welding more than 4 mm thickness of material is preferable to consider V-butt weld joints. Therefore, three different thicknesses of materials like 5 mm, 6 mm and 8 mm have been chosen. Welding operation has been conducted between 105 A to 180 A ranges for good quality of weld 120 A, 140 A and 160 A levels of currents were taken to weld different thicknesses of material”.
The present research article is having the following sections: section-1 deals with the introduction part about various authors, deals with MIG welding micro structure properties and strength analysis. Section-2 deals with materials and methods employed for performing the MIG welding. Section -3 deals with results of the SEM analysis of different MIG welded plates and strength analysis of the plates. Section -4 summarize the work carried out in the paper.
2.1 Material overview for welding
Mild steel is one of the cheap materials among steel and it is very commonly used in all application. It can be easily welded by all common welding technique. The material is very hard and durable. It is used where a large quantity of iron is required. Electrical current can easily have transferred through mild steel without leaving any effect on the internal structure of the metals. It has Superior welding properties than steel. That’s why mild steel has been chosen as work piece material. the detail composition of mild steel is given in Table 1.
Table 1. Composition of mild steel samples used
|
Element |
Carbon |
Manganese |
Silicon |
Sulphur |
Phosphorus |
Iron |
|
Percentage |
0.16-0.18 |
0.7-0.9 |
0.4 |
0.04 |
0.04 |
Balance |
Table 2. The composition of the wire electrode used during MIG welding
|
Element |
C |
Mn |
Si |
S |
P |
Cr |
Ni |
Mo |
Cu |
|
Percentage |
0.08-0.11 |
1.2-1.5 |
0.7-0.9 |
0.025 |
0.025 |
0.2-0.4 |
0.6-0.9 |
0.15 |
0.25-0.45 |
Table 3. Welding current, dimensions of work piece and welding voltage used
|
Sl.No |
Sample dimensions(cm3) |
Welding current(A) |
Welding voltage(V) |
|
1 |
10×5×0.6 |
120 |
50 |
|
2 |
10×5×0.5 |
120 |
50 |
|
3 |
10×5×0.8 |
120 |
50 |
|
4 |
10×5×0.6 |
140 |
50 |
|
5 |
10×5×0.5 |
140 |
50 |
|
6 |
10×5×0.8 |
140 |
50 |
|
7 |
10×5×0.6 |
160 |
50 |
|
8 |
10×5×0.5 |
160 |
50 |
|
9 |
10×5×0.8 |
160 |
50 |
Double pass welds were performed on the specimens, i.e. the welding filler metal was passed across the joint twice. The welding current, the dimensions of the work piece and welding voltage are tabulated as in Table 3.
Butt joint was formed between the mild steel samples. Two mild steel samples were kept side by side and a joint was first formed at the edges of the samples. Requisite welding current and welding voltage was used as mentioned in the table. Welding was then carried out throughout the joint by keeping an optimum distance between the electrode and the joint. Double pass welding was performed. The gas that has been used was Ar+CO2.
2.2 Methods that was considered for microstructure analysis and impact toughness
2.2.1 Optical microscopy
The samples were cut using horizontal band saw. The 3 samples of dimensions (10×5×0.5) cm3 was reduced to (2×2×0.5) cm3 after cutting. The 3 samples of dimensions (10×5×0.6) cm3 was reduced to (2×2×0.6) cm3 after cutting. The 3 samples of dimensions (10×5×0.8) cm3 was reduced to (2×2×0.8) cm3 after cutting.
The samples were grinded using belt grinder. After completion of grinding, the samples were polished using emery papers viz. 1/0, 2/0, 3/0 and 4/0 in a progressive manner. Now the samples were cloth polished using Alumina paste and finally diamond polished to get a fine mirror appearance on the surface which needs to be observed under microscope. After polishing etchant was prepared. 4 % Nital was used as etchant for mild steel samples. Preparation of 4% Nital involved measuring of 96 mL using measuring flask in which 4 mL of concentrated nitric acid was added. The polished samples were taken and dipped in the etchant for a few seconds which was kept in a Petridis. After etching the samples were taken for microstructural observation under optical microscope. The figure of optical microscope is presented in Figure 1.
Figure 1. Picture of optical microscope with interfaced computer
2.2.2 Impact energy
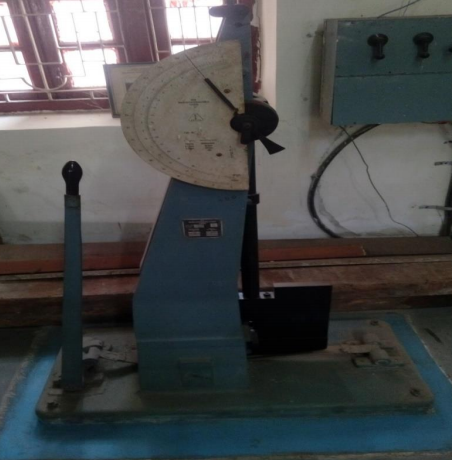
Charpy V-notch impact test was carried out on the welded specimens with dimensions of the specimens being 10 cm in length and 1 cm in width and the thickness varying as in 5 mm, 6 mm and 8 mm. Notched bar impact test of metals provide information on failure mode under high velocity loading conditions leading to sudden fracture where a sharp stress raiser (notch) is present. Although two standardized tests, the Charpy and Izod, were designed and used extensively to measure the impact energy, Charpy V-notched impact tests are more common in practice. The load was applied as an impact blow from a weighed pendulum hammer that was released from a position at a fixed height h. The specimen was positioned at the base and with the release of pendulum, which had a knife edge, stroke and fractured the specimen at the notch. The pendulum continued its swing, rising to a maximum height h1 which was obviously lower than h naturally. The energy absorbed at fracture was obtained from the difference in potential energy of the pendulum before and after the test, the machine through which charpy impact test has been conducted is given in Figure 2. The details figure of tested sample is shown in Figure 3.
Figure 2. Charpy impact test machine
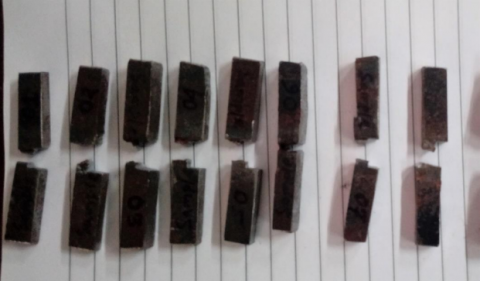
Figure 3. Charpy test samples after the test
3.1 Microstructural analysis
Microstructure of the weld sample by the help of optical microscope has been observed. Mainly five zones of welded samples are taken into consideration. That’s fusion zone, metal coarsening zone, metal transition zone, grain refinement zone and base metal. The main object is to find out the change in microstructure with change in material thickness and current which was taken as input parameters.
Before analyzing the various zones present in the weld material, the salient features in the microstructure are shown in Figure 4.
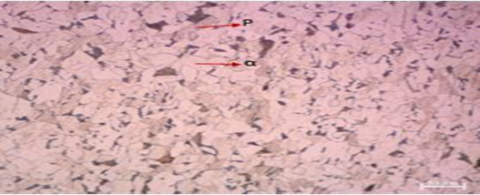
Figure 4. α-ferrite and pearlite shown in a mild steel sample
Figure 4 shows white α-ferrite grains (α) and brownish pearlite (P) colonies. Various zones of welding were investigated. The various zones, as observed in the different samples are explained below:
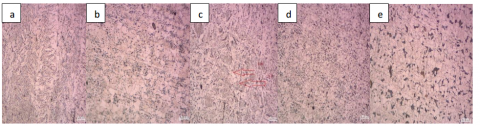
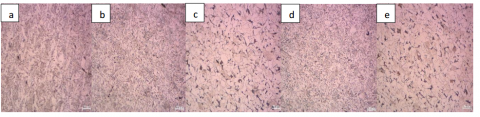
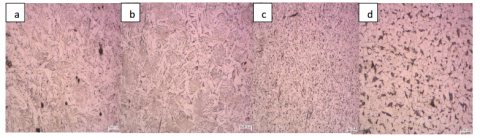
Figure 5 shows different zones of welding when the input current is 120 A and thickness of the plate is 6 mm. Figure 5(a) shows fusion zone consisting of columnar ferrite grains extending from the fusion boundary to the weld centerline. As one moves away from the weld zone, a transition zone is observed, as shown in Figure 5(b). This represents the boundary area between the HAZ and the fusion zone.
The HAZ zone shows a great variation in microstructure. Figure 5(c) shows coarser grains of α-ferrite and coarse colonies of pearlite. This region (Figure 5(c)) is the Grain Growth zone. On further movement, a considerable reduction in the size of the grains is observed. Both the ferrite grains and pearlite colonies become finer in this zone. This region is the Grain Refinement Zone (Figure 5(d)). The grain size again increased in the region outside the HAZ i.e. the region of base material, as shown in Figure 4(e).
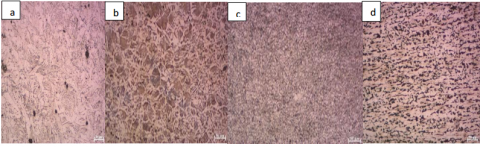
In Figure 6 shows the various zones of welding observed in the sample welded at 120 A and having a thickness of 5 mm. Various zones of welding observed in this sample are fusion zone, transition zone, grain coarsening zone and grain refinement zone. In Figure. 6(a) showing the fusion, columnar dendritic structure is observed. Transition zone (Figure 6(b)) consists of grains having an intermediate grain size, representing the boundary between HAZ and fusion zone. HAZ zone shows a variation of grain size as one move away from the fusion zone.
Figure 5. Microstructure of different zones of welding, i.e. (a) Fusion zone, (b) Transition zone, (c) Grain coarsening zone, (d) Grain refinement zone and (e) Base material, welded at 120 A, Thickness=6 mm
Grain Growth (Figure 6(c)) and Grain Refinement zones (Figure 6(d)) are clearly observed. Ferrite grains observed in the Grain Refinement zone are finer in size, as compared to Figure 6(d). This was due to lesser thickness of the plate which resulted in a steeper temperature gradient and hence faster cooling.
Figure 6. Microstructure of different zones of welding i.e. (a) Fusion zone, (b) Transition zone, (c) Grain coarsening zone, (d) Grain refinement zone and (e) Base material, welded at 120 A, Thickness=5 mm
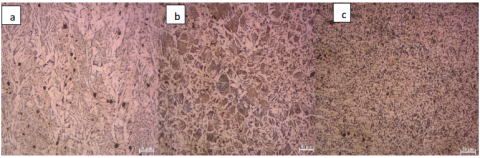
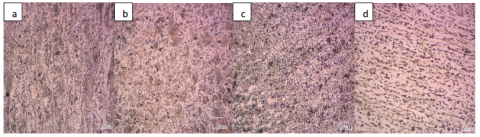
Figure 7 shows various zones of welding obtained when the input current is 120 A and thickness of the plate is 8mm. Figure 7(a) shows similar columnar dendritic structure in the fusion zone. The distinct feature in this sample is that there is a rapid transition from the fusion zone into the HAZ zone. A distinct transition zone is not observed. In the HAZ zone, grain Growth zone (Figure 7(b)) and Grain Refinement zones (Figure 7(c)) are observed. Grain Growth zone shows presence of equiaxed grains. The sample has a higher thickness value. This led to a lower cooling rate. A lower cooling rate supported grain growth and is the reason behind the formation of equiaxed grains.
Figure 7. Microstructure of different zones of welding i.e. (a) Fusion zone, (b) Grain coarsening zone, (c) Grain refinement zone, welded at 120 A, Thickness=8 mm
Figure 8 shows different zones of welding obtained when the input current is 140 A and thickness of the sample is 5mm. In Figure 8 (a), the dendrites in the fusion zone shows a greater spacing as compared to Figure 8 (a). The reason for this is due to the higher heat input in this case. (Input current is 140 A, as compared to sample 1 (Figure 5), which has an input current of 120 A). The spread of the HAZ zone also increases with the increase in heat input.
Figure 9 shows the various zones of welding when the input current is 140 A and thickness of the plate is 5mm. In Figure 9, the fusion zone has a larger dendritic spacing than fig 4.3 due to higher current input. Grain growth (fig. 4.6(b)) and Grain Refinement Zone (Figure 9(c)) are clearly observed. Figure 10 shows the different zones in welding with input current of 140 A and thickness 8 mm. more refined structures are found in Figure 10 than Figure 7.
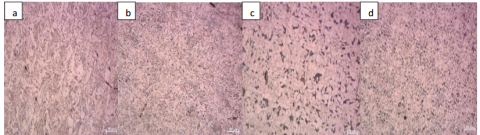
Figure 11 represents the different zones of welding obtained with an input current of 160 A and plate thickness of 6mm. Figure 11(d) shows columnar grain structure in the region between HAZ and base material. Higher heat input, due to a current of 160 A leads to a steeper temperature gradient, which in turn leads to formation of columnar grains in the region between base material and HAZ.
Figure 8. Microstructure of different zones of welding i.e. (a) Fusion zone, (b)Transition zone, (c) Grain coarsening zone, (d) Grain refinement zone, welded at 140 A, Thickness=6mm
Figure 9. Microstructure of different zones of welding. (a) Fusion zone, (b) Grain coarsening zone, (c) Grain refinement zone and (d) Base material, welded at 140 A, Thickness=5mm
Figure 10. Microstructure of different zones of welding i.e. (a) Fusion zone, (b) Transition zone, (c) Grain coarsening zone, (d) Grain refinement zone, welded at 140 A, Thickness=8 mm
Figure 11. Microstructure of different zones of welding i.e. (a) Fusion zone, (b) Grain coarsening zone, (c) Grain refinement zone and (d) Region between HAZ and base material, welded at 160 A, Thickness=6 mm
Figure 12 represents the different zones of welding obtained with an input current of 160 A and plate thickness of 6 mm. Figure 12(d) shows similar observations as Figure 12 (d). Columnar grains are found in the region between HAZ and base material.
Figure 12. Microstructure of different zones of welding i.e. (a) Fusion zone, (b) Grain coarsening zone, (c) Grain refinement zone and (d) Region between base material and HAZ, welded at 160 A, Thickness=5 mm
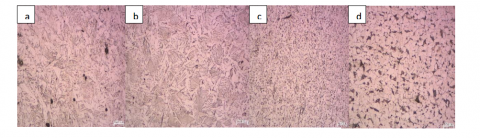
Figure 13 represents the different zones of welding obtained with an input current of 160 A and plate thickness of 8 mm. Figure 13(e) shows similar observations to Figure 11 (d) and Figure 12(d). The region between HAZ and base material were less columnar than observed in Figure 11(d) and Figure 12(d).
Figure 13. Microstructure of different zones of welding i.e. (a) Fusion zone, (b) Grain coarsening zone, (c) Grain refinement zone and (d) Region between HAZ and base material, welded at 160 A, Thickness=8 mm
All the samples having a thickness of 8 mm showed formation of equiaxed grains in the Grain Growth region of the HAZ. The reason can be attributed to the slow cooling rate due to a higher value of thickness. In the case of samples of thickness 5 mm and 6 mm, the dendritic spacing in the weld zone showed an increasing trend with increase in the value of current. This variation can be attributed to the fact that at low heat input, cooling rate is relatively higher due to which thermal gradients are established in the weld metal, which in turn allow lesser time for the dendrites to grow, whereas at high heat input, cooling rate is slow which provides ample time for the dendrites to grow farther into the fusion zone.
3.2 Impact energy
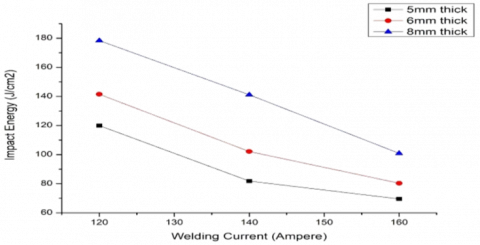
The impact energy of the welded samples increases with increase in the thickness of the material. At the same time, the impact energy decreases with an increase in the value of welding current. Talabi et al. [14] investigated the effect of welding current on impact energy of SMAW. They found a similar trend of decrease in the value of impact energy with an increase in the value of the current.
Figure 14. Impact energy v/s welding current for different values of sample thickness
From Figure 14, by the increase of welding current impact energy is decreasing. When material thickness is increasing impact energy is increasing. From the graph it is observed that with the application of 120 A on 8 mm thickness plate maximum impact energy has been investigated.
Mild steel samples of three different thicknesses were welded using MIG welding technique with input current of 120A, 140A and 160A respectively by keeping voltage constant at a value of 50V. After extensive microstructural analysis using Optical microscope and SEM followed by Vickers’s micro hardness and Charpy Impact test, the conclusions can be summarized as follows:
(1) From microstructural analysis, it was observed that the fusion zone consisted of columnar structure of α-ferrite. HAZ zone consisted of α-ferrite and colonies of pearlite of various grain sizes. Large grains of ferrite and coarse colonies of pearlite were found in the Grain Coarsening Zone. Sample of thickness 8 mm showed formation of equiaxed grains in the Grain Coarsening zone. There was a rapid decrease in the grain size in the Grain Refinement zone.
(2) In case of impact energy, sample with input current of 140 A and thickness 8 mm showed 2nd highest value of impact toughness among all the samples. (1.4112 J/mm2). Sample with input current of 160 A and thickness 8 mm showed highest value of impact strength (1.78 J/mm2). This sample showed a greater variation of hardness as one moved from fusion zone (250.2 Hv) to grain refinement zone (239.5). Therefore, this sample has a greater tendency to failure. Samples of thickness 5mm showed the least value of impact energy for any given value of current.
(3) Overall, sample 6 having a thickness of 8 mm and input current of 160 A gave the best optimized results in terms of hardness and impact energy.
As a future scope, this method of evaluating the optimal results in terms of hardness and impact energy can be extended to dissimilar weld pieces, which is having lot of applications in present era.
This research article is not possible without the support of the Department of Mechanical Engineering, Production lab. I would also like to thank the institute Raghu Engineering College (Autonomous) which supported us to carry out the research work.
|
SEM |
Scanning Electronic Microscope |
|
HAZ |
Heat Affected Zone |
|
FZ GCZ |
Fusion Zone Grain Coarsening Zone |
|
GRZ |
Grain Refinement Zone |
|
Greek symbols
|
|
|
a |
α-ferrite grains |
|
P |
brownish pearlite |
[1] Kumar, R., Kumar, S. (2014). Study of mechanical properties in mild steel using metal inert gas welding. International Journal of Research in Engineering and Technology, 3: 751-756.
[2] Momohjimoh, I., Bodude, M.A. (2015). Studies on effects of welding parameters on the mechanical properties of welded low-carbon steel. Journal of Minerals and Materials Characterization and Engineering, 3(3): 142-149. https://doi.org/10.4236/jmmce.2015.33017
[3] Reddy, G.C.M., Haragopal, G., Subrahmanyam, J.V., Reddy, P.R. (2011). Parametric design for MIG welding of Al-65032 alloy using Taguchi Technique. Journal of Scientific and Industrial Research, 70: 844-851. http://doi.org/hdl.handle.net/123456789/12679
[4] Mahdi, E., Eltai, E.O., Rauf, A. (2014). The impact of metal inert gas welding on the corrosion and mechanical behavior of AA 6061 T6. International Journal of Electrochemical Science, 9(3): 1087-1101.
[5] Sapakal, S.V., Telsang, M.T. (2012). Parametric optimization of MIG welding using Taguchi design method. Int J Adv Eng Res Stud., 1(4): 28-30.
[6] Kumar, K.S., Phanikumar, G., Dutta, P., Chattopadhyay, K. (2002). Microstructural development of dissimilar weldments: Case of MIG welding of Cu with Fe filler. Journal of Materials Science, 37(11): 2345-2349. https://doi.org/10.1023/A:1015306408611
[7] Benyounis, K.Y., Olabi, A.G. (2008). Optimization of different welding processes using statistical and numerical approaches–A reference guide. Advances in Engineering Software, 39(6): 483-496. https://doi.org/10.1016/j.advengsoft.2007.03.012
[8] Hooda, A., Dhingra, A., Sharma, S. (2012). Optimization of MIG welding process parameters to predict maximum yield strength in AISI 1040. International Journal of Mechanical Engineering and Robotics Research (IJMERR), 1(3): 2278-0149. https://doi.org/10.18178/ijmerr10.1.1.300.6949
[9] Abbasi, K., Alam, S., Khan, D.M. (2012). An experimental study on the effect of MIG welding parameters on the weld-bead shape characteristics. International Journal of Engineering Science and Technology, 2(4): 250-268.
[10] Du, W.S., Peng, Y., Zhao, L., Tian, Z.L. (2008). Microstructure and mechanical properties of MIG welded joint of high nitrogen austenite stainless steel. Welding & Joining, 12: 9-18.
[11] Natividad, C., García, R., López, V.H., Contreras, A., Salazar, M. (2017). Metallurgical characterization of API X65 steel joint welded by MIG welding process with axial magnetic field. Materials Research, 20(5): 1174-1178. http://dx.doi.org/10.1590/1980-5373-mr-2016-0182
[12] Srinivasan, K., Balasubramanian, V. (2011). Effect of heat input on fume generation and joint properties of gas metal arc welded austenitic stainless steel. Journal of Iron and Steel Research International, 18(10): 72-79. https://doi.org/10.1016/S1006-706X(12)60025-9
[13] Srivastava, S., Garg, R.K. (2017). Process parameter optimization of gas metal arc welding on IS: 2062 mild steel using response surface methodology. Journal of Manufacturing Processes, 25: 296-305. https://doi.org/10.1016/j.jmapro.2016.12.016
[14] Talabi, S.I., Owolabi, O.B., Adebisi, J.A., Yahaya, T. (2014). Effect of welding variables on mechanical properties of low carbon steel welded joint. Advances in Production Engineering & Management, 9(4): 181-186. http://dx.doi.org/10.14743/apem2014.4.186