Rajeev Verma | Ashok Jaiswal | Akhil Avchar*
OPEN ACCESS
This research is focused on evaluating the effects of joint orientation on the stability of open stopes. Joints are often seen as the source of failure in an open stope. Joint orientation adversely affects the stability of the open stope by majorly causing non-uniformity in stress and providing a surface for free movement of strata. Effect of joint orientation on stope stability is less discussed with few publications. This study exclusively identifies the effect of joint orientations on stope stability with the help of numerical model designed in finite difference method computer software. In this research, different rock strengths were considered to determine how joint orientations ranging from 0 to 165 degrees affect the stability of open stopes having variable horizontal to vertical stress ratio values and thus the failure behavior is obtained. The application of the results of this research in the metal mining industry should lead to improved understanding of the effects of joint orientation on stope stability for different rock strata at variable depths, and hence useful in devising a suitable design method of mining metal orebody that offers optimum stope span, maximum production and required factor of safety.
metal mining, stope, joint orientation, numerical modeling, finite difference, open stoping
Metalliferous deposits are naturally found ore bodies for a metal. These are found on earth in the shape of a vein or lode or tabular or blocky form. They can be mined by underground mining methods or opencast mining methods. The choice of mining method lies completely on the type of host rock that contains the deposit.
Metalliferous deposits can be mined in three ways, i.e., open stoping, back filling and caving method of mining.
Stoping is the process of extracting the desired ore or other mineral from an underground mine, leaving behind an open space known as a stope. Stoping is used when the country rock is sufficiently strong not to collapse into the stope, although in most cases artificial support is also provided.
The specific method of stoping depends on a number of considerations, both technical and economical, based largely on the geology of the ore body being mined. These include the inclination of the deposit (whether it is flat, tilted or vertical), the width of the deposit, the grade of the ore, the hardness and strength of the surrounding rock, and the cost of materials for supports.
A stope can be created in three major ways, i.e., open stoping in which the void created after the extraction is left as it is, cut and fill in which the void created is filled with waste rock or cement or both mixed and caving in which the roof is allowed to cave into the void.
Open stope mining is a non-entry mass production mining method and the most commonly practiced mining method in metal mining industry [1]. In India, open stoping method of mining is employed at mines of RampuraAgucha - Udaipur, Dariba Mines – Mavli, Udaipur division, S K Mines - Bhilwara, Khetri Copper Complex – HCL, Khetri, UCIL – Jharkhand, Hutti and Kolar Gold mines – Karnataka, HZL – Vedanta group – Rajasthan, etc. These mines were found useful in providing an overview of the problem statement and inspiring the geotechnical data essential for creating a numerical model for this research.
There is a compelling need to study the effect of joint orientations for different rock properties lying at different depth of cover in order to propose a useful design method for the open stopes, as, considering the high cost associated with the development of each stope, the economic incentive to produce a smaller number of large open stope is tremendous. On the other hand, the consequences of exceeding the maximum possible stope dimensions can be disastrous. Instability around open stope may cause large remedial costs for ground rehabilitation, delay of production, loss of mining equipment, loss of ore reserves and at the extreme, mine worker injuries or fatalities.
Joints affect the stability of underground openings in three ways:
(1) They cause non-uniform redistribution of stresses in the excavation vicinity, and result in stress rotation that could be detrimental to an otherwise stable excavation. Increased stress may cause rock fracturing when this induced stress exceeds approximately one-third of the unconfined strength of the intact rock.
(2) Joints also provide free surface for movement of rock strata that increase the degrees of freedom of movement of a rock wedge. It can be concluded from this statement that whether joints intersect, or are present at a distance from the excavation, will govern the extent of their influence on the stability of the excavation.
(3) The difference in the rockmass quality between the joints and the adjacent rockmass is another factor that determines the degree of instability in an underground opening.
In accounting for the influence of joints on the stability of an underground excavation, the effects of the following factors on the magnitude of the influence of the joints must be investigated:
• Stress in terms of k (horizontal stress/ vertical stress),
• Excavation geometry,
• Stope dimension
• Dimension of sill and crown pillars
• Dimension of rib pillars
• Strength of the rock (host rock and orebody),
• Joint properties and
• Orientation of joints relative to excavation surface.
The effect of number of joints near or intersecting a given stope surface is beyond the scope of this research. Also it was observed from some research papers that joint effects the overall properties of rock mass [2] and [3]. However, it is suspected that the effect of this is probabilistic. The more the number of joints near a stope surface, the higher the probability that one of the joints will intersect the stope at critical included angle to cause failure for faults and other discontinuities [4].
The extraction of an underground open stope initiates a stress relaxation in the stope hanging wall that generally leads to sloughage of the stope face. Sloughage represents unstable material, located outside the stope limits, which falls or slides into the stope [5].
In situ stresses determine the confinement imposed on the rock mass and are an essential boundary condition for the evaluation of stability [6]. They can have the following effects on stability: Instability may occur if the stress is low since rock blocks may have the freedom to fall out; the rock mass will be well confined and stable if the stress is higher; instability may occur due to rock fracturing if the stress level is sufficiently high.
The following methods are used in the design of underground excavations [7]:
(1) Analytical method
(2) Empirical methods
(3) Numerical modeling, and
(4) Observational methods.
Each of these methods has advantages and disadvantages. It is observed that best results are obtained when all method are applied in the design and construction process.
3.1 Analytical methods
Analytical methods are generally based on the use of closed form solutions, such as Kirsch’s equations, and statics, only simple excavation geometries such as circular openings, and wedges in two-dimensions can be considered using analytical design methods.
3.2 Rockmass classifications and empirical methods
Rockmass classification systems are empirical. Franklin [8] defined empirical design as quantified judgment based on experience. He observed that being based on real data, empirical predictions are often closer to the truth and form the standard against which theoretical predictions are judged.
Of the rock mass classification systems reviewed four systems could be considered for evaluating the stability of stope panels. These systems are:
(1) The Geomechanics Classification or Rock Mass Rating (RMR) system developed by [9].
(2) The Norwegian Geotechnical Institute (NGI), rock quality index or Q system developed by [10].
(3) The Mining Rock Mass Classification or Modified Rock Mass Rating (MRMR) system originally developed by [11]. This system is a modification to the RMR system.
(4) The Potvin’s Modified Stability Graph Method [12] through the use of the Modified Stability Number, N’, originally developed by [13].
3.3 Numerical simulation methods
Advances in numerical modeling and computer technology have added insight into the design of underground openings. Most underground mining excavations are irregular in shape and are often grouped near to other excavations, also, because ore bodies are often associated with geological features such as faults and intrusions the rock properties are seldom uniform in the rock volume of interest. Conventional estimation approaches used for orebody modeling differ in their formulations as well as orebody models they generate from the same original dataset. Similarly, different implementations of the same method will result in somewhat different representations of the orebody being modeled. The same is also true for simulation methods and the orebody models generated [14]. Thus, closed form solutions and analytical methods become of limited value for calculating stresses, displacements and failure of the rockmass surrounding mining excavations. Numerical methods provide approximate solutions to these problems [15]. A methodology is also present for stability analysis of jointed rock mass structures [16].
Software that can be used for modeling the specific numerical model are FLAC3D by ITASCA, ELFEN by Rockfield Software Ltd., 3DEC by ITASCA, FEMGV by TNO DIANA, etc.
A 3D explicit finite difference program, Itasca FLAC3D is used for the analysis. The software is fast, easy to work, commercially available with a license and runs on windows operating system. Furthermore, with its well-established numerical formulation, it provides reliable information on the performance of underground excavations. The result from FLAC3D are digital imagery and a requisite dataset is readily available which can be interpreted by rock mechanics experts. Hence, the software is suitable for the study.
4.1 Methodology
The objectives of this paper are:
(1) To present a method for estimating failure due to joint orientation, and
(2) To analyze the failure observed in the results obtained from the numerical model.
To achieve the first objective, numerical simulations are used to estimate failure for various stope geometry and joint orientations, and stress states. These three factors are considered to be key factors controlling stope performance.
4.2 Procedure followed
The procedure followed for numerical modeling is as follows:
The foremost and most basic demand of the numerical model was stope geometry. Common dimensions are used for modeling the stope, which is generally a stope height of 60 meters, length of the stope as 80 meters, thickness of the stope as 10 meters, stope inclination of 80°, hanging wall and footwall as 10 meter each. Further, sill and crown pillars of 50 meter each are assumed to observe the extent of the failure.
A grid was generated using “generate zone brick” command. Two different groups naming host and metal were created to differentiate host rock and orebody. Fifteen different brick blocks were created to align the blocks as per the stope geometry. Mesh density was kept dense around the stope and sparse at farther areas so as to obtain high precision results in terms of failure depth and for achieving a faster processing speed. Grid consists of ten partitions each for a length of 10 meter near the stope thus making one partition equal to one meter and the larger partitions are 10 meter each. A total of 45,000 zones were created at 49,011 grid points. An isometric view and a cutting plane view of the model are shown in Figure 1 and Figure 2 respectively.
Figure 1. Isometric view of the numerical model created in FLAC3D
A FISH function was defined and named as “parameters” to input the parameters, which consists of measurements of stope dimensions (stope height, stope thickness, stope length, stope inclination), length of sill and crown pillars, length of hanging and footwall and joint cohesion and joint tension.
4.3 Input parameters
Stope Height -sh = 60
Stope Thickness -st = 10
Stope Length -sl = 80
Stope Inclination - si = 80°
Sill Pillar - sp = 50
Crown Pillar - cp = 50
Hanging wall - iw1 = 10
Footwall - iw2 = 10
Figure 2. Isometric view of the model at cutting plane x=30
4.4 Material characteristics
In next step material properties were assigned to the model. Ubiquitous joint model was selected for the model as our prime focus was to study the effects of joint orientation on the stability of the stope. The ubiquitous-joint model corresponds to a Mohr-Coulomb material that exhibits well-defined strength anisotropy due to embedded planes of weakness. Hence, parameters like bulk modulus, shear modulus, cohesion, tension and friction angle can be assigned with the help of this model. Bulk modulus (B.M.) and shear modulus (S.M.) were verified with the Poisson’s ratio (P.R.) and Young’s modulus (Y.M.) with the help of the formula –
B.M. = Y.M. / 3(1 – 2 * P.R.)
S.M. = Y.M. / 2(1 + P.R.)
k = Horizontal Stress / Vertical Stress.
The following properties were assigned:
Rock:
Density - 2000 kg/m3
Bulk Modulus - 1e8 = 1 GPa
Shear Modulus - 7e7 = 70 MPa
Friction angle - 40°
Cohesion - 20e6 = 20 MPa
Tension - 2e6 = 2 MPa;
Joint Plane:
Joint Direction - 90°
Joint Friction angle - 30°
Joint Dilation angle - 0°
Joint Tension – Variable (Range – 1e6 = 1 MPa, 8e5 = 0.8 MPa, 4e5 = 0.4 MPa, 2e5 = 0.2 MPa)
Joint Cohesion – Variable (3 times joint tension);
4.5 Stress initialization and model validation
Stresses were initialized in the model to validate the design after properties were assigned. An initial stress of 6 MPa was applied while keeping the k value as one (which implies both horizontal and vertical stresses are having same values). Following results were obtained after the test run which shows that the grid mesh is uniformly discretized.
4.6 Final model Run
Upon successful validation of the model, twelve cases were analyzed to observe the effects of joints on the assumed stope, in which joint orientation was varied from 0° to 180° from the horizontal at a regular interval of 15° forming a total of twelve joint planes and each plane orientation was observed for rock joint tension of 1 MPa, 0.8 MPa, 0.4 MPa and 0.2 MPa forming a total of 48 cases. Each of the case is evaluated for a varying ‘k’ value of 1.0, 1.5 and 2.0. Hence a total of 144 cases were analyzed. Each model was run for 3800 steps and an image output was obtained for each case which shows the amount of failure occurred into the numerical model.
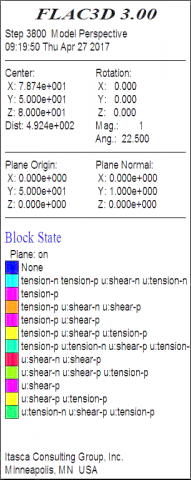
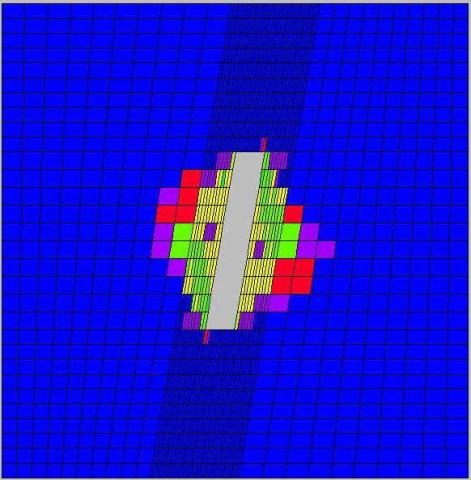
Figure 3. Legend of zones in the observation figures
The images obtained from the model run in numerical model in FLAC3D shown in figure 4 to figure 6 with color legends shown in figure 3 that the failure has occurred variably in different regions of the model. For different combinations of ‘k’ values, and rock strengths, it is observed that for a certain range of joint orientation, behavior of failure is variable in crown, sill and middle of the stope.
|
k = 1 Joint Tension = 0.2MPa Joint orientation 15° |
k = 1 Joint Tension = 0.2MPa Joint orientation 75° |
A part of the discussion for joint tension 0.2 and k = 1 and k = 2 is shown below.
Summary
The inferences derived from the image analysis are twofold–
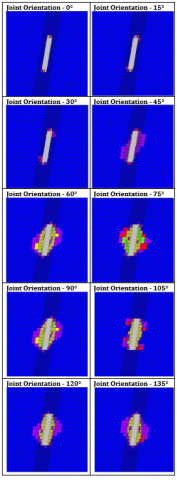
Description: Three types of failures are majorly observed in the stope model geometry for different joint plane orientations with respect to horizontal:
(1) 0° to 30° - This region observes little or no failure because of high strength of the rock material and hence the stress is not enough to fail the rock in either tension or shear.
(2) 45° to 120° - Starting from 45° orientation of the joint plane, failure starts to begin on the plane parallel to the plane of weakness, further increasing quantitatively as the joint orientation angle increases towards 90° showing a failure in an elliptical shape having an orientation parallel to the orientation of weakness plane.
(3) 135° to 160° - The failure is observed similar to that occurred in 45° to 105° range except that the orientation of the ellipse changes from crown pillar of footwall and sill pillar of hanging wall to crown pillar of hanging wall and sill pillar of footwall respectively.
Maximum zone of failure is seen when the joint direction is parallel to stope geometry, i.e., 80° from the horizontal.
Figure 5. Images illustrating variation in the failure behavior at different joint orientations at Joint Tension 0.2 MPa & k=1
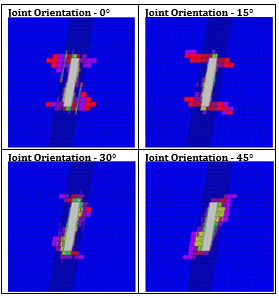
Description: Three types of failures are majorly observed in the stope model geometry for different joint plane orientations with respect to horizontal:
(1) 165° to 180°, 0° to 20°- When the orientation of joint plane is in this range, the plane of weakness lies more than 55° and less than 90° from stope geometry. In this case, failure is observed in the sill and crown pillars of the hanging wall and footwall.
(2) 30° to 90°- Hanging wall seems to fail at the sill pillar and footwall is failing at crown pillar. At 75° to 85° the values are greater than other weakness planes.
(3) 100° to 160° - The failure zone occur in a similar fashion to above point but the orientation of the zone seems to occur at the crown pillar of hanging wall and sill pillar of footwall.
Failure zone propagates in a parallel direction with the orientation of joint plane When the weakness plane is parallel to the stope, the failure also occurs in the same plane, while when the weakness.
Figure 6. Images illustrating variation in the failure behavior at different joint orientations at Joint Tension 0.2MPa & k=2
An open stope is a large underground structure which is needed to stand upright for a long duration or till the mining activities is completed. The stability of the structure is affected if a joint is present near to the stope. The effect of joint orientation is studied in this research and following conclusions can be made upon thorough analysis.
(1) Value of k has a considerable effect on the stability of the stope. When the horizontal stresses are more than vertical, major failure occurs at the center of the stope and the sill and crown pillars face maximum failure when vertical stress is more than horizontal stress.
(2) Failure behavior shows a gradual behavior when joint tension ranges from 1MPa to 0.8MPa and then from 0.4MPa to 0.2MPa. In former values it shows a similar pattern in failure and the latter two shows a similar behavior. It can be concluded that as the cohesion decreases, the rate of failure increase.
(3) An elliptical shaped failure zone is formed around the stope which shows that immediate wall in hanging and footwall experiences maximum depth of failure. Also, the major axis of the ellipse orients parallel to the orientation of the joint plane.
(4) Maximum failure is observed when the orientation of joint plane is parallel to the stope surface, i.e., 60° to 135° with an exception at 105° where, in some cases, a sudden fall in failure depth is observed.
[1] Potvin, Y., Hudyma, M. (2000). Open stope mining in Canada. 91st CIM AGM, At Quebec City, 5: 661-674.
[2] Avchar, A.E.B.S. (2017). Applicability of size strength rippability classification system for laterite excavation in iron ore mines of Goa. ASME IIETA Publication Series Modelling, Measurement and Control, 78: 378-391. https://doi.org/10.18280/mmc_c.780309
[3] Avchar, A.K., Choudhary, B.S., Budi, G., Sawaiker, U. (2018). Effect of rock properties on rippability of laterite in iron ore mines of goa. Mathematical Modelling of Engineering Problems, 6: 108-115. https://doi.org/10.18280/mmep.050208
[4] Suorineni, F., Tannant, D., Kaiser, E.P. (1999). Determination of fault-related sloughage in open stopes. International Journal of Rock Mechanics and Mining Sciences, 36(7): 891-906. https://doi.org/10.1016/S0148-9062(99)00055-8
[5] Virginie, U., Kamran, E. (2016). A stability-economic model for an open stope to prevent dilution using the ore-skin design. International Journal of Rock Mechanics and Mining Sciences, 82(2): 71-82. https://doi.org/10.1016/j.ijrmms.2015.12.001
[6] Swart, A.H., Handley, E.W. (2005). The design of stable stope spans for shallow mining operations. Journal of the South African Institute of Mining and Metallurgy, 105(4): 275-286.
[7] Suorineni, F.T. (1998). Effects of Faults and Stress on Open Stope Design. Ph. D. Thesis. University of Waterloo, Canada.
[8] Franklin, J.A. (1993). 32 – Empirical Design and Rock Mass Characterization. Analysis and Design Methods, 795–806. https://doi.org/10.1016/B978-0-08-040615-2.50038-1
[9] Bieniawski, Z.T. (1979). Engineering classification of jointed rock masses. South African Institute of Civil Engineers, 15(12): 335-343.
[10] Barton, N., Lien R., Lunde, E.J. (1974). Engineering classification of rock masses for the design of tunnel support. Rock Mechanics and Rock Engineering, 6(4): 189–236.
[11] Taylor H.W., Laubscher, E.D.H. (1976). Geomechanics classification of jointed rock masses - mining applications. Trans. Inst. Min. Metall, 86: 119-128.
[12] Potvin Y., Hadjigeorgiou, E.J. (2001). The stability graph method for open stope design. Underground Mining Methods, 547-554.
[13] Mathews, K., Hoek, E., Stewart, W.D.C.E.S. (1981). Prediction of stable excavations for mining at depth below 1000 meters in hard rock. CANMET Report, 39.
[14] Dimitrakopoulos, R., Grieco, N.E. (2009). Stope design and geological uncertainty: Quantification of risk in conventional designs and a probabilistic alternative. Journal of Mining Science, 45(2): 152-163. https://doi.org/10.1007/s10913-009-0020-y
[15] Hoek, E., Diederichs, E.M.S. (2006). Empirical Estimation of rock mass modulus. International Journal of Rock Mechanics and Mining Sciences, 43(2): 203-215. https://doi.org/10.1016/j.ijrmms.2005.06.005
[16] Jaiswal, A., Shrivastva, E.B.K. (2012). A generalized three-dimensional failure criterion for rock masses. Journal of Rock Mechanics and Geotechnical Engineering, 4(4): 333-343. https://doi.org/10.3724/SP.J.1235.2012.00333